

Today we have the Federal Open Market Committee (FOMC) and ADP employment reports to be released, but the impact on the market is expected to be very limited as the market has already anticipated a delay in the rate cut.
Let’s start with the daily chart today.
【BTC Daily】
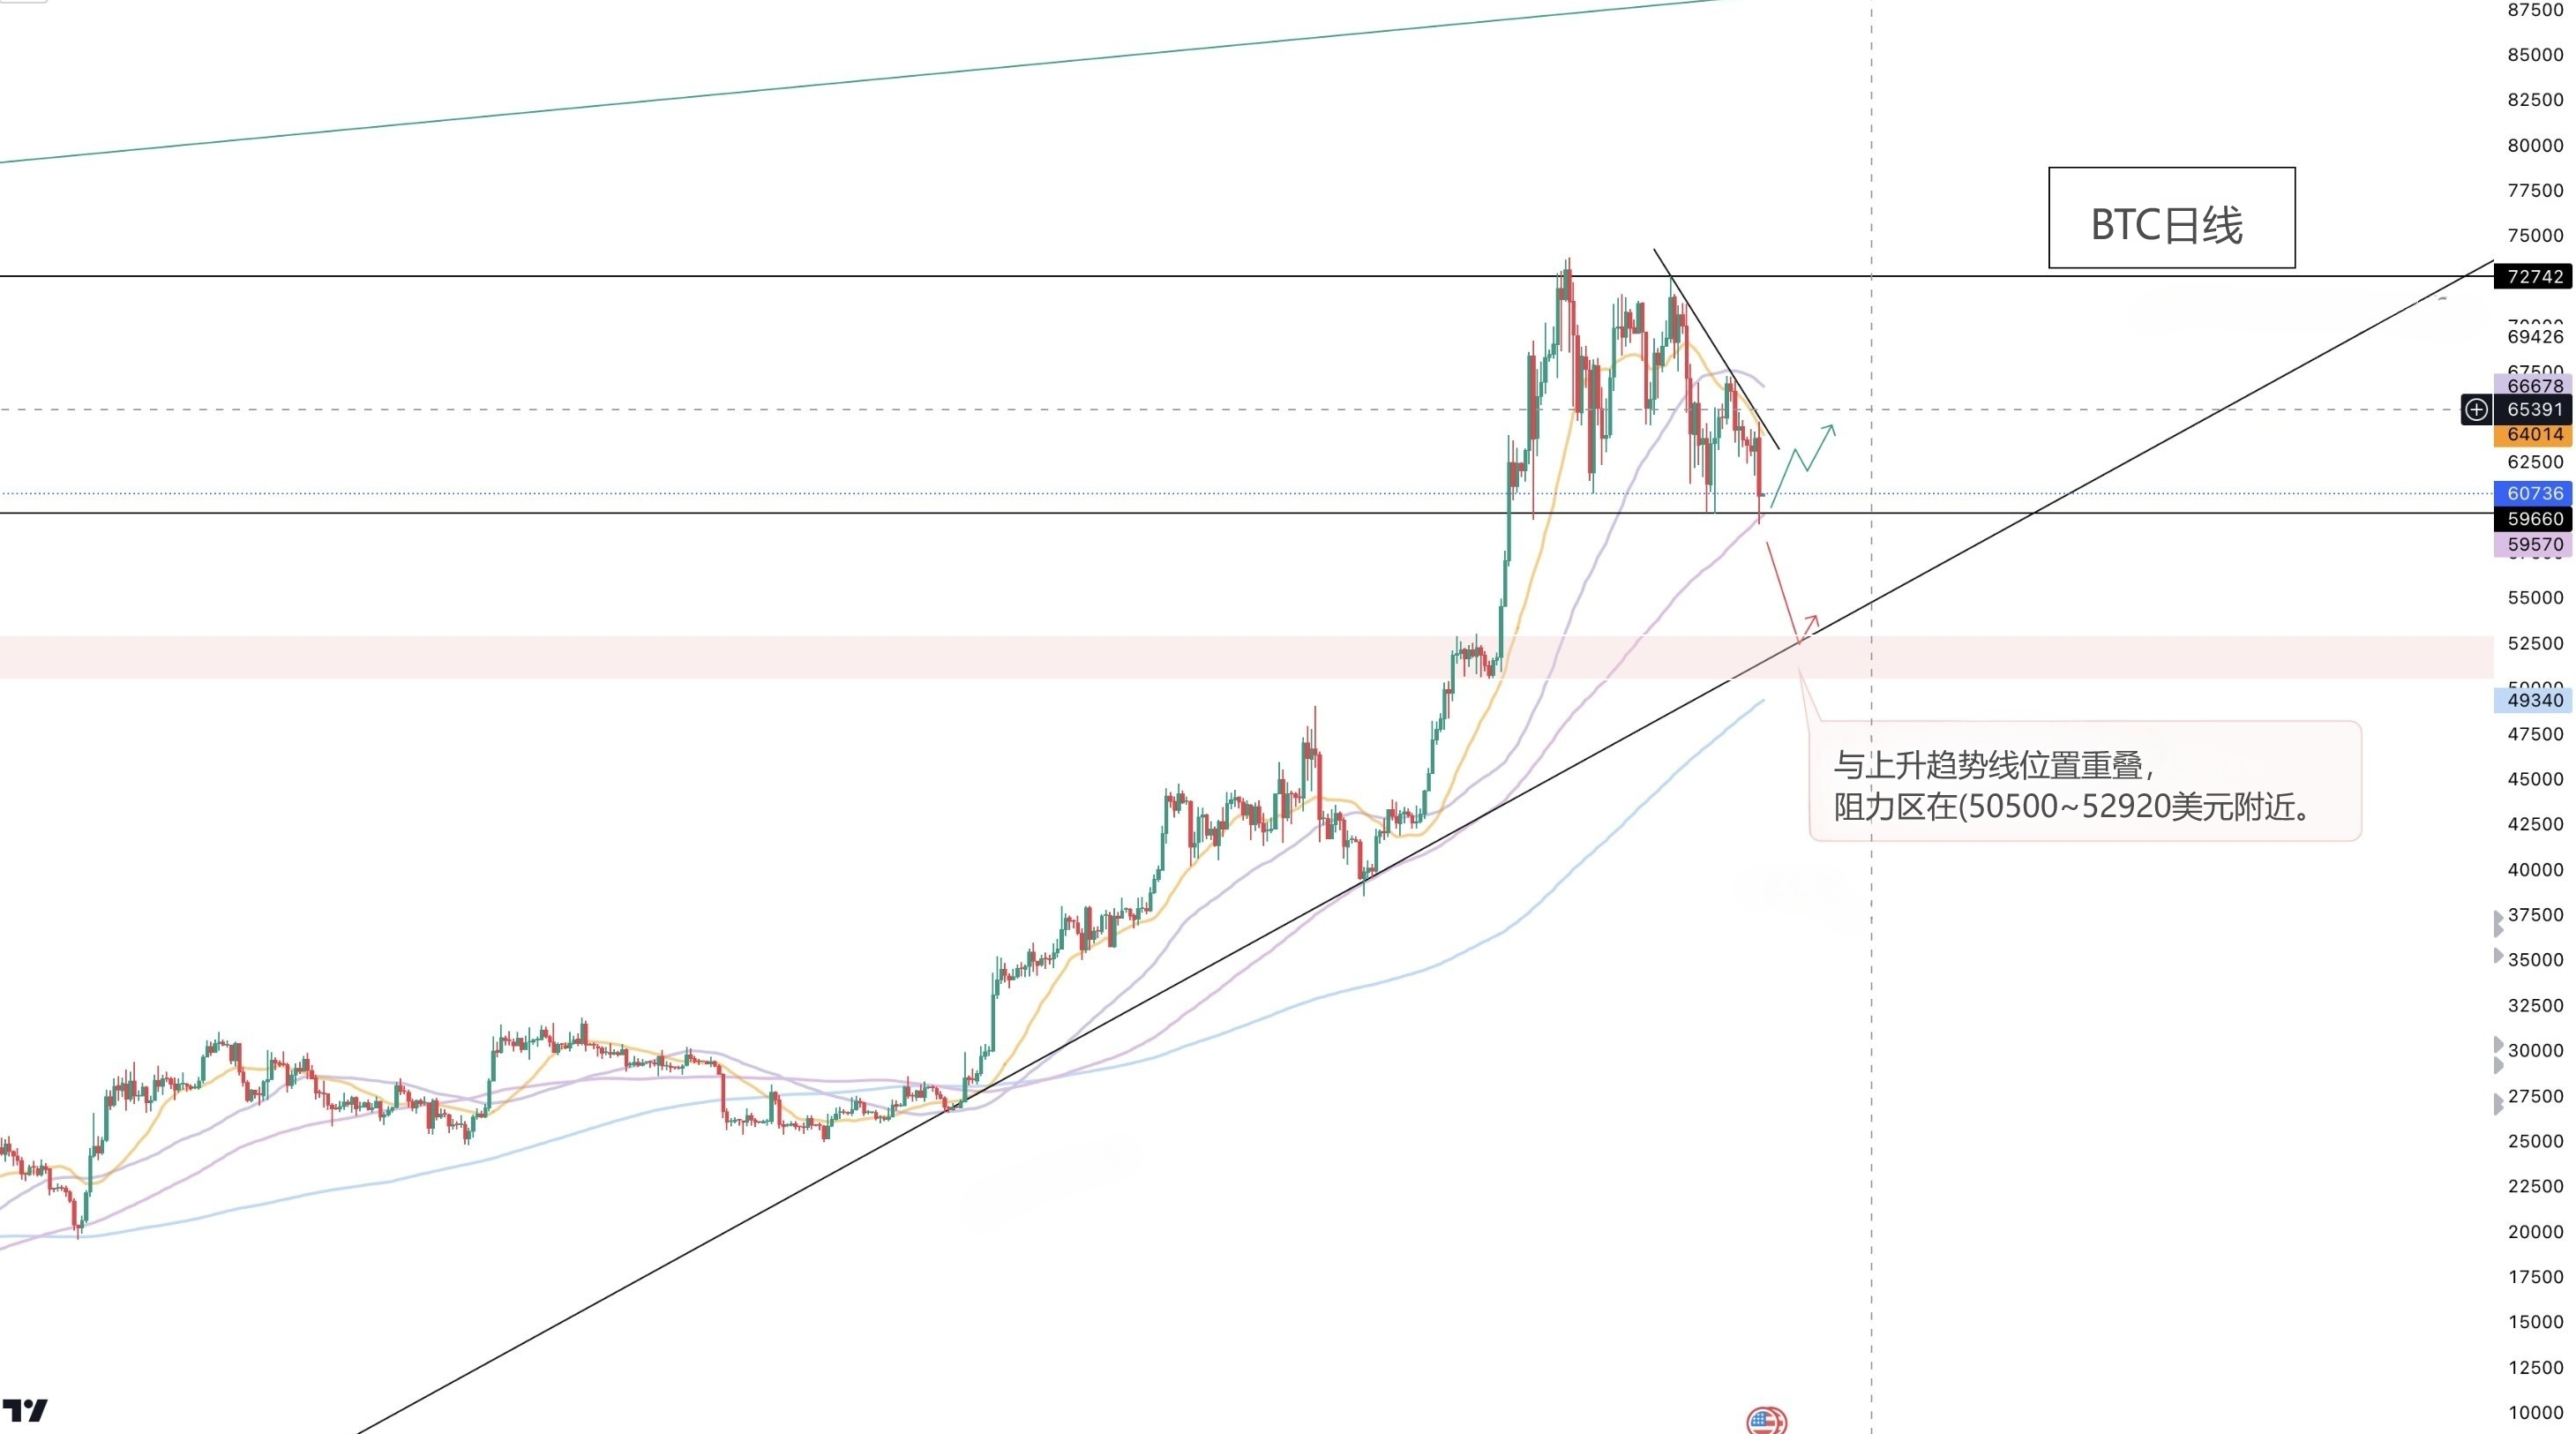
The current price is falling at the resistance of the daily 20-day moving average and the descending line of the highs, although it has rebounded at the daily 100-day moving average.
But if it falls below the support of the daily 100-day moving average, BTC is expected to fall to the rising trend line since October 2023, which is close to the 200-day moving average at the daily level.
Therefore, if BTC wants to rise again, it needs to break through these two resistance points at the daily level.
【4-hour line】
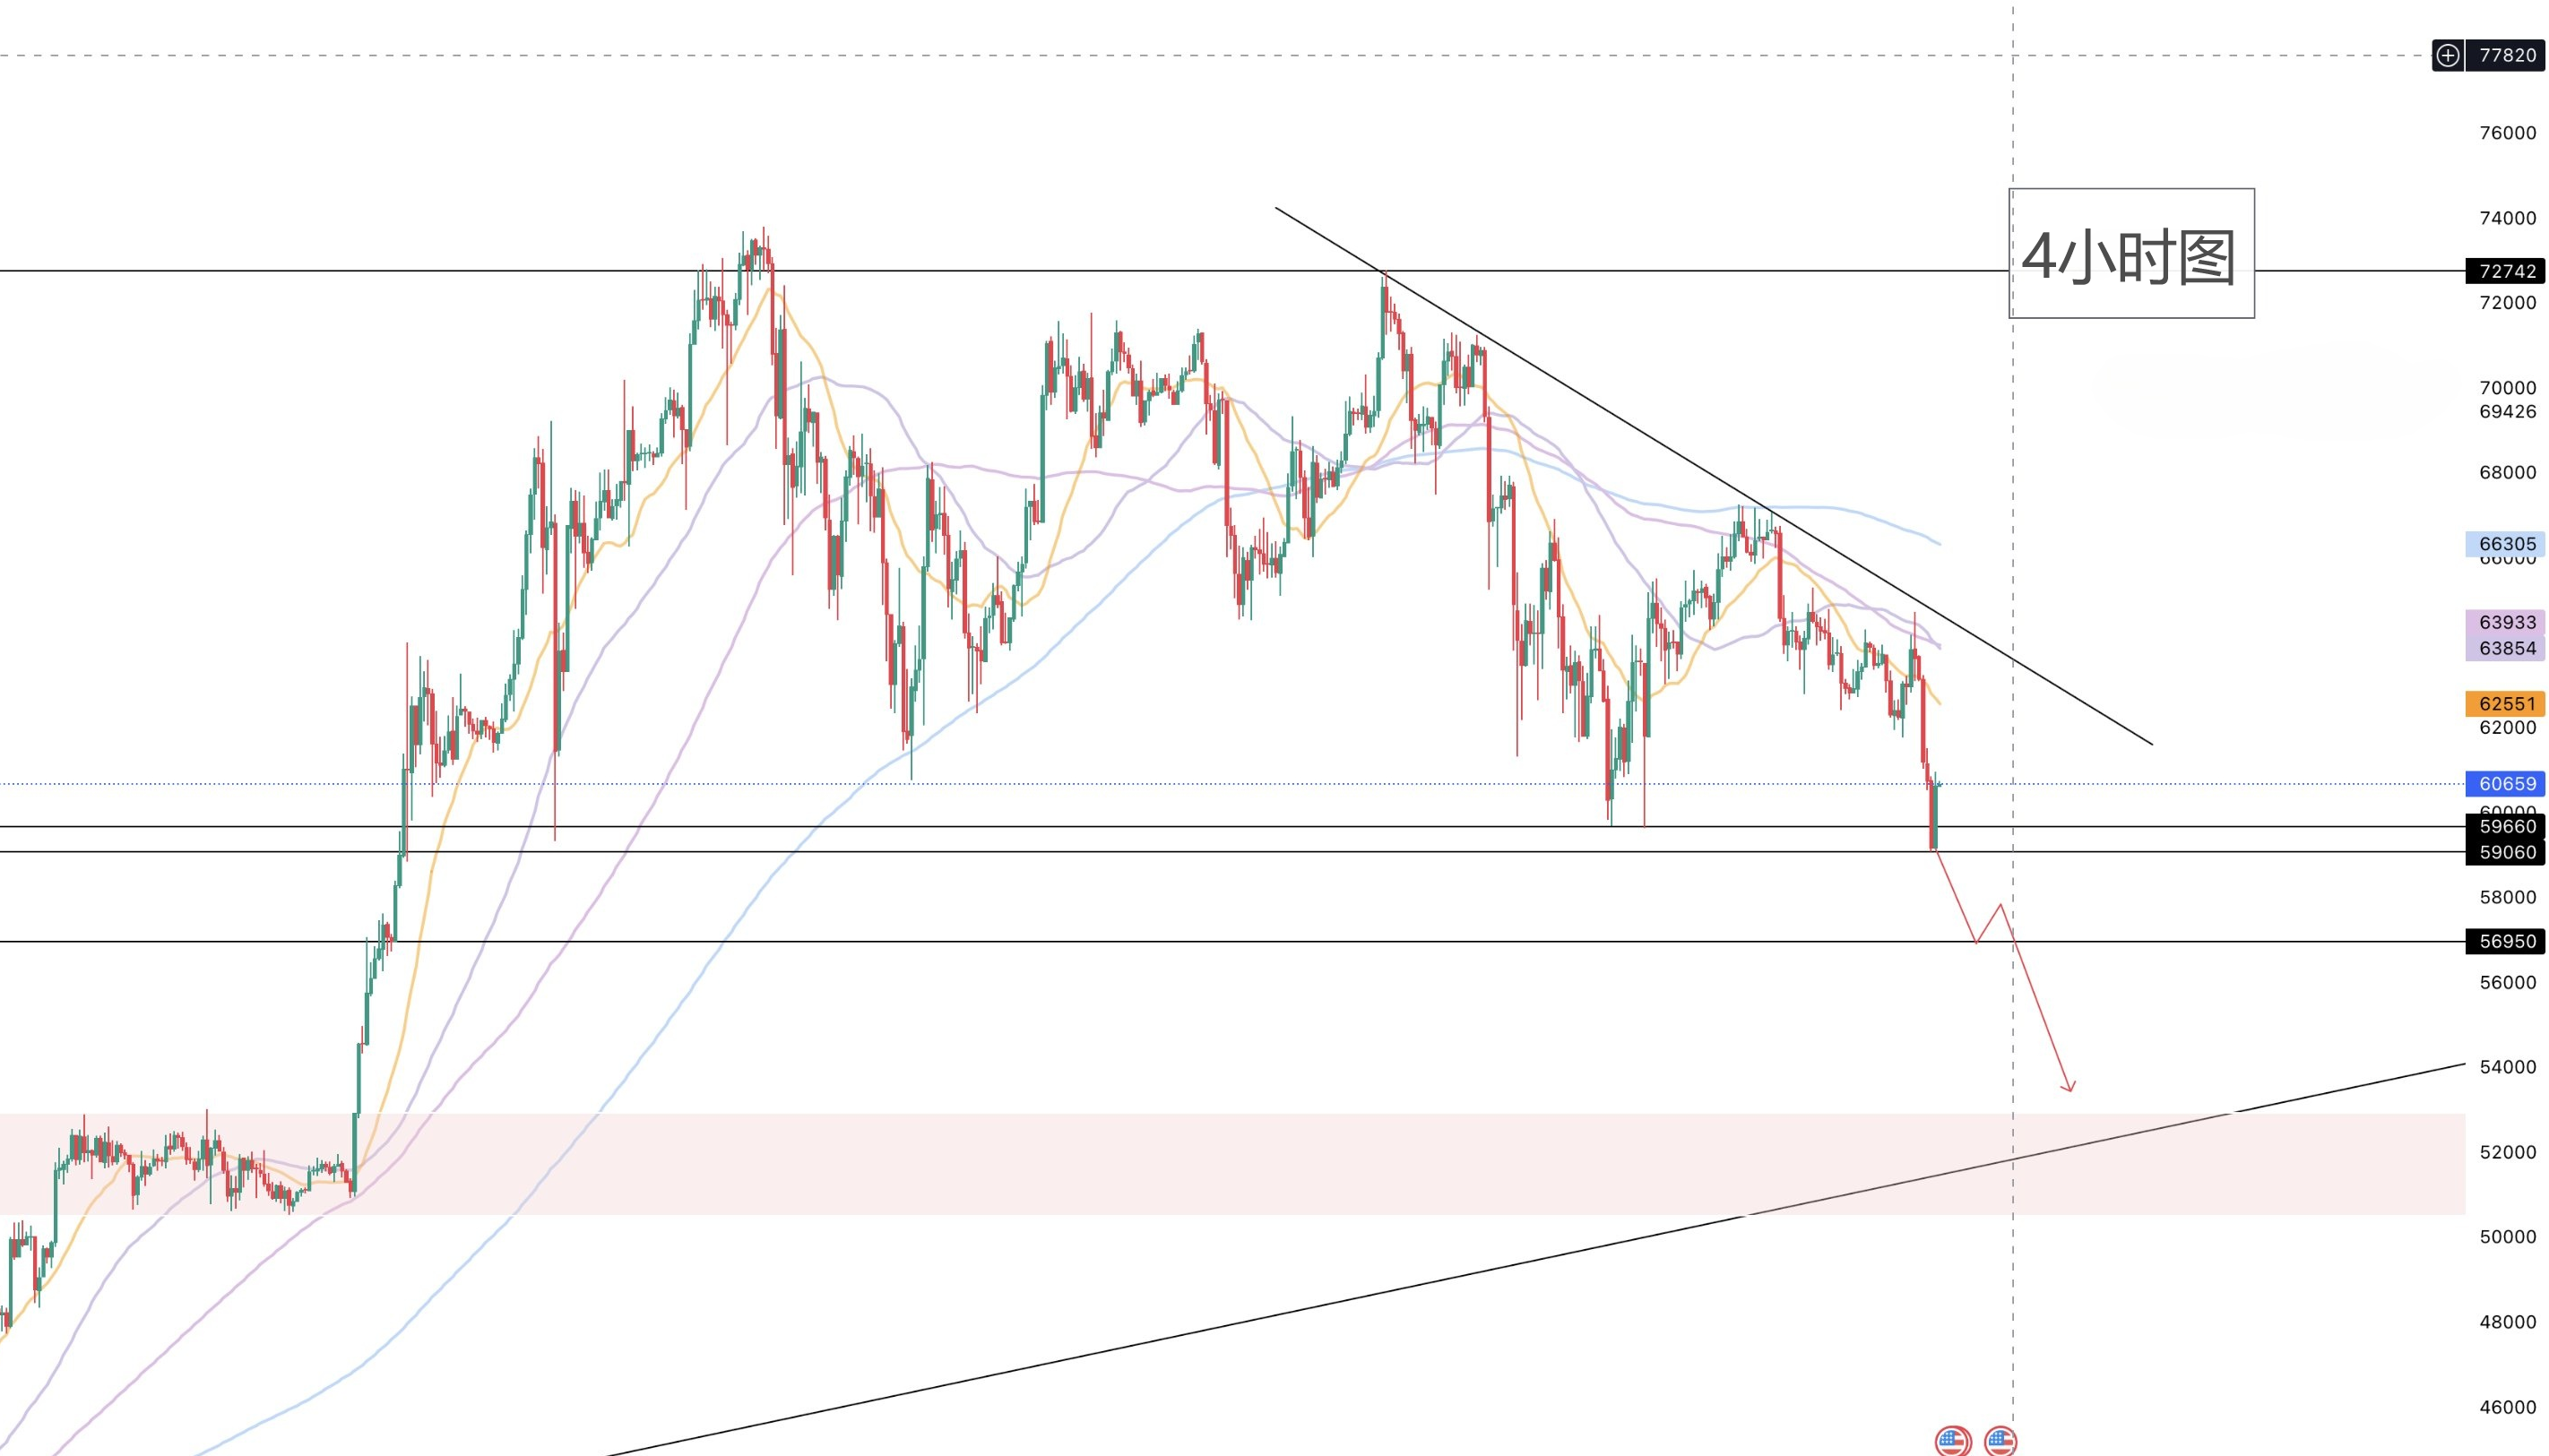
On the 4-hour chart, the price rebounded around $59,060 (near the 100-day moving average on the daily chart). If the support works, then in the short term, you can start looking for long opportunities from here.
If it falls below $59,060, the price is expected to fall to around $56,950.
【1 hour line】
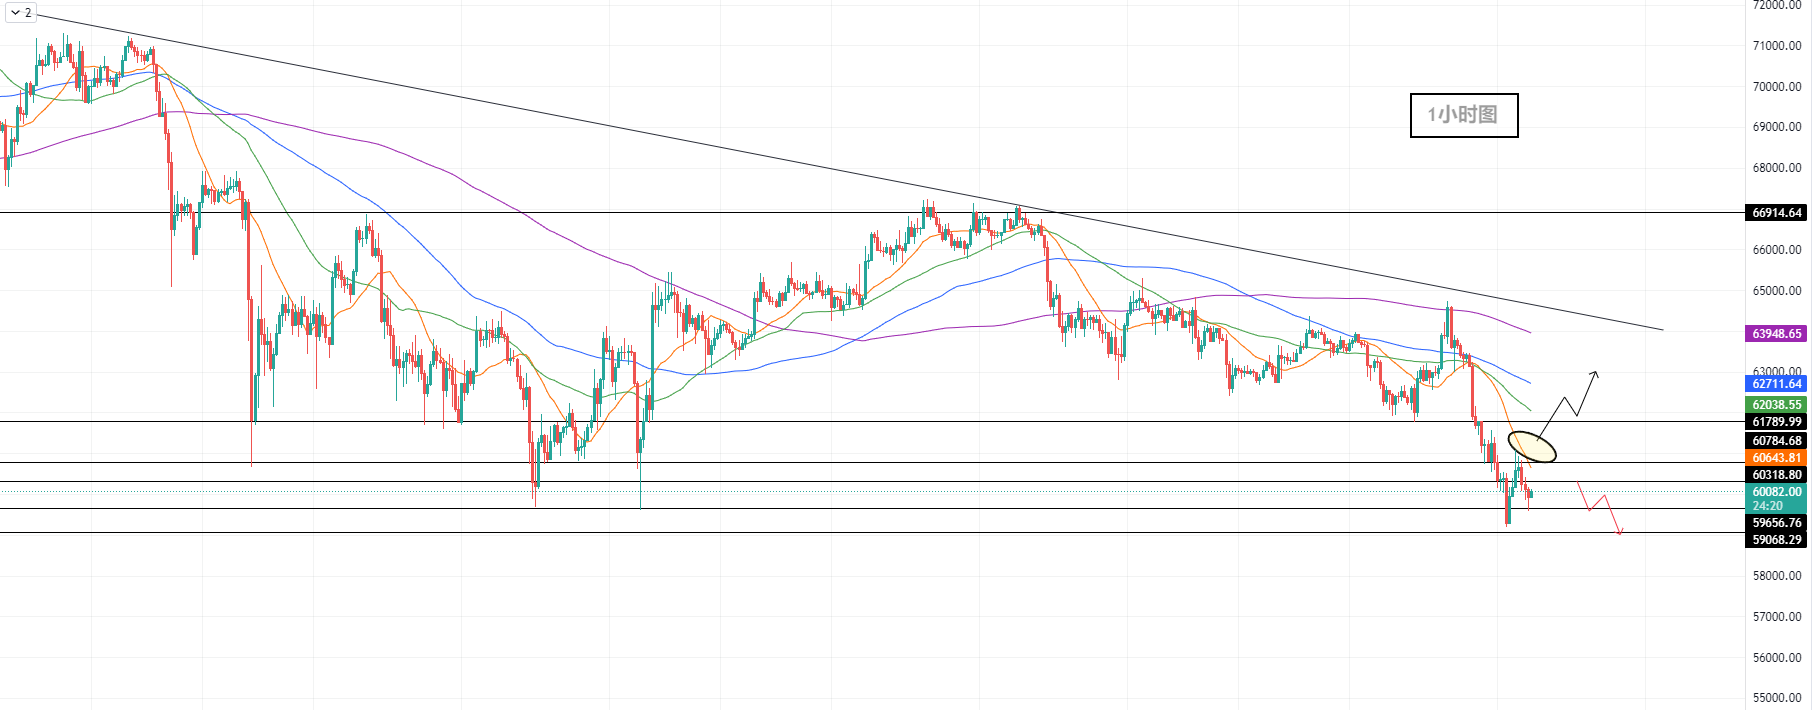
From a short-term perspective at the 1-hour level, BTC is rebounding slightly. Although I wanted to long near $60,960 in the early morning, because the 20-day moving average at the 1-hour level in the morning is rebounding near $61,120, friends who want to enter the market and long during the day can consider these two areas:
20MA moving average (60648) -60960 long defense 500 target 61800-62400
If the 20-day moving average of the 1-hour line breaks through, the price is expected to rise to $61,780. If it continues to rise, friends who hold long trades need to pay attention due to the movement of the 50-day and 100-day moving averages at the 1-hour level.
Because from the perspective of the moving average, there is still a downward trend, so the master believes that there is no need to force a long.
Originally, $60,790 was a resistance level. If the price stagnated here, you should not go long the trend. If the resistance near $60,790 was broken and broke through $60,350.
Then you can consider short in these two areas: 62400-62700 short defense 500 target 62000-61500
The content of this article is exclusively planned and released by Master Chen (public account: Master Chen, the God of Coins). If you need to know more about real-time investment strategies, unwinding, spot contract trading methods, operating skills, and K-line knowledge, you can add Master Chen to learn and communicate. I hope it can help you find what you want in the crypto. Focusing on BTC, ETH and Altcoin spot contracts for many years, there is no 100% method, only 100% going with the trend; daily updates of macro analysis articles, technical indicator analysis of mainstream coins and Altcoin, and spot mid- and long-term review price forecast videos.

Warm reminder: Only the column public account (pictured above) in this article is written by Master Chen. The other advertisements at the end of the article and in the comment area have nothing to do with the author himself! ! Please carefully distinguish the true from the false. Thank you for reading.


