

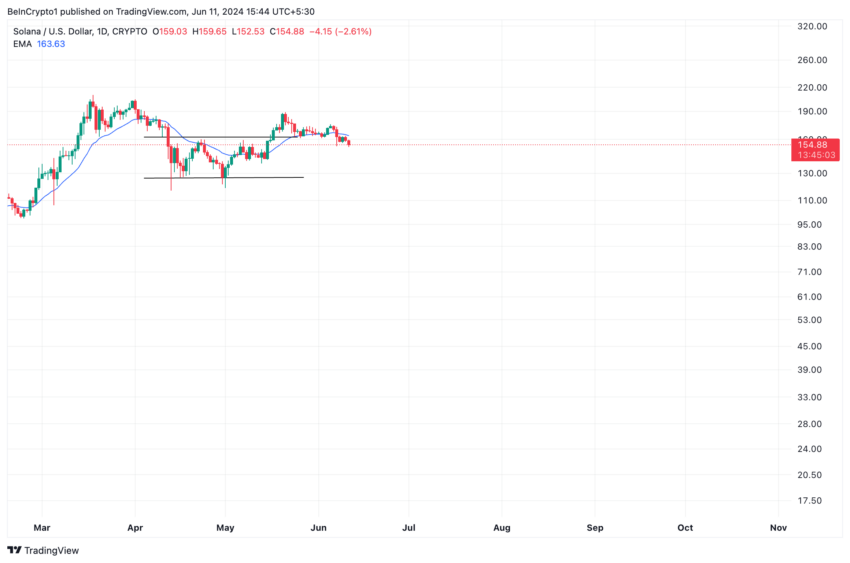
Solana (SOL) was trending within a horizontal channel from April 13th to May 15th. As buying momentum gained momentum, the bulls began a rally above the upper line of this channel, and on May 16th SOL broke through that level.
As demand for altcoins surged, the price peaked at $187 on May 20. However, it then showed a downward trend and fell back below the breakout level of $162.
Solana price continues to fall
At press time, Solana (SOL) is trading at $154. This is a 5% decline from the breakout level. This altcoin is currently trading below its 20-day exponential moving average (EMA).
This tracks the average price of SOL over the last 20 days. If the price of an asset falls below this key moving average, it means the asset is trading below its average price over the last 20 days. This is a sign that buying pressure has decreased and a coin selling rally has begun.
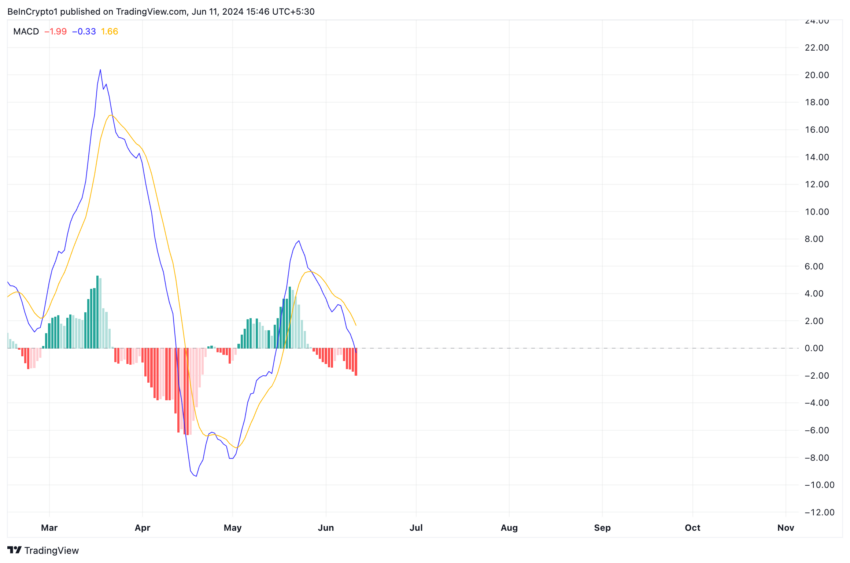
Looking at SOL's Moving Average Convergence Divergence (MACD) reading, we can see a surge in selling pressure among market participants. The coin's MACD line (blue) is currently below the signal (orange) and is trending towards the 0 line at the time of this writing.
This indicator identifies changes in price strength, direction, and momentum of an asset. When the MACD line crosses below the signal line, it is considered a bearish signal. This suggests that bears will take control and put downward pressure on asset prices.
Read more: What is Solana (SOL) ?
Traders often interpret this as a signal to exit short positions and take long positions .
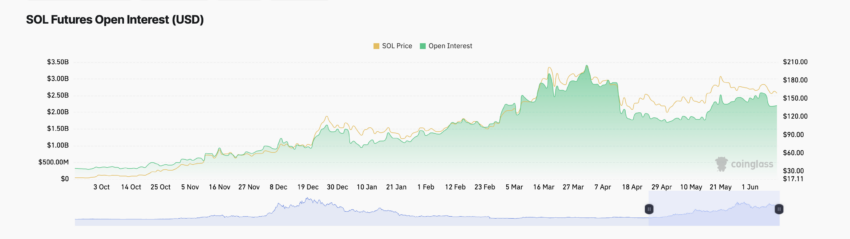
SOL price prediction: liquidation of positions for futures traders
This bias is no different among traders in the coin’s futures market. Since early June, SOL's open futures contracts have been trending downward. Open interest, which was $2.2 billion, has since declined 15%.
Futures Open Contracts for an Asset Tracks the total number of open futures contracts or positions that have not been liquidated or settled. A decline in this way means an increase in the number of traders closing positions rather than opening new ones.
This is often considered an indicator of a shift in sentiment from bullish to bearish.
SOL’s negative weight sentiment confirms this shift. At press time, it was below zero at -0.32. This on-chain indicator tracks overall market sentiment for the asset. At this value, SOL's weighted emotionality means that there are more negative than positive mentions.
If this bias holds for the coin and the resulting selling pressure gains momentum, the value could fall all the way to $135.
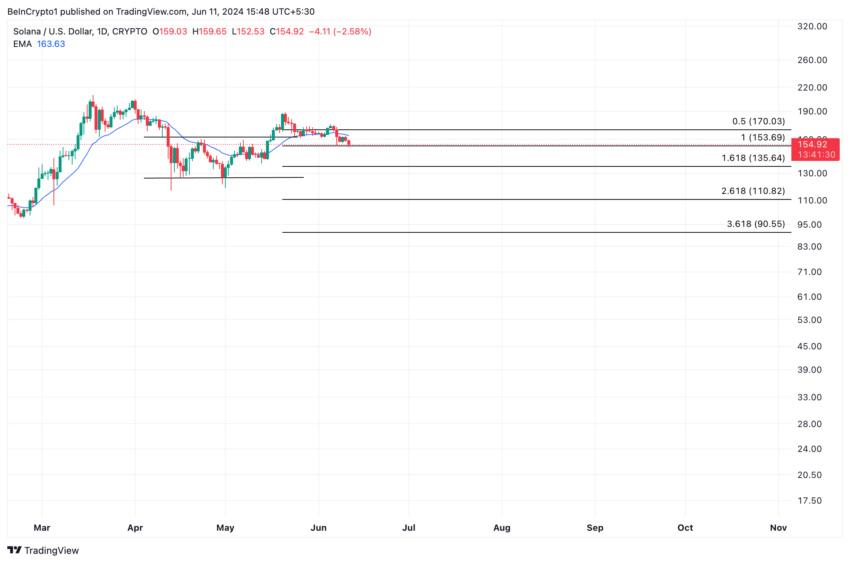
However, if bulls force a takeover and buying pressure surges , SOL's price could rise to $17.03 .
Trusted
The information contained on the BeInCrypto website is published in good faith and for informational purposes only. Users are solely responsible for any consequences arising from their use of information on the website.
In addition, some content is an AI-translated version of the English version of BeInCrypto articles.


