

Solana (SOL) has been in a downward trend since May 21st, forming a descending channel. Trading at $146.91 at press time, the altcoin is currently trading at its lowest levels of the past month.
With the price trending close to the lower line of the descending channel, the price of SOL may fall further if the bulls fail to defend the support level.
Solana Bulls Have Support to Defend
Solana has fallen 18% since it began its downward trend on May 21st. It then formed a descending channel, a bearish signal that suggests continued selling pressure .
The upper line of this channel acts as a resistance line and the lower line represents support. SOL's decline over the past few weeks has led to support at $139.54. If the price of an asset approaches a level where it previously found support, bulls may step in to defend it.
If the uptrend is successful and support holds, the asset price may rebound towards the upper resistance level. However, if the support line is broken, the bearish trend may continue and the asset value may fall further.
Sentiment following SOL remains fairly bearish, making it unlikely that bulls will be able to successfully defend the support line. Since June 1, SOL's weighted sentiment has been negative. As of this writing, the coin’s weighted sentiment is -0.28.
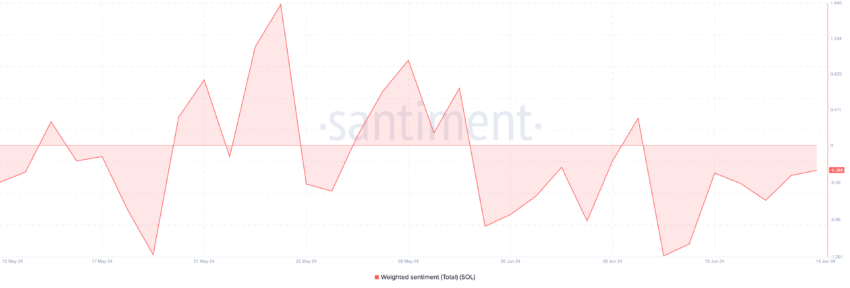
This indicator measures the overall positive or negative sentiment towards an asset. A negative value means there is a large negative bias toward that asset.
Additionally, the decline in SOL futures open interest confirms the negative sentiment of market participants. At press time, SOL's futures open interest was $2.12 billion. It has fallen consistently by 18% over the past ten days.
Read more: How to Buy Solana (SOL) and Everything You Need to Know
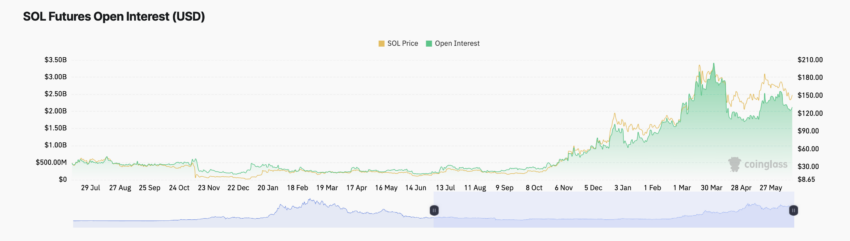
SOL's Futures Open Contracts tracks the total number of open futures contracts or positions that have not been liquidated or settled. When it falls, more traders close their positions rather than opening new ones.
SOL Price Prediction: Selling Must Be Stopped
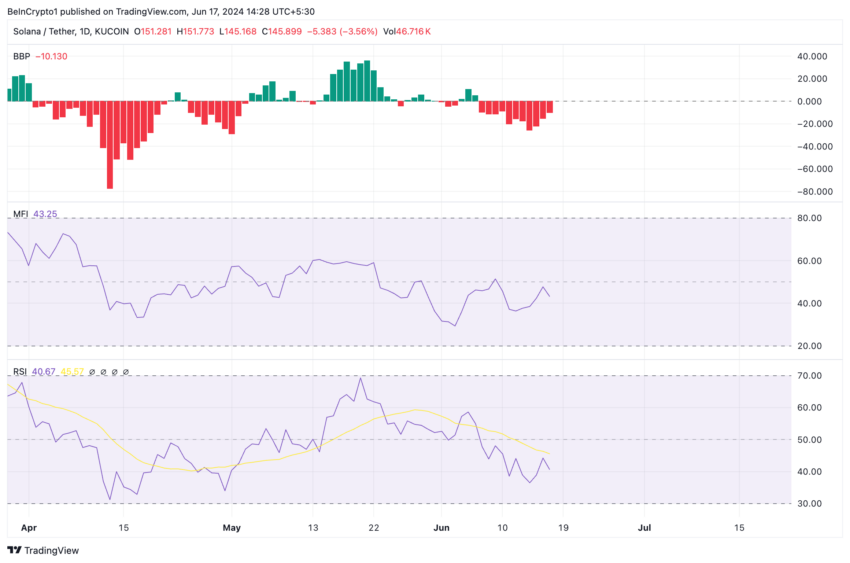
SOL’s key momentum indicators show increasing selling of the coin among market participants. For example, the Relative Strength Index (RSI) is 41.07 and the Money Flow Index (MFI) is 41.07.
These indicators measure the price momentum of an asset and identify potential buying and selling opportunities. A low number is a sign of low buying activity .
Additionally, the Elder-Ray index has been negative since June 7th. This indicator measures the strength of bullish and bearish trends in the market. A negative value means that a bearish trend is dominant in the market. As of this writing, SOL's Elder-Ray index is -9.8.
If bears continue to dominate the SOL market and selling pressure remains high, the value of the altcoin could fall below $140 and trade at $139.54.
Read More: Solana (SOL) Price Prediction 2024/2025/2030
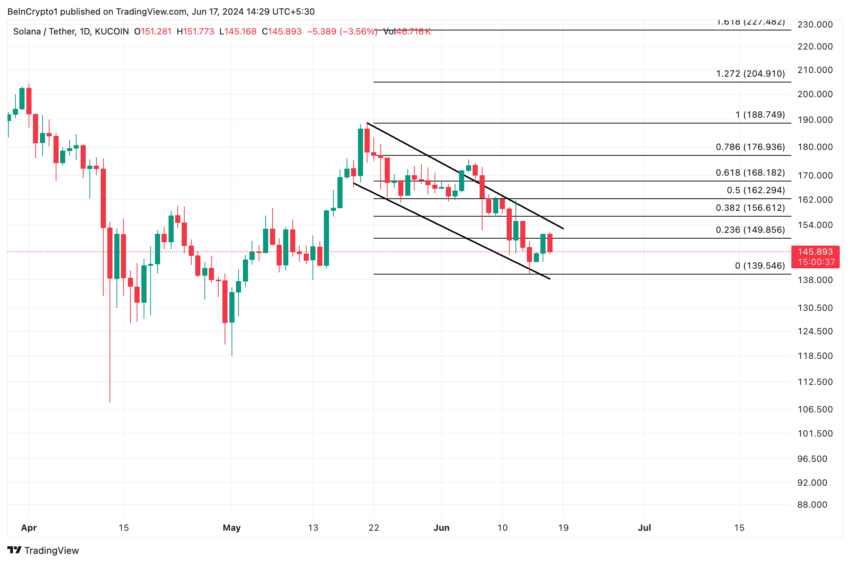
However, if the strength reemerges and buying activity returns to the SOL market, the price could rise to $149.85.
Trusted
The information contained on the BeInCrypto website is published in good faith and for informational purposes only. Users are solely responsible for any consequences arising from their use of information on the website.
In addition, some contents are AI-translated English versions of BeInCrypto articles.


