

All three major cryptocurrencies had a somewhat weak week, with Bitcoin (BTC) falling while Ethereum (ETH) and Ripple (XRP) bottomed out. All three assets are likely to maintain this outlook over the weekend.
BeInCrypto analyzed how far Bitcoin, Ethereum, and Ripple could fall during this bearish week.
Bitcoin price decline
Bitcoin price has followed a bearish double top pattern over the past month. A double top pattern is a bearish reversal pattern in which two highs form at similar levels, indicating strong resistance.
This means that if the resistance level is not broken twice, the price of the asset is likely to fall.
When BTC broke below the neckline, intense weakness ensued. As a result, the cryptocurrency fell from $67,504 to a trading price of $63,6723. BTC is now close to the target price of $63,068 set following the bearish pattern and could achieve this over the weekend.
Read more: Bitcoin Halving History : Everything you need to know
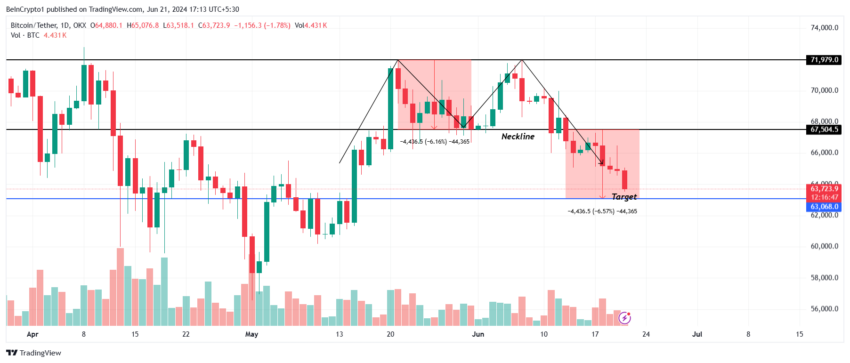
At the same time, a rebound in the price of Bitcoin is also expected. However, if it comes earlier than that, Bitcoin could reclaim the support of $64,00 and $66,000. This could enable a recovery and invalidate the bearish logic.
Ethereum price recovery halted
The price of Ethereum is bottoming out between $3,496 and $3,669. This level forms the 38.2% and 50% Fibonacci retracements. Ethereum has been within this range for the past two weeks after losing support at $3,700.
It remains to be seen whether the price of Ethereum will be able to break above or below the bottoming range. However, it is very likely that the sideways trend will continue this weekend as well.
Read more: How to invest in Ethereum ETF?
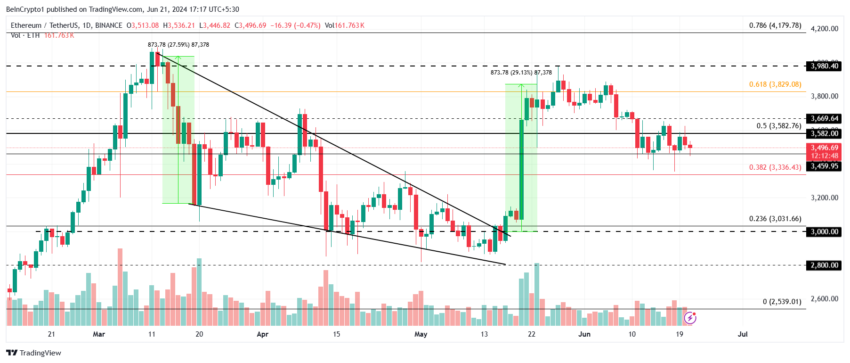
This bearish, neutral logic would be invalidated if one of the range limits were broken, which could push Ethereum up to $3,800 or down to $3,200 on the charts.
XRP price also fails to see a rally
XRP price, which fluctuates between $0.47 and $0.52, is facing weakness after a failed ascending triangle. Changing hands at $0.49 could take the altcoin back to the $0.51 support bottom, which could also turn the 23.6% Fibonacci retracement into support.
The sideways movement may continue as broad market signals are currently not supporting a recovery. The aforementioned flooring extents may remain in place for the time being.
Read more: Ripple (XRP) Price Prediction 2024/2025/2030
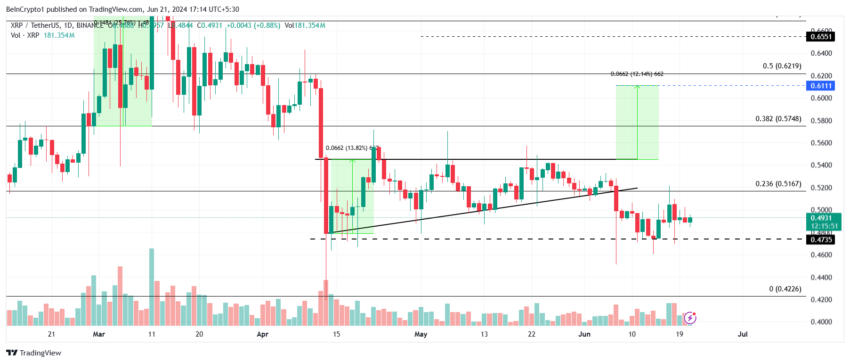
Nonetheless, the price could fall if XRP holders move to offset losses by selling their holdings. In this case, a drop below $0.46 could invalidate the bullish neutral logic.


