

Bitcoin ended the week in the red after continuing to fail to hold above the $60,000 mark.
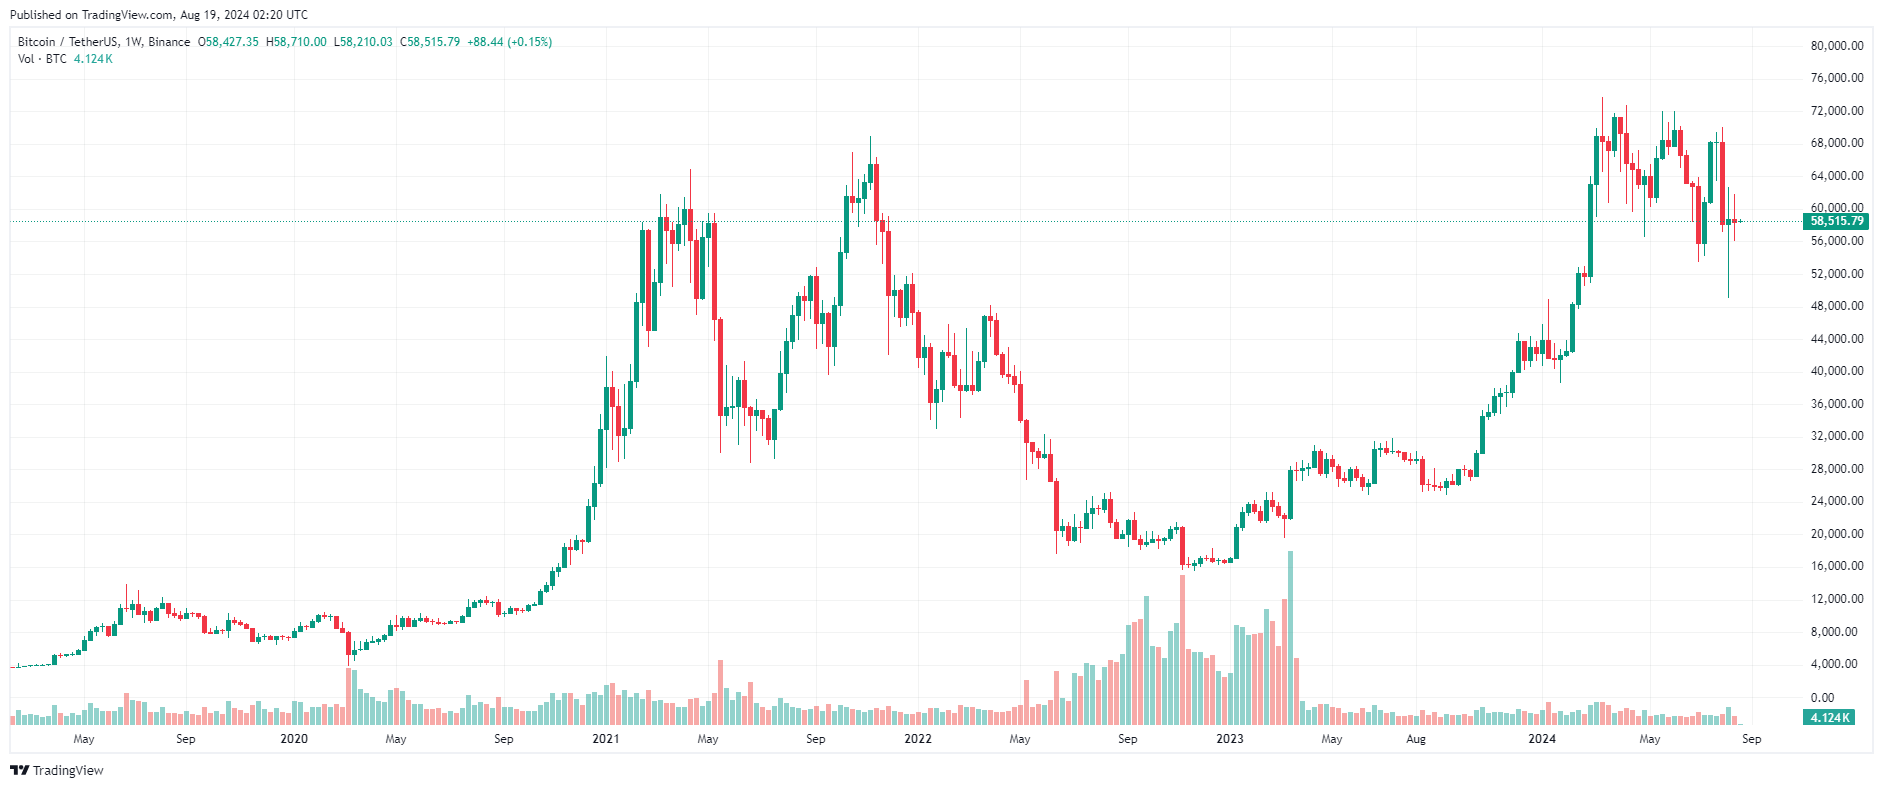
BTC Price Chart – 1 Week | Source: TradingView
Stock Futures Contract edged up in overnight trading Sunday after the S&P 500 posted its best week of 2024.
Futures Contract tied to the S&P 500 rose 0.1%, while Dow Jones futures edged up 30 points, or 0.1%, and Nasdaq-100 futures rose 0.2%.
Stocks had a strong week amid a volatile stock market. The S&P 500 rose 3.9% for the week, its best week since 2023. The Nasdaq Composite and Dow jumped 5.2% and 2.9%, respectively.
Last week’s rally comes after a choppy start to August. Earlier this month, disappointing data fueled recession fears and concerns that the Federal Reserve was dragging its feet on rate cuts. Those concerns led to a global sell-off that sent the S&P 500 to its worst day since 2022 on Aug. 5.
New data last week appeared to ease concerns and boost hopes that the economy could achieve a soft landing. The 12-month inflation rate, as measured by the consumer price index, fell to 2.9% in July, its lowest level in more than three years.
Wall Street is looking ahead to a speech by Fed Chairman Jerome Powell in Jackson Hole, Wyoming, on Friday, as investors look for more clues on the prospects for a rate cut. That won’t be the only Fed news this week, as the minutes from the Fed’s most recent meeting are due out on Wednesday. The Democratic National Convention also begins on Monday.
Earnings season kicks off on Monday with results from Palo Alto Networks and Estee Lauder.
After hitting $60,000 earlier in the day, Bitcoin reversed course and closed the week at $58,427, down nearly 0.5% on the weekly timeframe.
The bulls have been pushing the price towards the $60,000 mark, but it seems that all attempts to break above this psychological level have not been successful.
The top asset is currently trading around $58,570, down 1.5% in value over the past 24 hours.
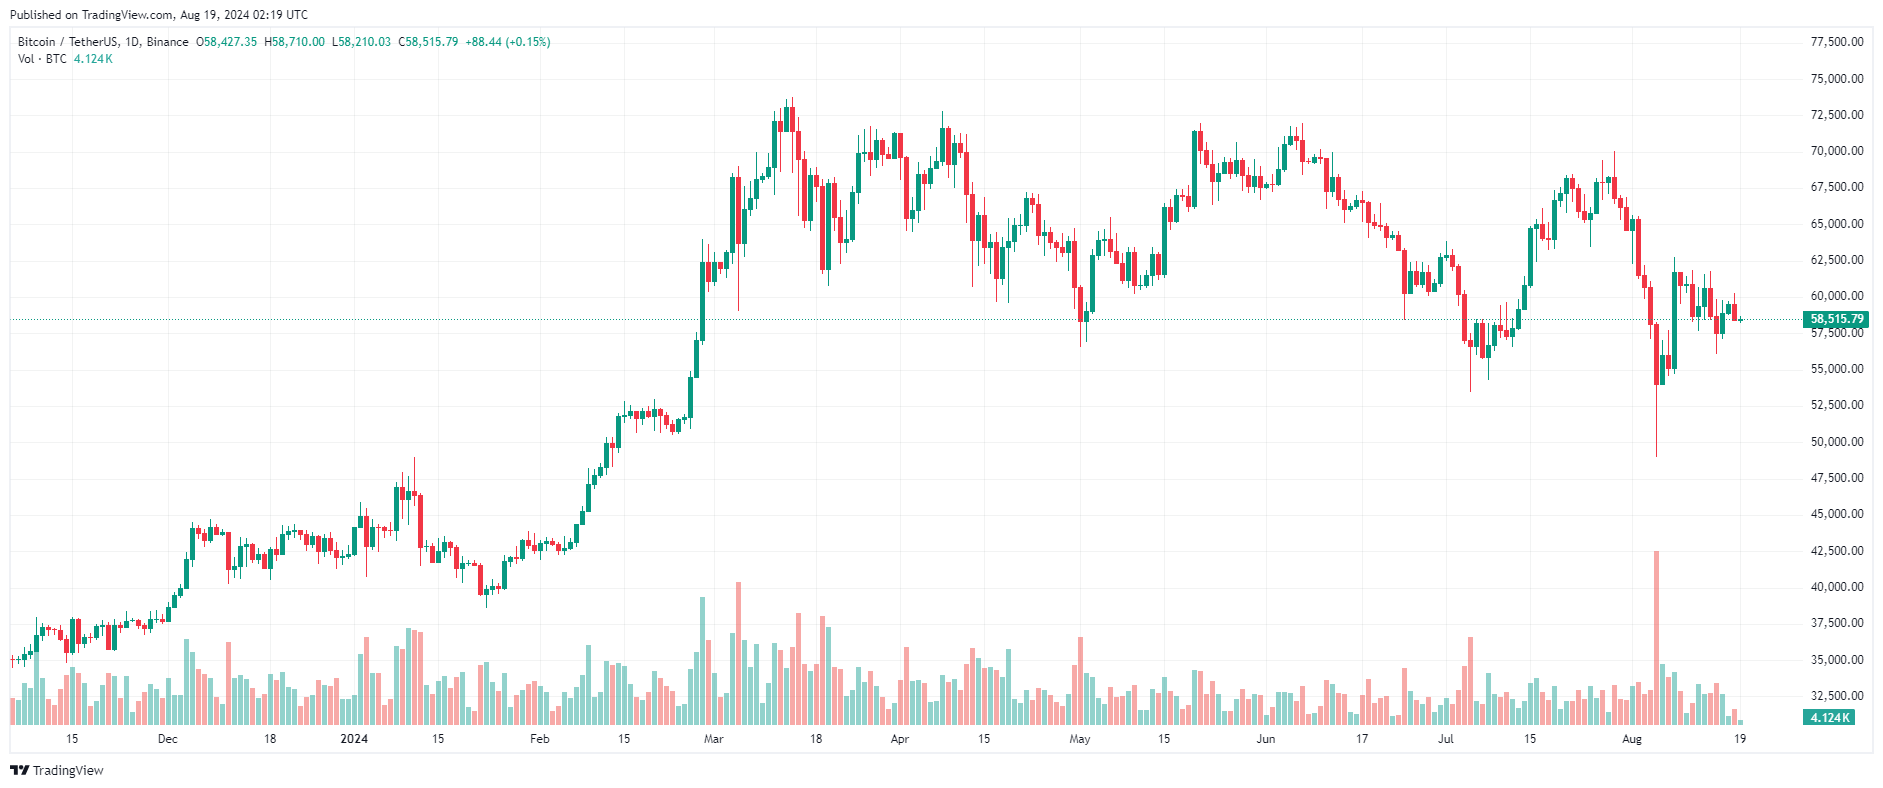
BTC Price Chart – 1 Day | Source: TradingView
Altcoin market was mixed yesterday.
On the upside, Toncoin (TON) and Notcoin (NOT) led the way, up 8% and 7% respectively.
Followed by Conflux (CFX), DYDX (DYDX), Gala (GALA), Bittensor (TAO), Polygon (Matic), SATS (1000SATS), Klaytn (KLAY), Ethereum Name Service (ENS), ORDI,… with an increase of 2-4%.
On the contrary, Mantra (OM), Celestia (TIA), THORChain (RUNE), Injective (INJ) , Dogwifhat (WIF), Stacks (STX), Cronos (CRO), Ondo (ONDO), Brett (BRETT), Uniswap (UNI)… decreased from 2-5%.
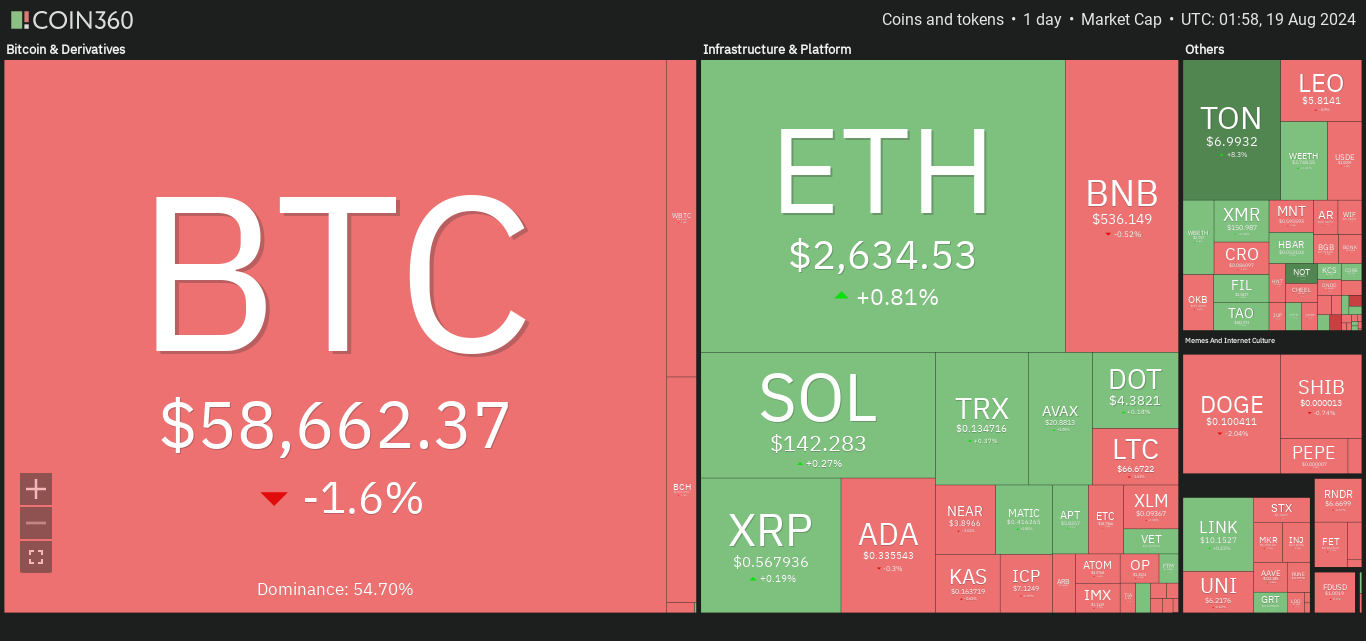
Source: Coin360
Ethereum (ETH) has been trading mostly sideways around $2,600 for the past four days.
The second-largest Capital by market cap managed to close the week in the green with a gain of more than 2%, and is currently trading at $2,630, up slightly by almost 1% in 24 hours.
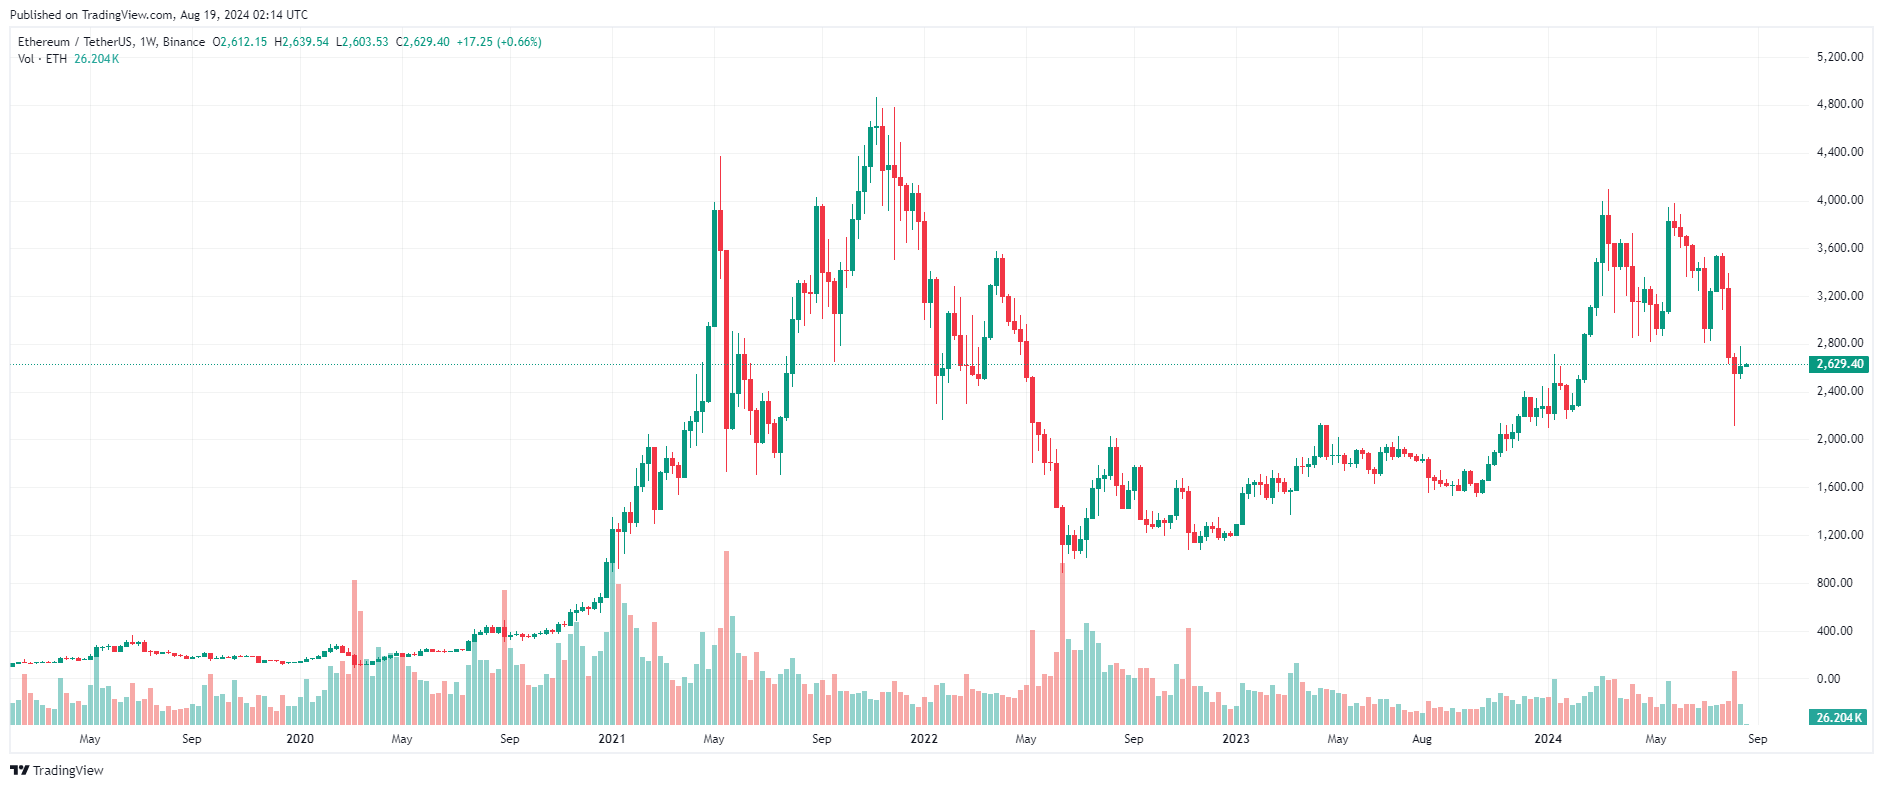
ETH Price Chart – 1 Week | Source: TradingView
You can XEM coin prices here.
The "Coin Price Today" section will be updated at 9:30 every day with general news about the market, we invite you to follow.
Join Telegram: https://t.me/tapchibitcoinvn
Follow Twitter (X): https://twitter.com/tapchibtc_io
Follow Tiktok: https://www.tiktok.com/@tapchibitcoin
Viet Cuong
Bitcoin Magazine


