

Bitcoin showed an upward trend over the weekend. At around 8 o'clock last night, Bitcoin once exceeded the US$60,000 mark and hit a maximum of US$60,288; however, it soon fluctuated and fell to US$58,500, giving back almost all of the weekend's gains.
With the Bitcoin halving market brewing and the U.S. presidential election approaching, the market's predictions about future trends have become more complicated, but most analysts still seem to maintain a bullish attitude.
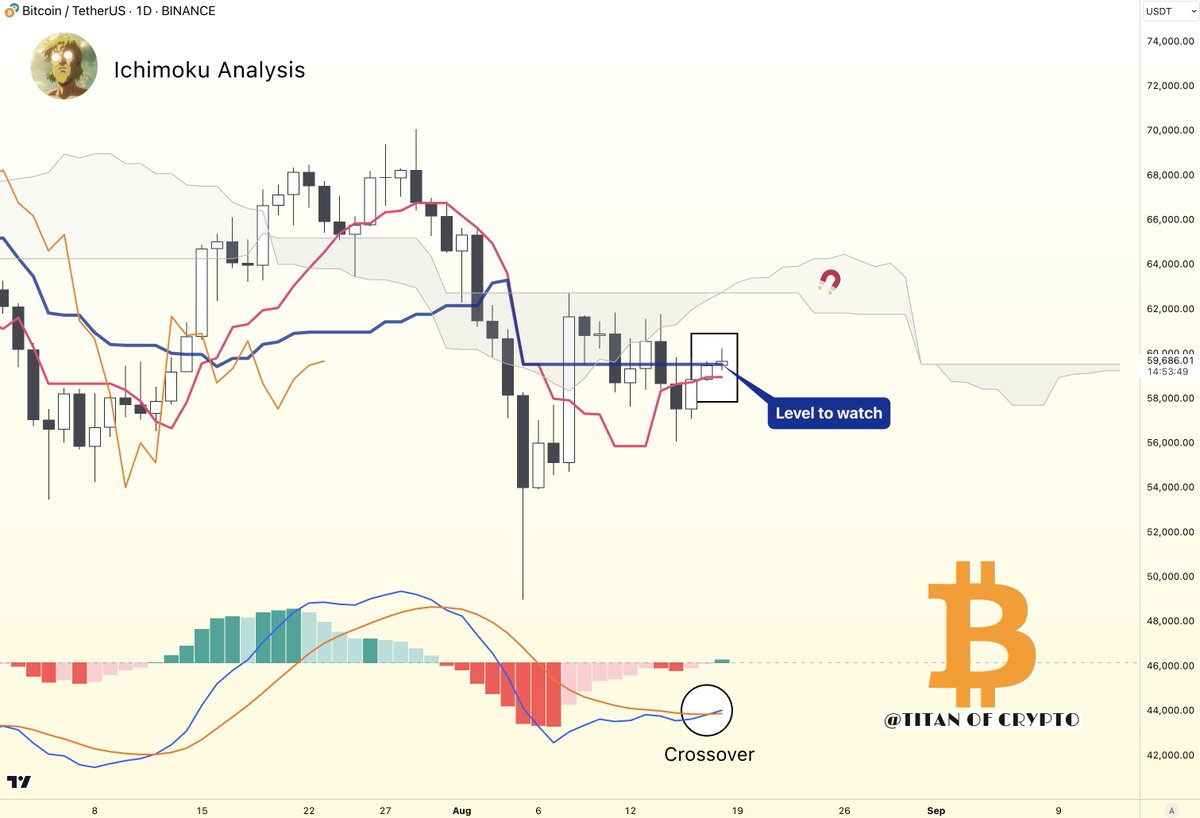
Analysis: Ichimoku Cloud shows bullish signal
After analyzing the "Ichimoku Cloud" on Bitcoin's daily chart, analyst Titan of Crypto pointed out a key bullish crossover that indicates that Bitcoin may usher in further gains. He said on X that Bitcoin price has just closed It is above the Tenkan line and is targeting cover of the Kijun line.
Titan of Crypto mentioned that this classic "TK cross" is a common technical signal for traders on the Mekongsha chart. It is usually regarded as an indicator that the market is about to break upward. With the emergence of this signal, the market generally expects Bitcoin will climb further.
It is understood that the Ichimoku Kinko Hyo (Ichimoku Kinko Hyo) was invented by Japanese journalist Goichi Hosoda in 1930. Hosoda used the pen name Ichimoku Santo and published it in 1975. It is a technical analysis indicator that emphasizes the impact of time on prices. This indicator believes that prices have cyclical changes, reflecting the market's psychological expectations. For example, if it rises for a long time, it will fall, and if it falls for a long time, it will rise. In addition to technical analysis, the Ichimoku Balance Sheet also contains philosophical reflections on the market and society.
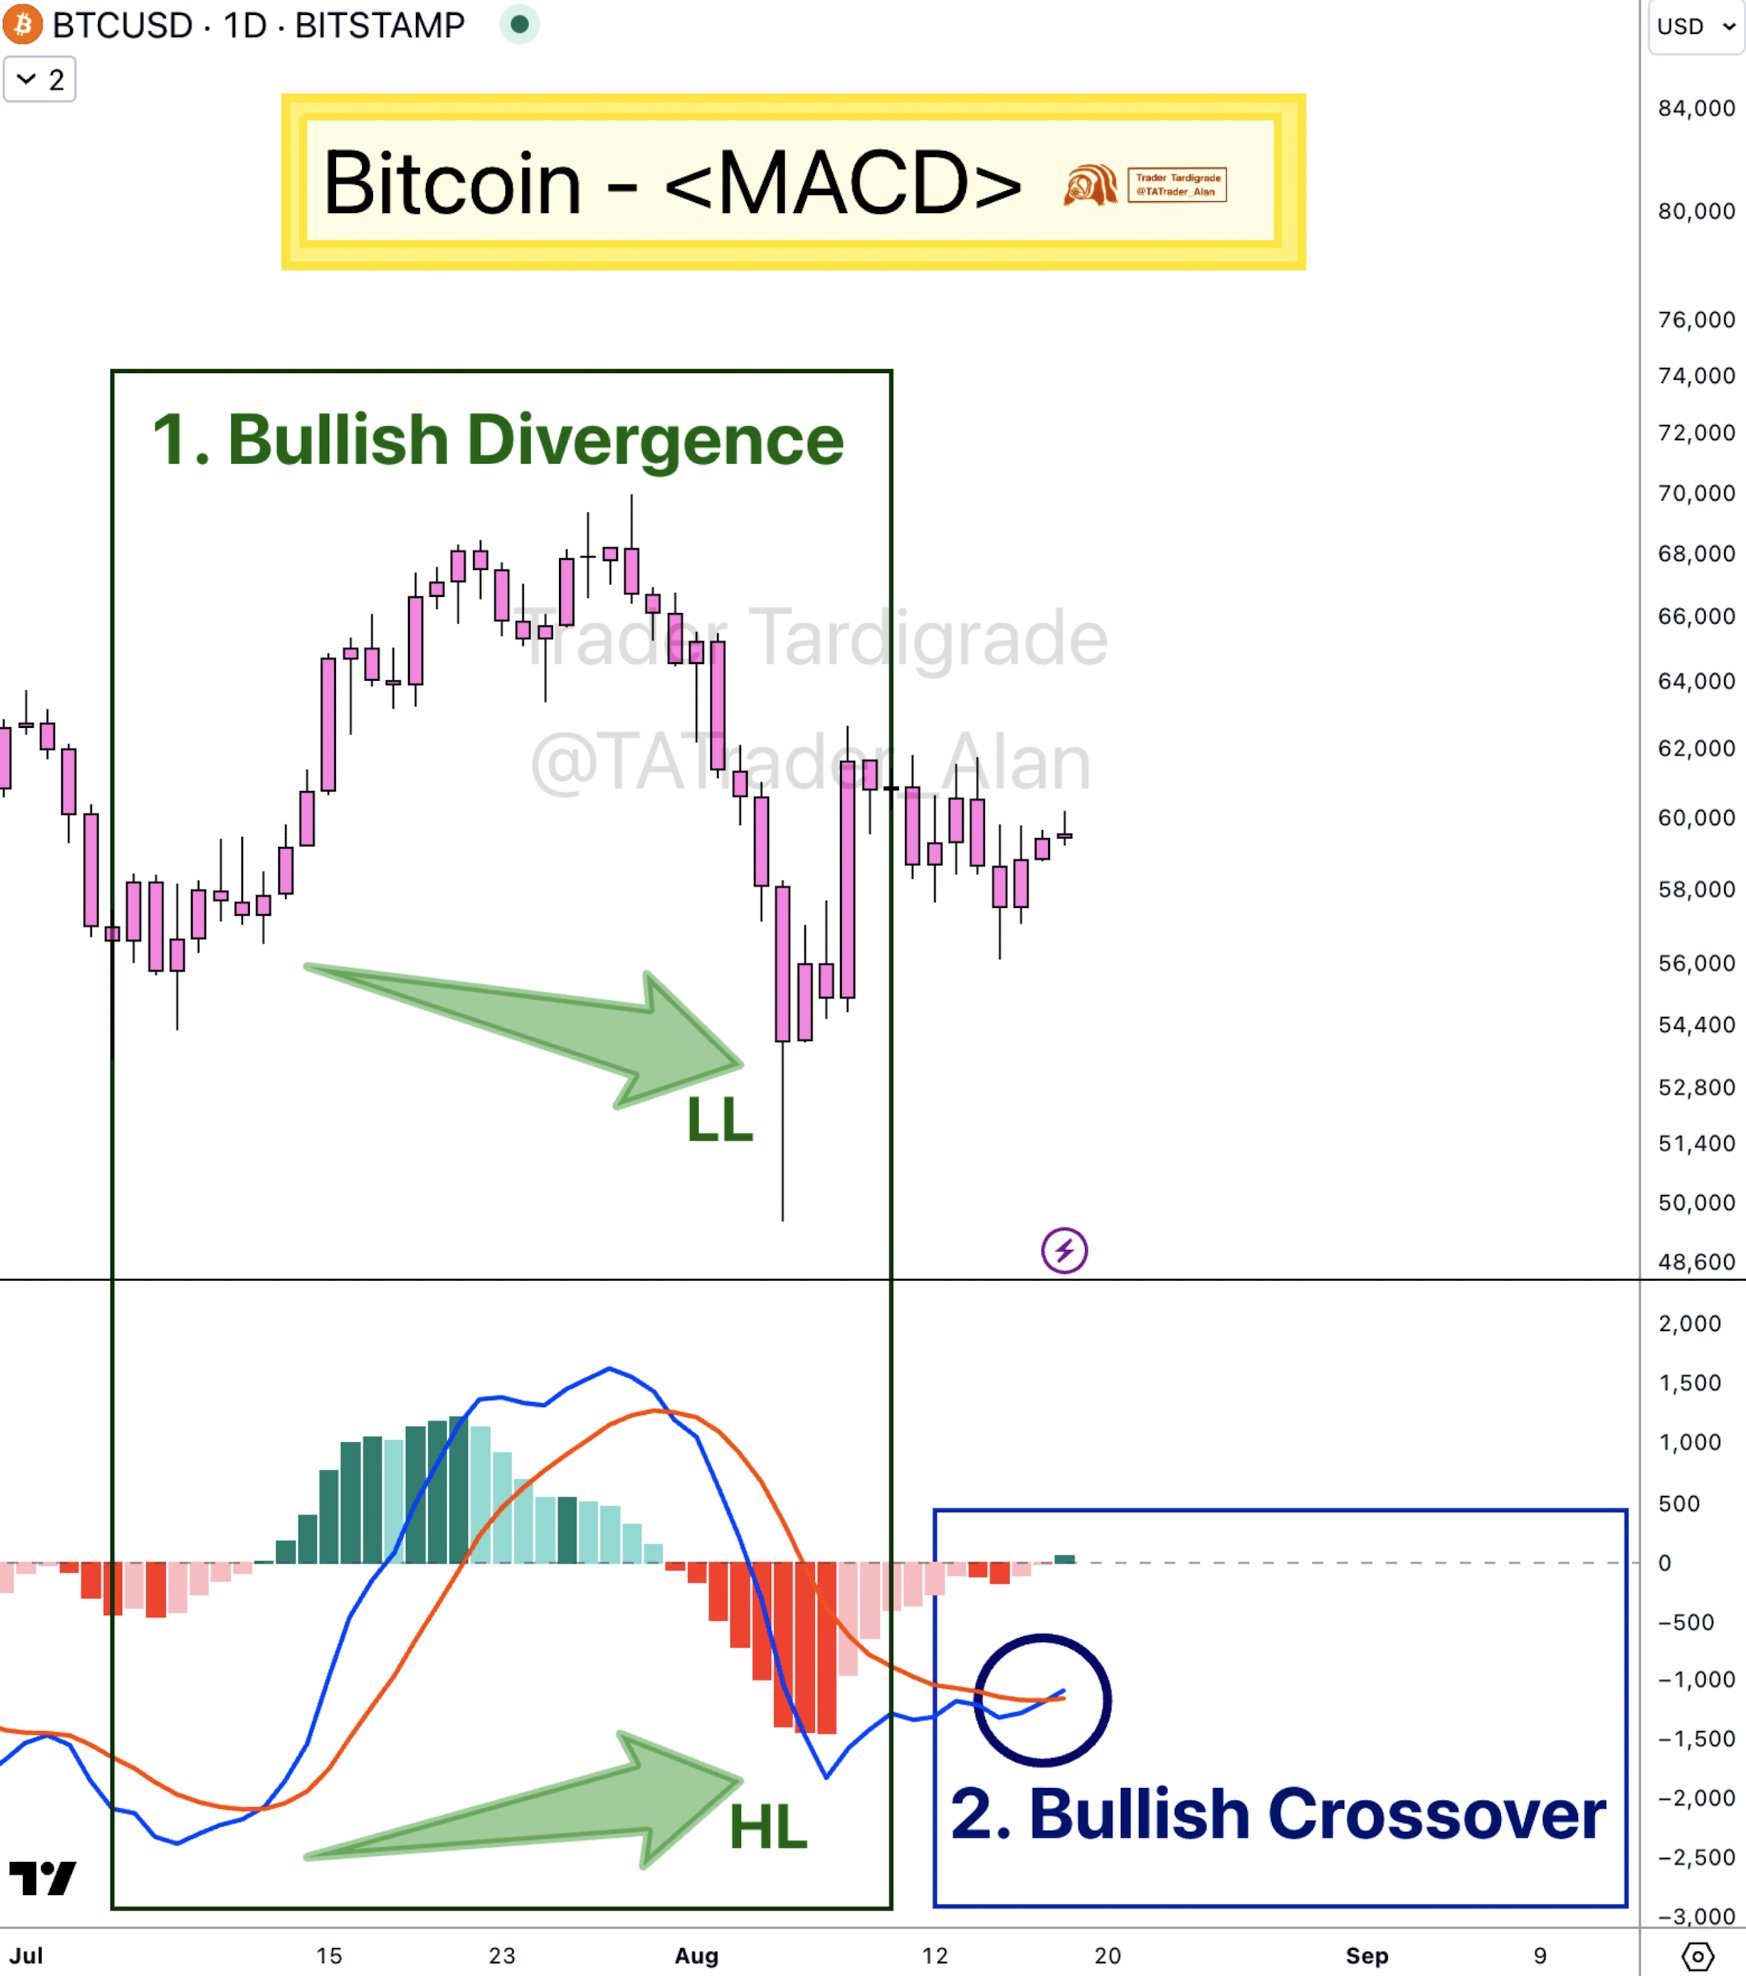
MACD: Bitcoin has a high chance of rising sharply
In addition to the TK cross signal on Ichimoku Cloud mentioned by Titan of Crypto, another analyst Alan Tardigrade further emphasized Bitcoin’s upside potential in the X platform through the MACD indicator, which measures the relationship between two moving averages. The interaction between them helps traders determine potential buying and selling opportunities.
Alan Tardigrade said that based on the bullish signal from the MACD indicator, "the odds are very high that $BTC will rise sharply again."
Halving market fermentation: Bitcoin price will enter a "surge period"
When will the Bitcoin halving market ferment? Rekt Capital said that Bitcoin is currently about 125 days away from the halving in mid-April this year. According to past cycles, Bitcoin usually enters the so-called "parabolic phase" about 160 days after the halving, that is, the price surges rapidly. period.

In July, Rekt Capital emphasized that if history repeats itself, Bitcoin may be just over a month away from a new breakthrough. It is speculated that the time point will be at the end of September, suggesting that the market may usher in a breakthrough near the halving period. This view has further enhanced the market’s optimistic expectations for the future trend of Bitcoin.


