

Last week’s data highlighted the shift in market focus from inflation to the labor market and consumer health. BTC/USD remains range-bound, but now that BTC has recovered from a small dip below the key $60,000 mark, the technical outlook for ETH/USD remains bleak after breaking key support levels.
Macroeconomic Background
On the surface, the most influential economic release was Wednesday's U.S. Consumer Price Index (CPI) report, which provided an early update on how price pressures in the world's largest economy changed in July. The report, which came in roughly in line with expectations at 2.9% year-over-year (3.2% core), was met with a relatively muted reaction as traders have moved away from viewing inflation as the biggest risk to the economy and Fed policy.
The market is now more focused on the labor market and consumer health. As a result, the better-than-expected retail sales report eased concerns about an impending economic slowdown and significantly reduced the Fed's projected rate cuts this year to less than 100 basis points.
The FOMC meeting minutes to be released by the Fed are expected to be moderate in tone and reinforce market expectations for a rate cut in September. Currently, the interest rate market has digested the possibility of a 1 basis point rate cut by the Fed in September and expects a cumulative rate cut of 94 basis points by the end of the year. Pay attention to the guidance on rate cuts in the meeting minutes. Fed Chairman Powell gave a speech on the economic outlook at the Jackson Hole Global Central Bank Annual Meeting, which will have a further impact on market trends.
In addition, the S&P Global PMI data for August will be released on Thursday night. If the data is weak, market concerns about the United States falling into a recession may intensify and lead traders to bet on the Federal Reserve to cut interest rates this year.
Sentiment and Fund Flows
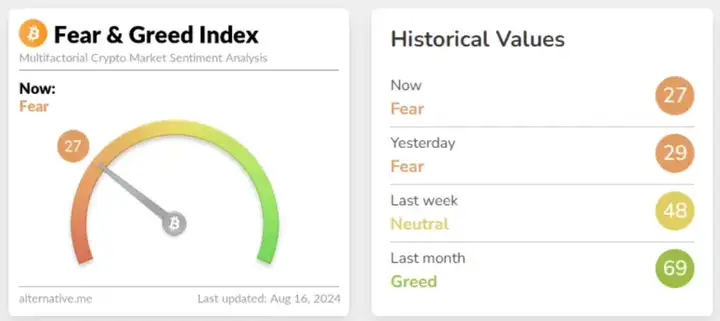
The market’s sentiment indicator (Crypto Fear and Greed Index), fell to 27 last week. Overall, it is close to the 1-year low set earlier this month and could form a contrarian bullish signal if there are any positive developments in the coming weeks:
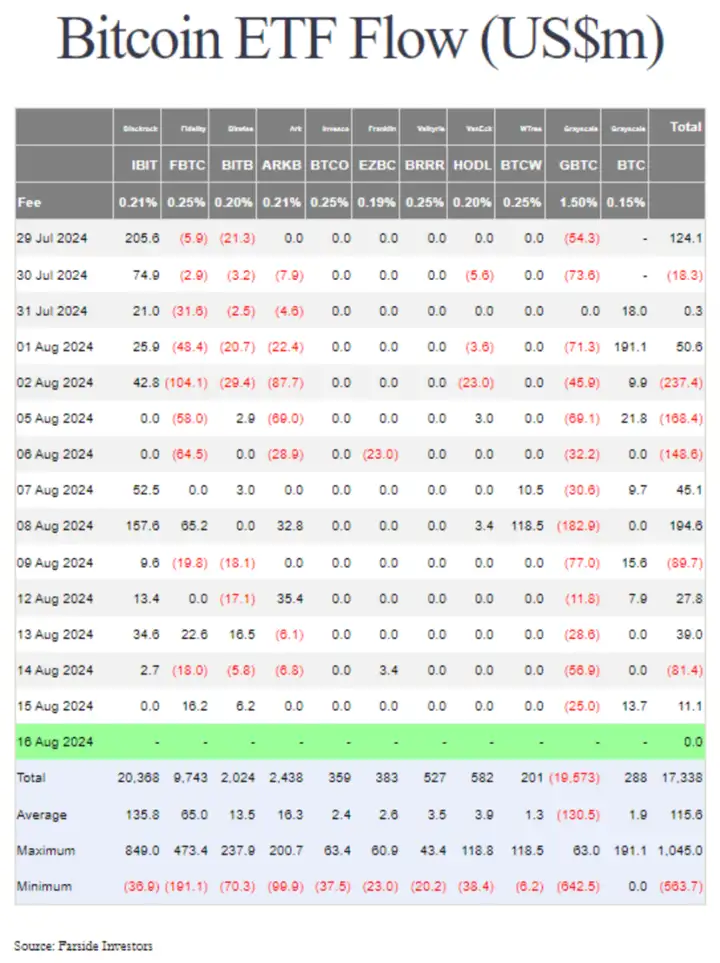
Another way to gauge sentiment is to look at flows into crypto asset investment vehicles on exchanges, which remained tepid last week. At the time of writing, with some time until Friday’s data is released, Bitcoin exchange traded funds (ETFs) have seen slight outflows over the past four days, at -$3.5 million. In the long term, inflows from “traditional finance” investors provide incremental demand for Bitcoin and help support prices.
Bitcoin Technical Analysis
BTC USD Analysis
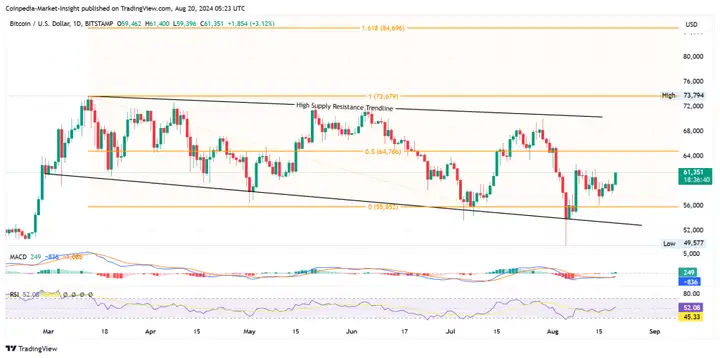
Despite the impressive recovery in other risk assets such as U.S. stock indices and gold, Bitcoin struggled to get going last week. However, in the past 24 hours, the price of Bitcoin has risen by 4.64%, with an intraday gain of 2.84%. In the past two trading days, Bitcoin has risen by 4.70%, breaking through the $61,000 resistance level. Currently, Bitcoin is trading at $60,866, promising a bullish recovery.
From a broader perspective, BTC price action is showing a bullish cycle, gaining momentum within a descending channel that has also formed a bullish flag pattern given the current uptrend.
Bitcoin has formed a bottom reversal in the short term, with the neckline at $61,625. A break above this level could further extend the BTC price rally.
The MACD indicator shows a bullish crossover between the MACD and signal lines, and the positive histogram has reappeared. The daily RSI line is also trending up, crossing the 50% mark. These momentum indicators are positive, reinforcing the bullish sentiment.
These cryptocurrencies have been trading in a wide range since March. Currently, they look neutral in the short term, but in the long term, gains are likely ahead.
Ethereum Technical Analysis
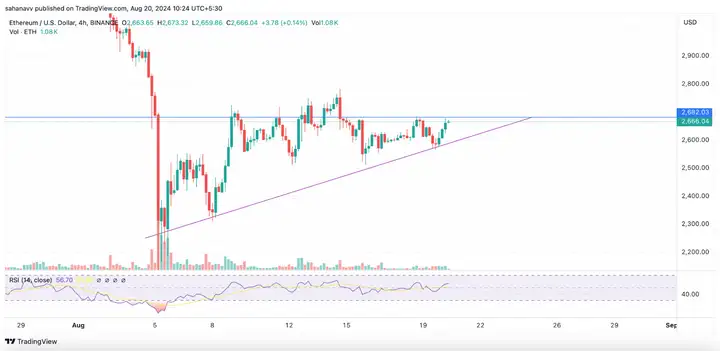
Like Bitcoin, Ethereum had a relatively weak week last week. But as the market picks up, ETH price is maintaining a strong uptrend today; however, bears have managed to take control above the $2,600 level. As a result, bulls fell shortly after breaking through these levels, causing the coin to face rejection from the lower upside support levels.
Meanwhile, the technical outlook for the second-largest crypto asset is decidedly less bullish. The RSI shows gains, but increasing selling pressure could hamper the recovery’s progress. ETH/USD is trading well below its 200-day moving average and previous support-turned-resistance at $2,875, currently maintaining a short-term downside bias.
Therefore, ETH price might remain sideways below the resistance and culminate above $2,800.


