
With just four days left to go before the end of this worryingly volatile month, the cryptocurrency market, led by Bitcoin (BTC), has signaled that bearish sentiment may be in the near term. The recent bullish outlook sparked by the Federal Reserve’s announcement of monetary policy changes before the end of the year is fading.
After Bitcoin fell below $64,000 yesterday (26), it continued to fluctuate and fall today (27), falling below $63,000, dragging down the overall cryptocurrency market. However, with the continuous influx of liquidity and the change in market sentiment, Bitcoin is expected to resume its upward trend and move towards $70,000. As of writing, the trading price of Bitcoin is $62,905, up 3.27% in the past 7 days.
More information Crypto Tuanzi
Liquidity surge
The Bitcoin market has received a large amount of liquidity in the past few weeks, with total inflows reaching US$61.9 billion, exceeding the previous peak in July and setting a new high this year.
This surge in liquidity is partly attributed to an increase in stablecoin minting. According to data from Glassnode, the total supply of the top five stablecoins - Tether (USDT), USD Coin (USDC), Binance USD (BUSD), Dai (DAI) and TrueUSD (TUSD) - has increased by 3% over the past month.
Rising stablecoin minting is often seen as a bullish sign as it indicates growing demand for cryptocurrencies. This is still strong despite the report showing a decrease in minting over the past seven days from $2.7 billion to $1 billion.
In addition, the leverage ratio of Bitcoin perpetual contracts in the derivatives market has also increased, which further enhances the recent upward momentum of Bitcoin. This leverage effect and continued liquidity inflow may push the price of Bitcoin to $70,000.
Fear and Greed Index now points to Greed
The current Fear and Greed Index reading is 55, which means that investors are currently in a greedy mood. This greedy mentality is a new change in the market compared to recent trends.
The chart below shows how the value of the index has changed over the past year. The Bitcoin Fear and Greed Index had a relatively low value last week. It has gone deep into the fear zone, very close to a special area called extreme fear.
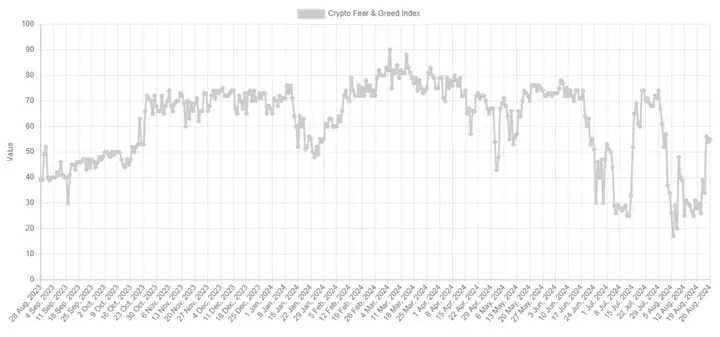
When the index reaches 25 or lower, people panic. The indicator has hit this area several times in the past month, with the most notable example probably being the low on August 5th that coincided with the price bottom.
Historically, Bitcoin has seen many instances of this pattern, with falls into extreme fear zones causing the cryptocurrency’s price to bottom out.
Therefore, Bitcoin seems to have a tendency to move in the opposite direction of popular expectations. It makes sense that extreme sentiment represents the times when such expectations are strongest, so reversals are also most likely to occur during these times.
With the recent shift in sentiment from fear to greed, investors are bullish again. As the current hype is not intense, Bitcoin should not be negatively impacted. The index will be worth watching in the coming days as any spike in extreme greed could be a warning that the asset price is overheated.
Weak dollar
The overall economic situation changed significantly in early July this year, which could boost the price of Bitcoin. The report said that the US dollar peaked in early July, while the 10-year Treasury yield also fell.
Oil prices, an indicator of economic strength, have also fallen 10% after peaking in early July. The ISM manufacturing index has been below 50 for the third straight month, suggesting the U.S. economy may be slowing.
However, combining these overall economic trends with Bitcoin's historical performance reveals that a weaker dollar and lower bond yields are generally bullish for Bitcoin.
Federal Reserve Chairman Powell's speech, coupled with the weak ISM manufacturing index and the decline of the US dollar, created conditions for increased market liquidity, which may encourage risky assets such as stocks and Bitcoin.
If the overall economic trend continues to be positive and Bitcoin maintains its upward trend, the next price target is $64,000. If this level holds and the rally continues, Bitcoin could retake the critical support level of $68,000 before moving up to $70,000.
Investors are hesitant
In addition, although optimism in the Bitcoin market has increased after the Fed sent a strong signal of a rate cut last week, there is still some hesitation in the derivatives market.
There has been active buying of call options in the market, but it is mainly concentrated in forward options with longer exercise times.
Meanwhile, a large number of call options were observed to be sold, especially at the $100,000 strike price expiring in March 2025, which may mean that the market is bullish, but no significant price increase is expected in the near term. Bitcoin may continue to fluctuate in the $62,000 to $64,000 range in the short term.
Bitcoin price correction
Bitcoin price attempted to break out of the $65,000 resistance area to rise further. However, the bears were active and protected further gains. The price formed a high at $64,950 and it is currently correcting gains.
There was a break below the $64,000 level. The price traded below the 23.6% Fibonacci retracement level of the upward wave from the $58,572 swing low to $64,950 high. Moreover, there was a break below a key bullish trend line with support at $63,400 on the hourly chart of the BTC/USD pair.
Bitcoin is currently trading below $63,500 and the 100 hourly simple moving average. The current price action suggests that the price could slide further towards the $61,750 support area. It is close to the 50% Fibonacci retracement level of the upward wave from the $58,572 swing low to $64,950 high.
On the upside, the price is likely to face resistance near $63,500. The first key resistance is near $64,000. A clear break above the $64,000 resistance level could drive the price further up in the coming sessions. The next key resistance could be $65,000.
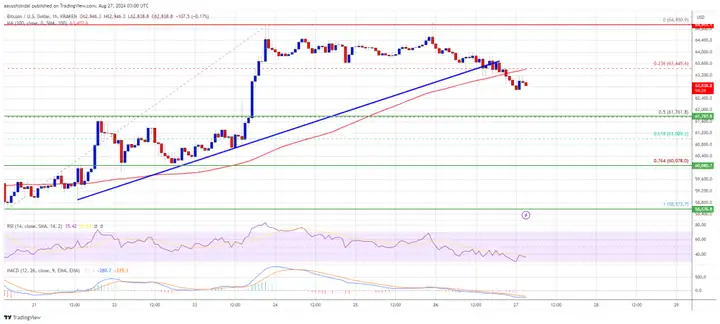
Source: BTCUSD on TradingView.com
A close above the $65,000 resistance could spark more gains. In such a case, the price could rise and test the $66,500 resistance.
In simple terms
The increase in the amount of stablecoins minted has greatly increased the liquidity of the Bitcoin market, and the leverage ratio of the market perpetual contracts has increased, further enhancing the recent upward momentum of Bitcoin. This leverage effect and continued liquidity inflow may push the price of Bitcoin to $70,000. The recent fear and greed index is biased towards greed, indicating a shift in market sentiment. At the same time, the US dollar is weak, and the price of BTC has also entered a state of correction.
In summary, with the increase in liquidity and the positive shift in market sentiment, the BTC price will be pushed to test the resistance level of $64,000. Currently, the price of Bitcoin is correcting its gains. In the short term, the price is expected to fluctuate between $62,000 and $64,000, with limited upside potential.
In the long term, as the correction continues, it may retest $61,750 and then target the $64,000 resistance level. This retest will allow the market to lay a more solid foundation for a continued upward trend, and with the end of the correction and the entry of bulls, I believe BTC will start a new round of rise, thereby retesting and breaking through the $64,000 resistance level.


