

The price of TON Coin (TON) has increased slightly by 2% over the past 24 hours. Despite the uptrend, the cryptocurrency continues to experience pressure that could threaten the expected price recovery.
Currently trading at $4.72, TON is looking to retest $5. This on-chain analysis suggests that market participants interacting with Telegram-based coins could be hindering this uptrend.
Toncoin hits a roadblock
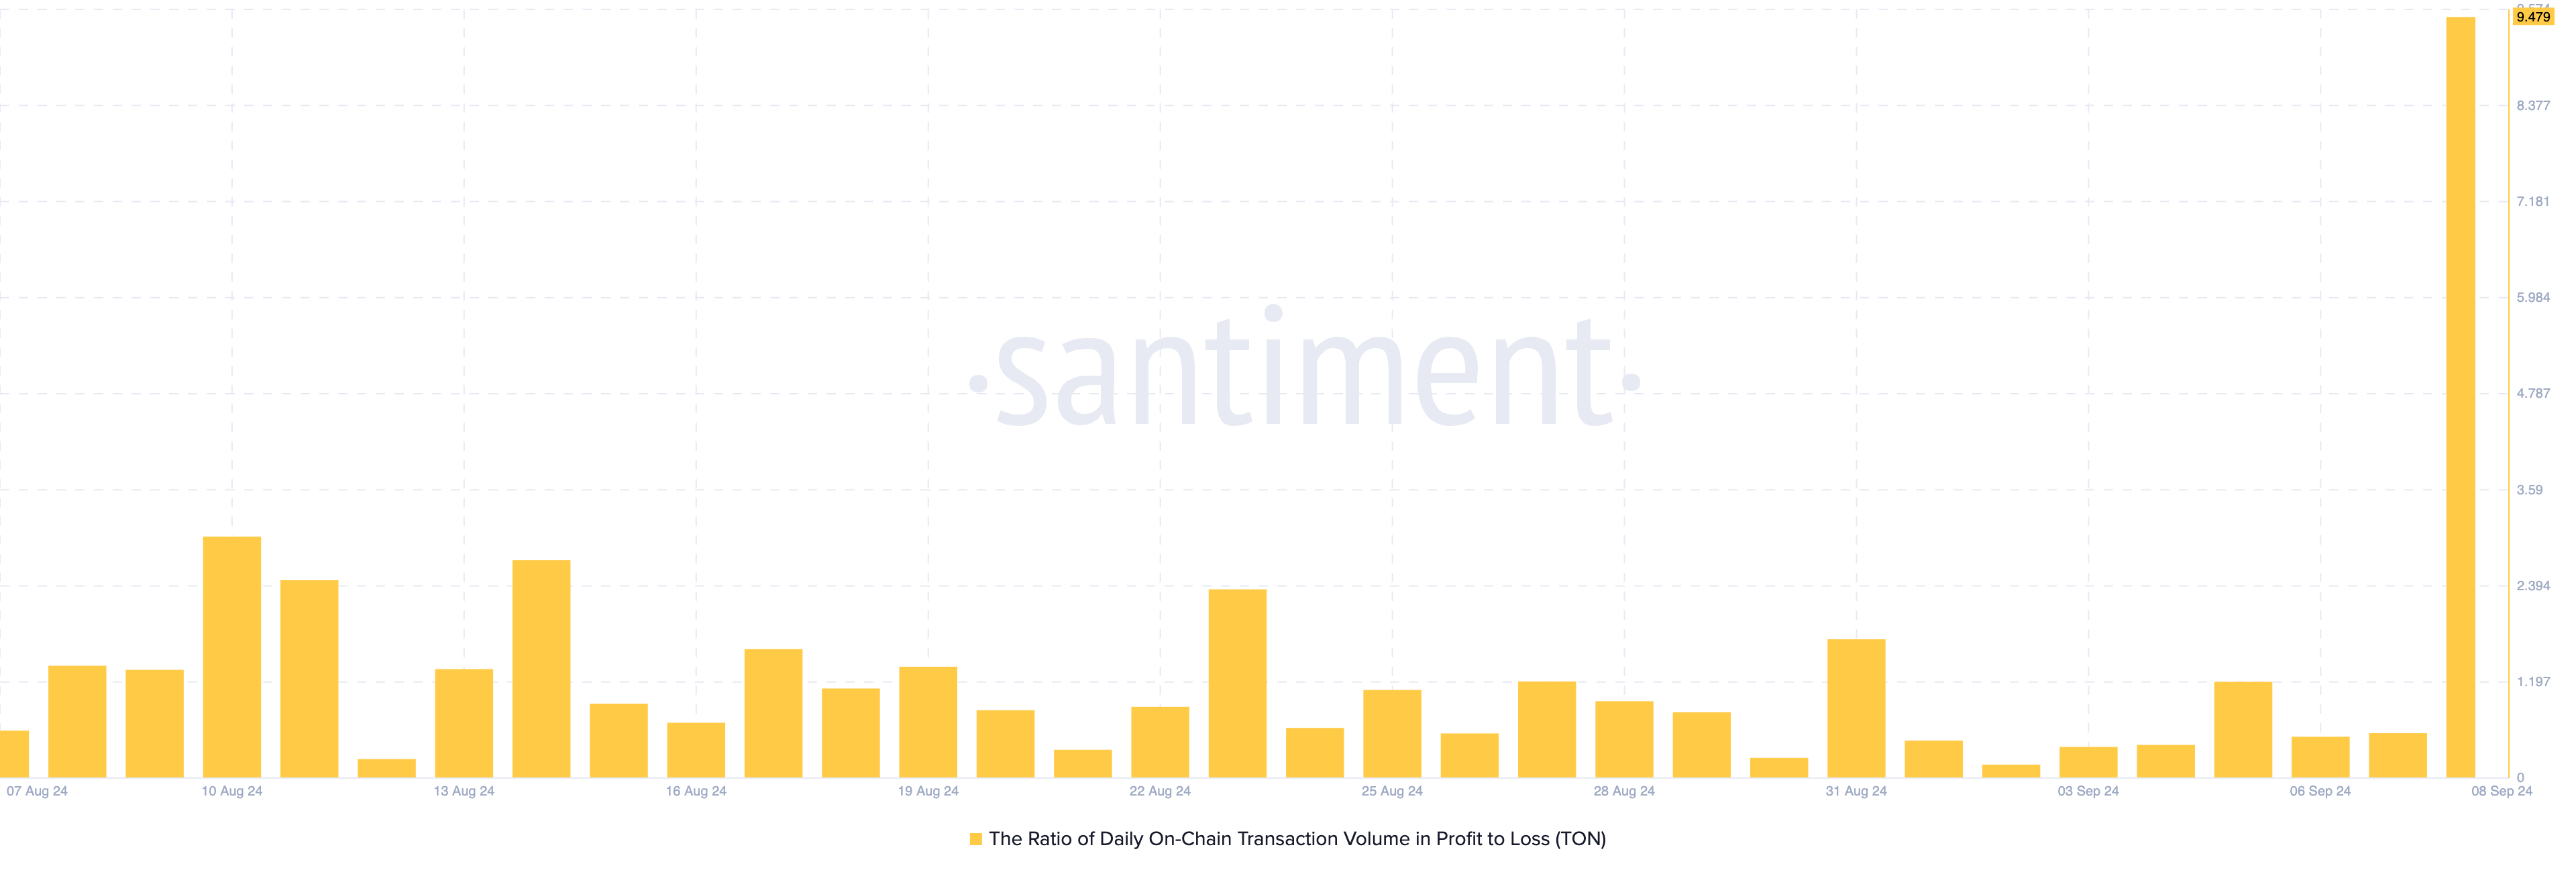
According to data from Santiment, the daily on-chain volume profit-to-loss ratio has reached its highest level since February. This metric tracks the total amount of tokens that have moved in profit or loss.
When this indicator surges, there is a lot of profit taking. On the other hand, a decline indicates that market participants are waiting and deciding to HODL.
This sudden surge in the price of TONCOIN increases the risk of further downside, especially since the token has been in a sustained uptrend recently.
Read more: 6 Best TON Coin (TON) Wallets in 2024
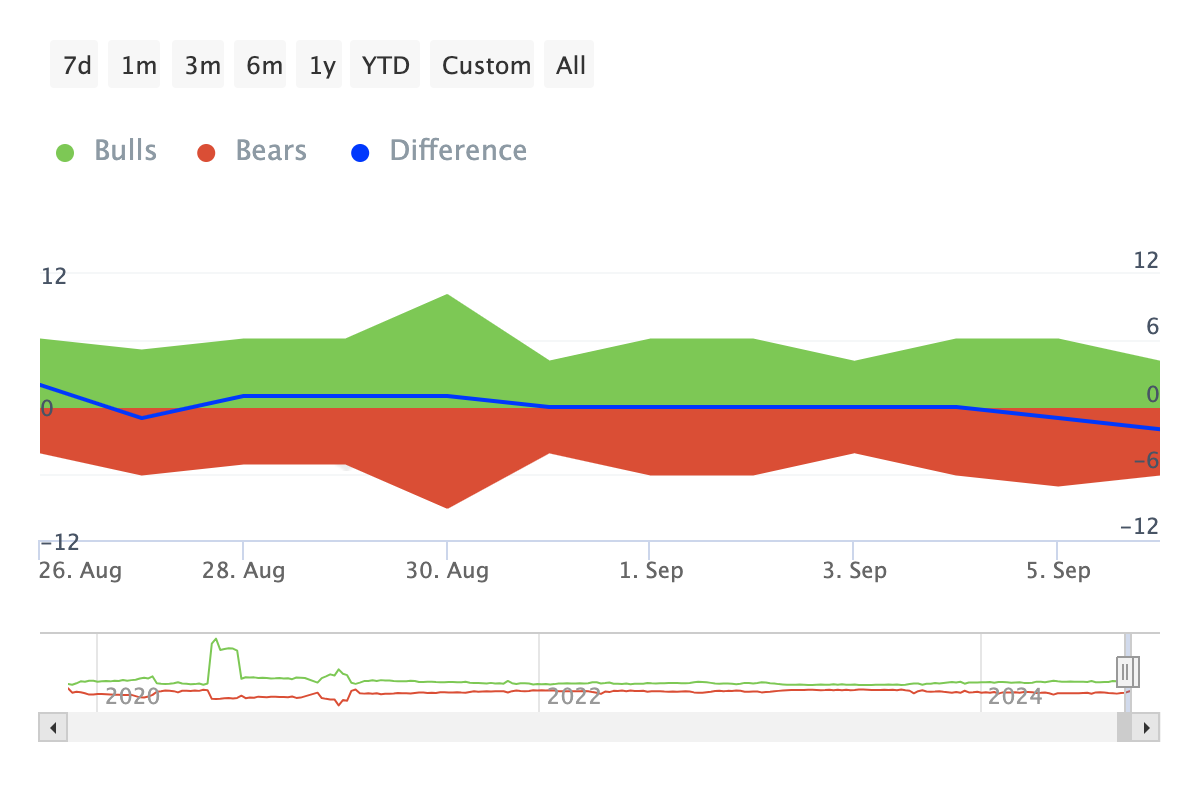
Adding to this view is the Bull and Bear indicator, which tracks whether addresses that trade around 1% of the total volume are buying or selling. Bulls are addresses that have bought more than 1% of the volume, while bears are addresses that have sold a similar amount.
A large number of bulls can indicate a possible price increase, while a large number of bears can accelerate the price decline. In the case of TON, the fact that bears have outnumbered bulls over the past 24 hours suggests that the recent uptrend may be coming to an end.
TON Price Prediction: It's Not $5 Yet
The price of TON Coin has recently bounced from $4.61. It is currently trading at $4.90 and is attempting to break above $5. However, the Stochastic Relative Strength Index (RSI) indicates that this attempt may not be successful.
Stochastic RSI compares the size of recent gains and losses. This data allows the indicator to determine whether momentum is bullish or bearish, and whether the asset is overbought or not.
As you can see in the image below, the Stochastic RSI on the daily TON price chart remains below the neutral line. If this continues, the price of TON may offset some or all of its recent gains. If this is confirmed, the price of TON may fall to the support level of $4.69.
Read more: 10 Best Altcoin Exchanges in 2024
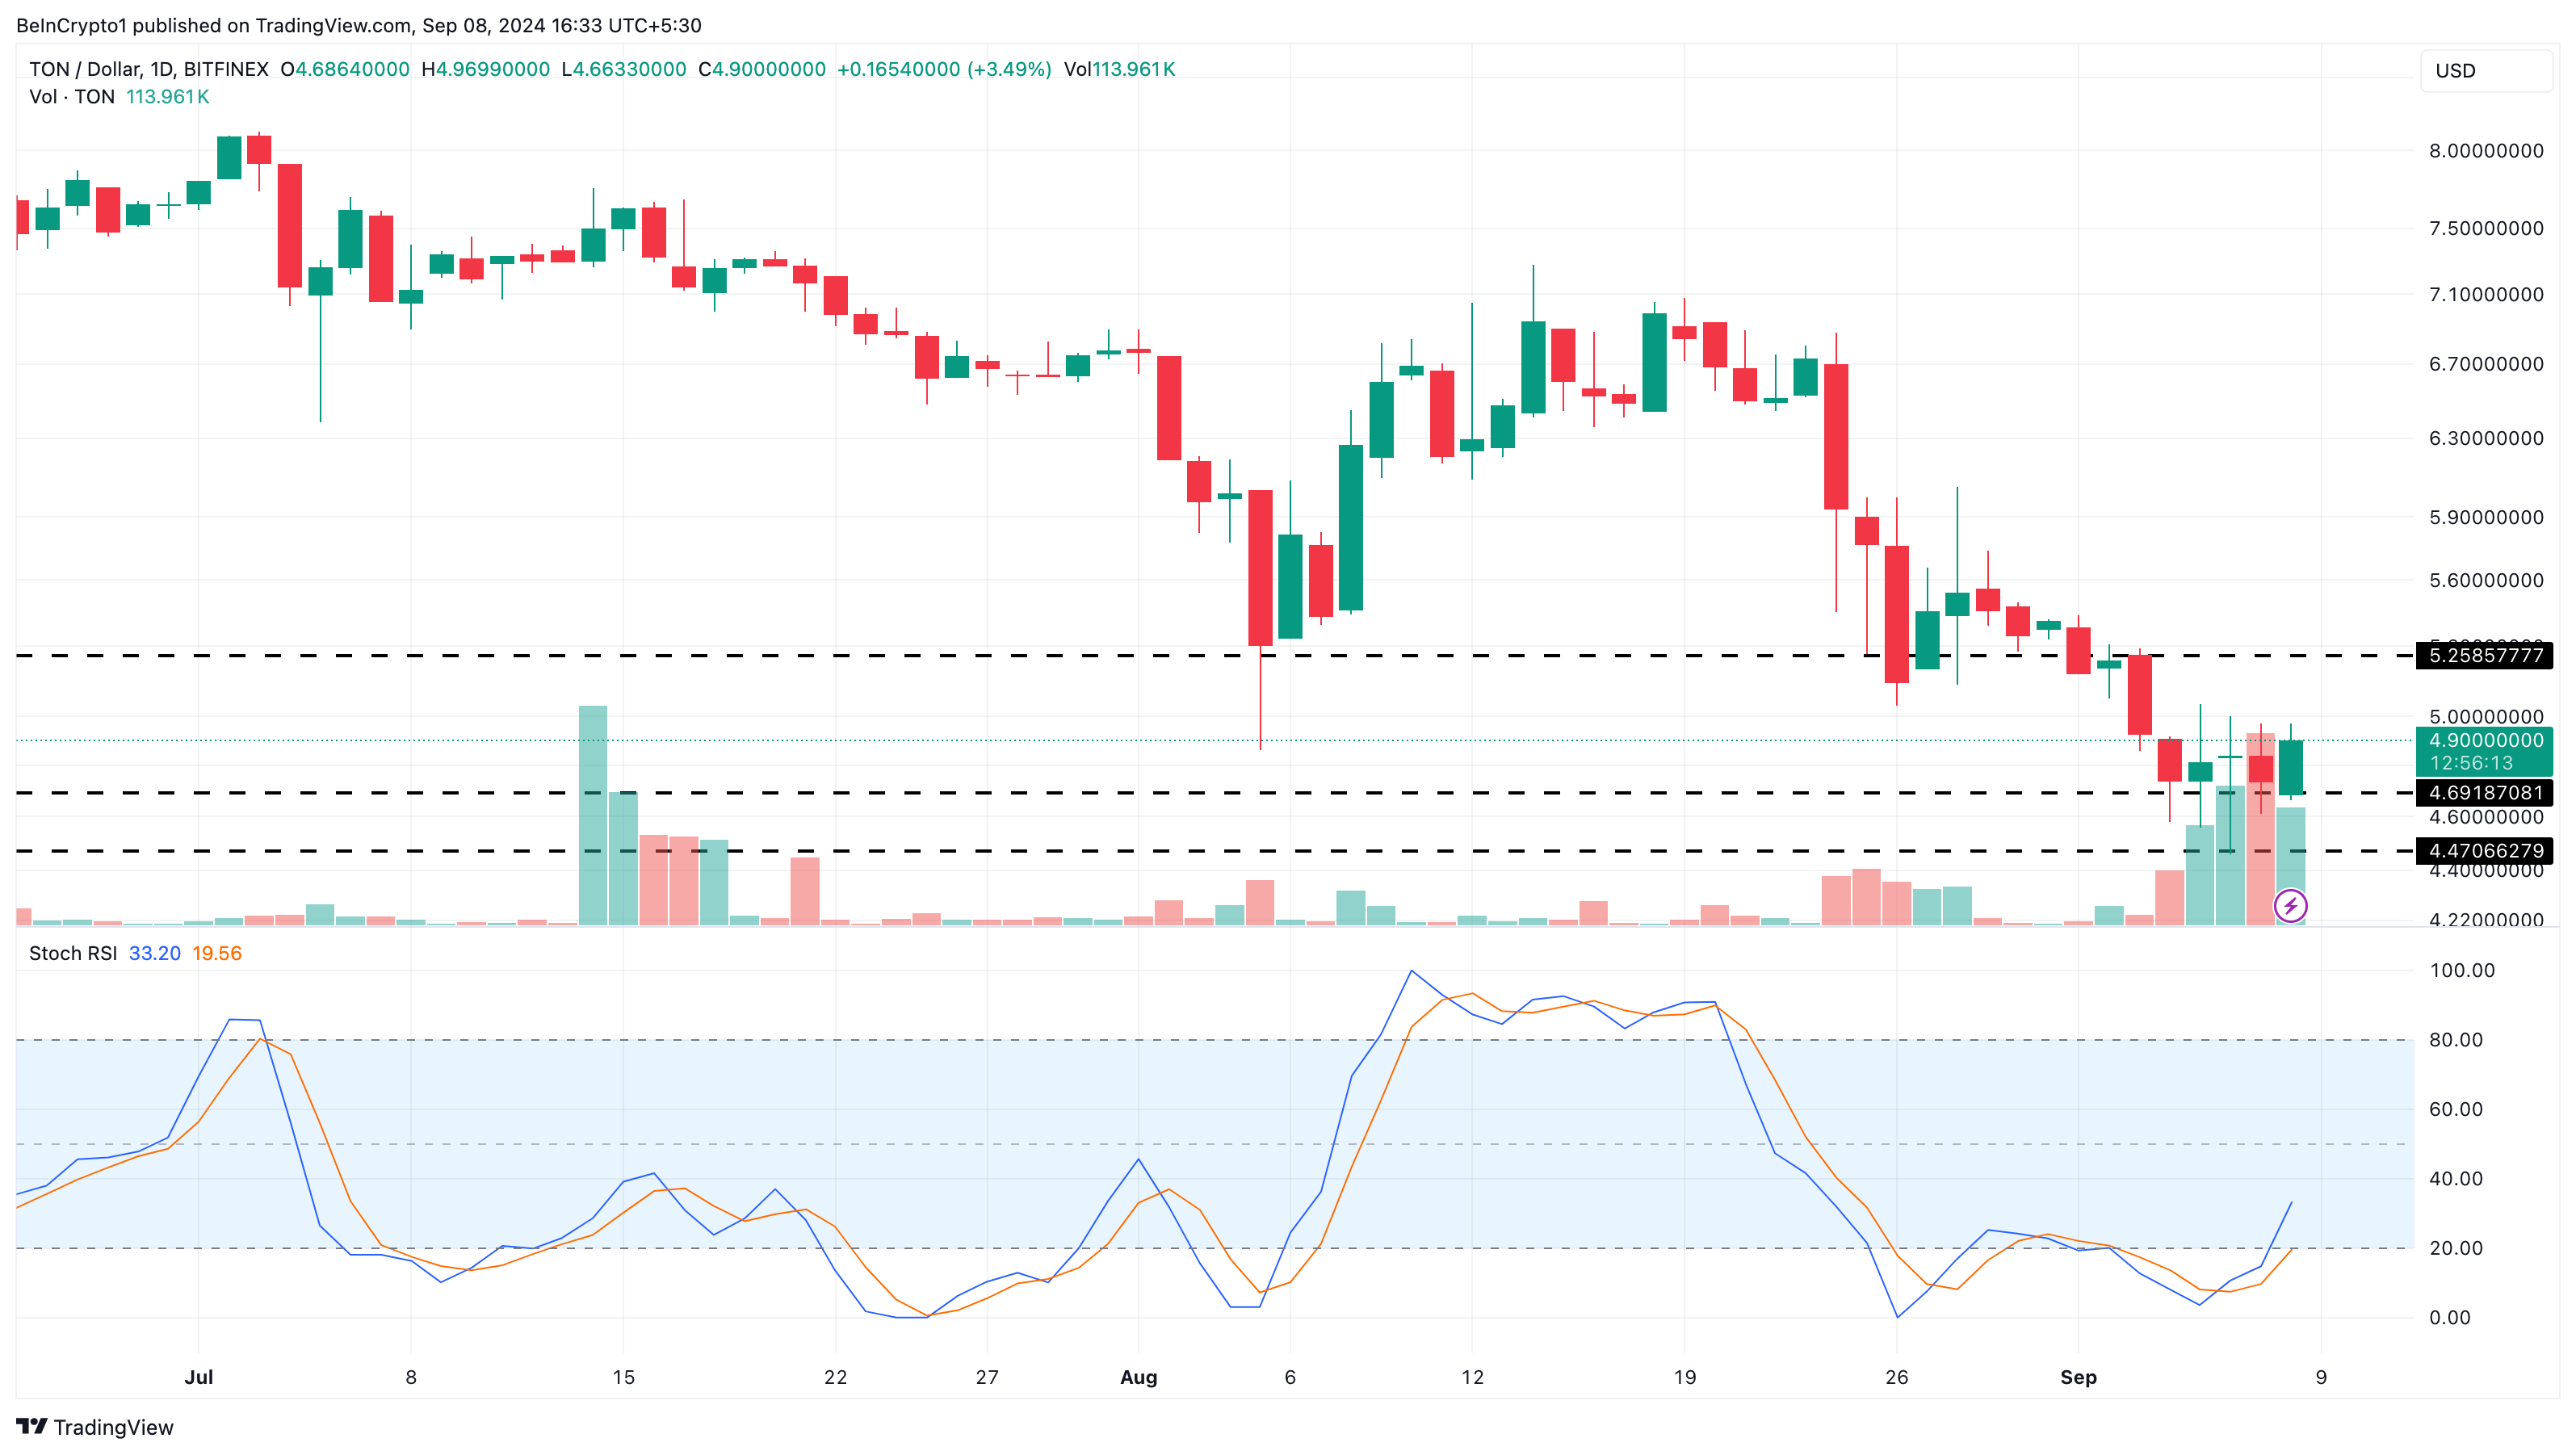
If this support is lost, the price could fall to $4.47. However, if the price of TON can avoid this downtrend , then as realized profits decrease, TON can slowly rise to $5.25.


