
The core price (CORE) on the daily chart is in a critical technical pattern. It is trading below key EMAs and with low buying volume, a breakout has not yet been confirmed.
In the bearish trend, the $1 level acts as a key resistance zone that the bulls need to cross to gain positive momentum.
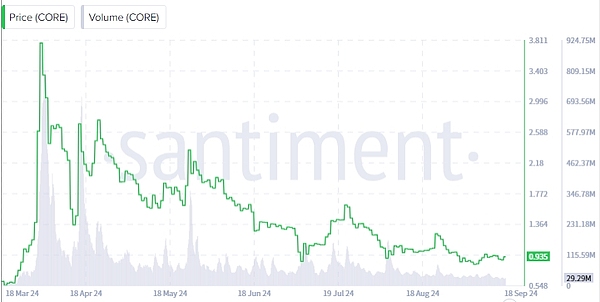
Currently, it is showing signs of trying to break out of the downtrend. So I think CORE token is about to break out and may cause violent fluctuations in the following trading.
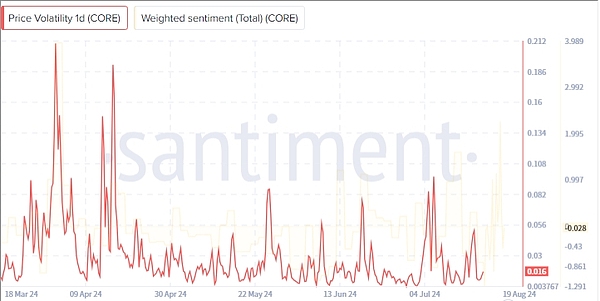
While the price is rising, the Altcoin is still struggling to break above the 20-day EMA. After the price rebound, the weighted sentiment data replicated the peak and crossed the zero line, which shows that investors are increasingly interested in CORE.
Welcome to join the exchange group →→ VX: ZLH1156
CORE Price Prediction: A Bullish Reversal on the horizon?
The Core cryptocurrency has reached a critical juncture near its 20-day EMA barrier and is expected to break the $1 mark. In the past two weeks, the CORE price has retested the $0.8000 demand area three times and attempted to rebound.
However, CORE is below the key EMAs and showing a continued downtrend. Recently, the CORE cryptocurrency tried to break through the $1 mark but was rejected. After the rejection, it remained flat and traded on low volumes.
The price action represents a series of lower highs and lower lows, which is a sign of a downtrend. A daily close above the $1.20 mark will confirm a trend reversal.
Weighted Sentiment and Price Volatility Data Overview
CORE price volatility has surged, showing growing investor confidence in accumulating holdings. At press time, the price volatility curve has surged to 0.016.
At press time, CORE stock was trading at $0.9335, up 4.17% intraday.
What do the technical indicators show?
Technical readings on the daily chart suggest that momentum is building to break above the $1 mark and bulls may succeed soon.
The RSI has generated a positive divergence, supporting the possibility of a breakout. At press time, the indicator is around 45.
Likewise, the Chaikin Money Flow (CMF) reading reflected a sharp rise in liquidity flowing into the market, reflecting growing investor interest. Its value crossed the zero line at 0.04.
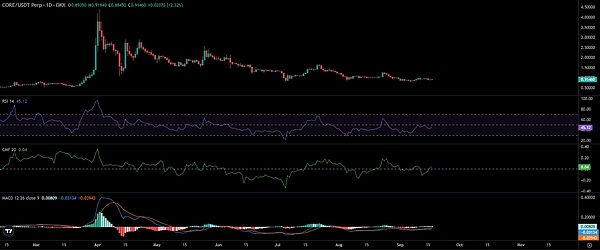
Moreover, the Moving Average Convergence Divergence (MACD) indicator showed a bullish crossover, suggesting strengthening buying pressure.
Looking at the futures market, open interest (OI) increased by over 2.49% to $10.81 million, representing new long positions added over the past 24 hours.
Likewise, the OI-weighted funding rate turned positive at 0.0069%, indicating that long contracts outnumbered short contracts.
The immediate support is at $0.9000 and $0.8800 while the resistance is around $0.9600 and $1.
The article ends here. Follow the official account: Web3 Tuanzi for more good articles.
If you want to know more about the crypto and get first-hand cutting-edge information, please feel free to consult me. We have the most professional communication community, publishing market analysis and high-quality potential currency recommendations every day. There is no threshold to join the group, and everyone is welcome to communicate together!
Welcome to join the exchange group →→ VX: ZLH1156


