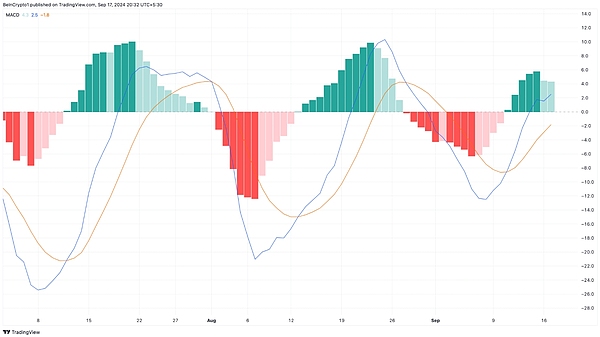
- BNB is showing resilience as the price remains above $500 and the positive crossover on the MACD suggests buyers are in control.
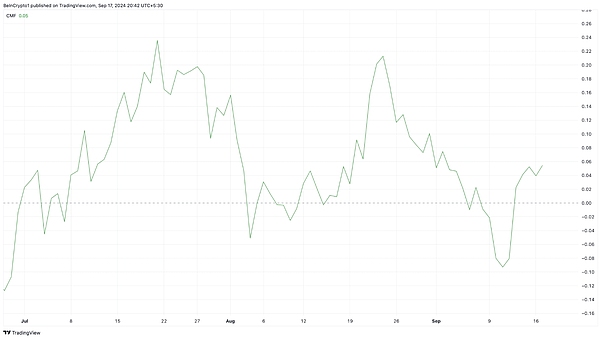
- The CMF’s breakout above the zero line further supports the argument that BNB is experiencing a level of accumulation above significant distribution.
- The formation of a falling wedge suggests that BNB might break the $574.60 resistance and it can push the price to $625.
If you want to know more about the crypto and get first-hand cutting-edge information, please visit Weibo Dolphin 1 for more good articles .
Despite recent volatility, BNB appears to be showing resilience, with its price remaining above $500 since September 11 and currently trading at $552.
BNB is gaining momentum
According to the daily chart, Binance Coin’s (BNB) Moving Average Convergence Divergence (MACD) indicator is currently in positive territory. MACD measures momentum by evaluating the relationship between the 12-day EMA (blue) and the 26-day EMA (orange) to identify potential trend reversals.
Typically, when the 26-day EMA crosses above the 12-day EMA and the MACD reading turns negative, sellers gain control and momentum turns bearish, usually leading to a fall in prices. Historically, this situation has caused BNB to erase some of its previous gains.
However, in this case, the 12-day EMA has crossed above the 26-day EMA, indicating that buyers are currently in control. This crossover suggests that the upward momentum is building, and if the buying pressure persists, the price of BNB could rise further.
In addition to MACD, the Chaikin Money Flow (CMF) indicator also supports the bullish outlook. CMF measures the rate of accumulation or distribution over a given timeframe. When CMF rises above the zero line, it indicates that accumulation (buying pressure) is stronger than distribution, indicating bullish momentum.
Currently, the CMF on the BNB/USD daily chart has moved above the zero line, indicating that the bulls are struggling to push the cryptocurrency towards higher values.
BNB Price Prediction: Rise to $625
On the same daily chart, BeInCrypto noticed the formation of a falling wedge — a bullish technical pattern. Typically, a wedge forms after the price of a swing high falls to a lower value, and the same happens with the price of a swing low.
However, as the trend lines converge, sellers begin to lose momentum and buyers take advantage of the exhaustion. Once the buying pressure increases, the price of BNB is likely to rise above the current levels.
As things stand, the coin will almost certainly break the $574.60 resistance. To do so, the bulls must defend the $517.50 support. If successful, BNB could climb to $625 in the near term.
However, the prediction might be invalidated if BNB fails to break above the resistance. In such a case, the coin might drop below the $517.50 support.
The article ends here. Follow Weibo Dolphin Dolphin 1 for more good articles. If you want to know more about the relevant knowledge of the crypto and first-hand cutting-edge information, please consult me. We have the most professional communication community, publishing market analysis and high-quality potential currency recommendations every day. There is no threshold to join the group, and everyone is welcome to communicate together!