
The momentum oscillator on the daily chart turned negative for the first time since mid-July, suggesting that sellers are gaining strength.
- HNT’s decline further extended amidst the huge selling pressure.
- After losing the $6.70 support level, if buyers fail to step in, HNT could be at risk of falling below $6 and further losses.
If you want to know more about the crypto and get first-hand cutting-edge information, please visit Weibo Dolphin 1 for more good articles .
HNT fell 6% in 24 hours, showing signs of continuing its bearish trend as selling pressure suppressed prices.
At press time, HNT is trading at $6.52, its lowest price so far this month. The token is currently correcting after surging to multi-month highs above $8 earlier this month.
HNT’s recent rise comes amid growth in the decentralized physical infrastructure network (DePIN) sector, which has swelled to a market cap of over $17 billion (Coingecko data).
Will HNT fall below $6?
Traders who bought into the helium rally are taking profits, and if the trend continues, HNT prices could fall further.
The one-day chart shows a continuous descending channel, with HNT experiencing a pullback after a brief rise. This bearish pattern shows that every time the price attempts to rise, traders suppress the rise by taking profits.
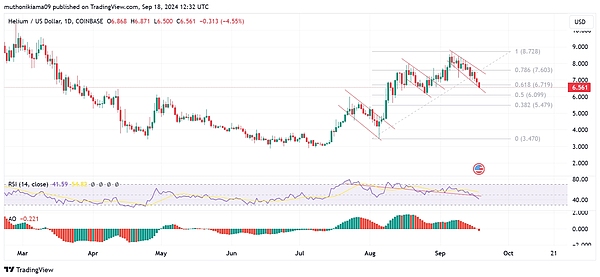
The ongoing selling activity is also reflected in the relative strength index (RSI), which has made new lows. The RSI line has also fallen further below the signal line, indicating strong bearish momentum.
HNT is not yet oversold as the RSI is 41. However, after losing the support of the 0.618 Fibonacci level ($6.70), the HNT price has the potential to fall further below $6. This level has also acted as a strong support in the past and if it fails to hold, a drop to $5.47 is likely.
The bearish thesis is further reinforced by the Awesome Oscillator (AO). The AO has fallen below zero for the first time since mid-July. This suggests that sellers are gaining strength and HNT could continue to move lower.
On-chain data looks bearish
Activity on the Helium network is also showing bearish signals. Data from Artemis shows that daily active addresses have dropped to 15,700, the lowest level this month.
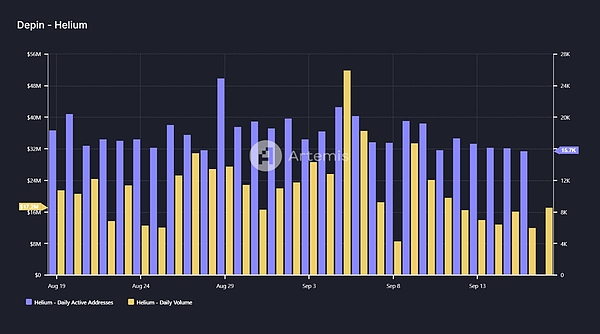
At the same time, daily trading volume has also increased, with this indicator jumping by $5 million to $17 million on September 17.
The increase in volume suggests active short-term trading. However, as prices have not risen on volume, this strengthens the argument for active selling, further dampening the long-term price outlook.
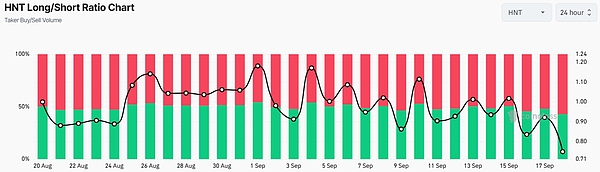
Data from Coinglass also shows that the long/short ratio has dropped to an all-time low of 0.74. This suggests that most traders expect prices to fall further and have taken short positions on HNT.
The article ends here. Follow Weibo Dolphin Dolphin 1 for more good articles. If you want to know more about the relevant knowledge of the crypto and first-hand cutting-edge information, please consult me. We have the most professional communication community, publishing market analysis and high-quality potential currency recommendations every day. There is no threshold to join the group, and everyone is welcome to communicate together!


