

Bitcoin traders are beginning to consider a retest of all-time highs, but Bitcoin price support needs to be firmly consolidated.
The latest analysis says that Bitcoin needs to break through $63,000 on a daily basis to open the way to a new all-time high.
In his latest X analysis on September 19, renowned trader HornHairs defined some key price levels that Bitcoin bulls will turn to for support next.
Bitcoin traders confident of $63,000
Bitcoin continued to rebound as macroeconomic events this week boosted risk assets.
BTC/USD is up nearly 8% this week and is now facing a key resistance level that has troubled the market for months.
“After a very strong response to demand in the $57,000 area, prices here have risen sharply to $63,000,” HornHairs concluded.
“If we can break above $63,000 and stay above that on a HTF close (at least 1D), we could really push for an ATH given the HTF backdrop.”
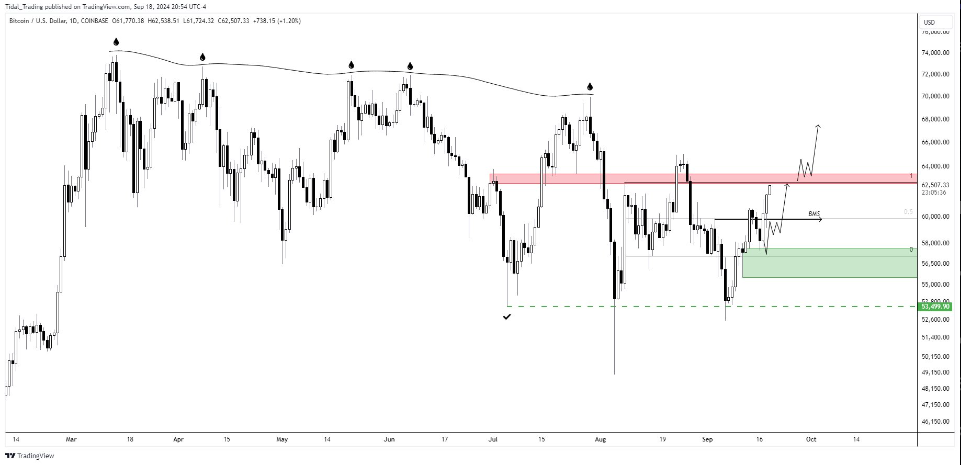 BTC/USD 1-day chart. Source: HornHairs
The mid-$60,000 region is significant because it contains the various trend lines needed to act as support. These include the total cost basis of Bitcoin’s short-term investor community — a level that has traditionally occurred in every bull run.
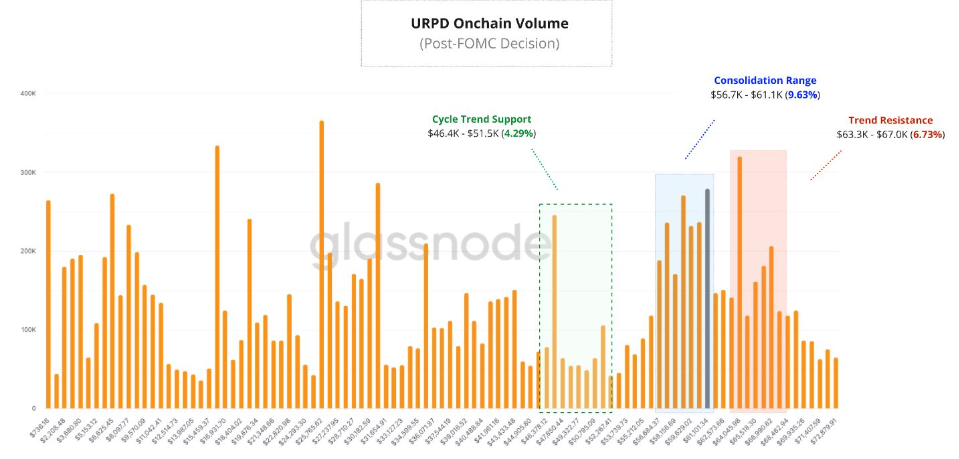 Bitcoin on-chain transaction volume chart. Source: MS2 Capital
Family office MS2 Capital went on to add that the 200-day simple moving average (SMA) now coincides with the area of maximum on-chain volume, which is around $64,000.
The chart uploaded to X includes a comprehensive breakdown of various high time frame resistance levels.
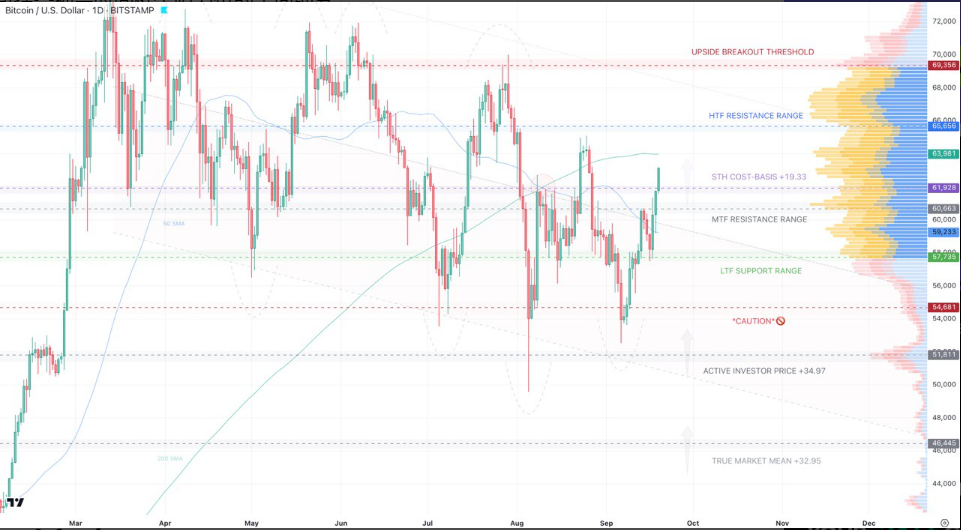 BTC/USD resistance level. Source: MS2 Capital
BTC price breaks out in time?
Meanwhile, prominent trader and analyst Rekt Capital said Bitcoin has made progress within its multi-month descending channel.
He revealed : “Bitcoin is breaking out of its downward trend from lows seen since late July.”
The channel itself means that $67,000 is now a key breakout level.
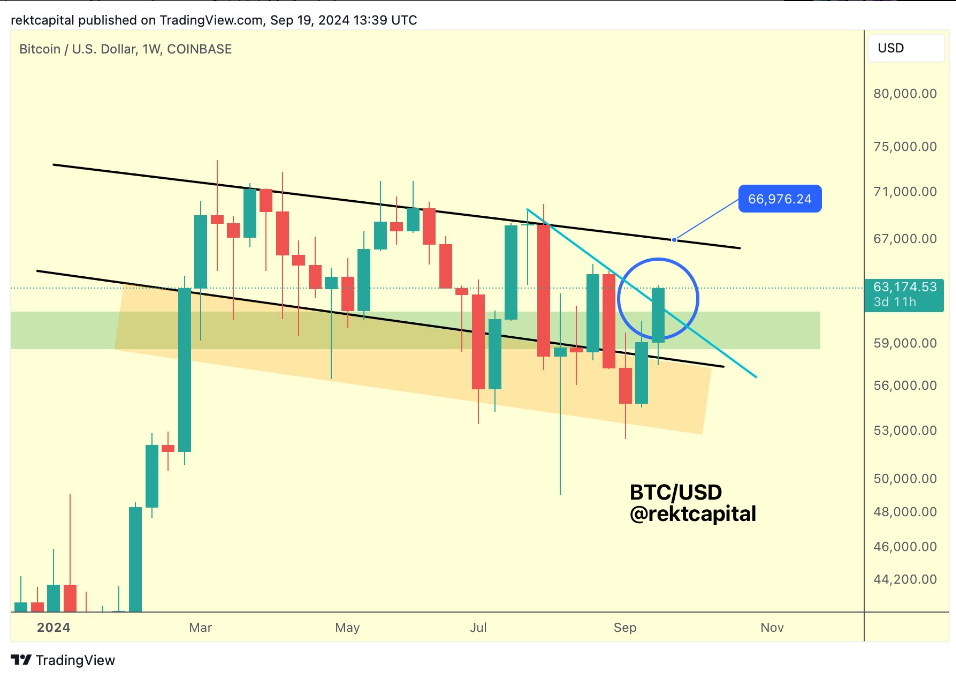 BTC/USD 1-week chart. Source: Rekt Capital
Meanwhile, the time for a breakout is quickly running out — BTC/USD has been stuck in what Rekt Capital calls a “re-accumulation range” since the block subsidy halving event in April.
“Historically, Bitcoin has broken out of its re-accumulation range within 150-160 days of the halving,” he noted.
“It is currently approximately 158 days until the halving.”
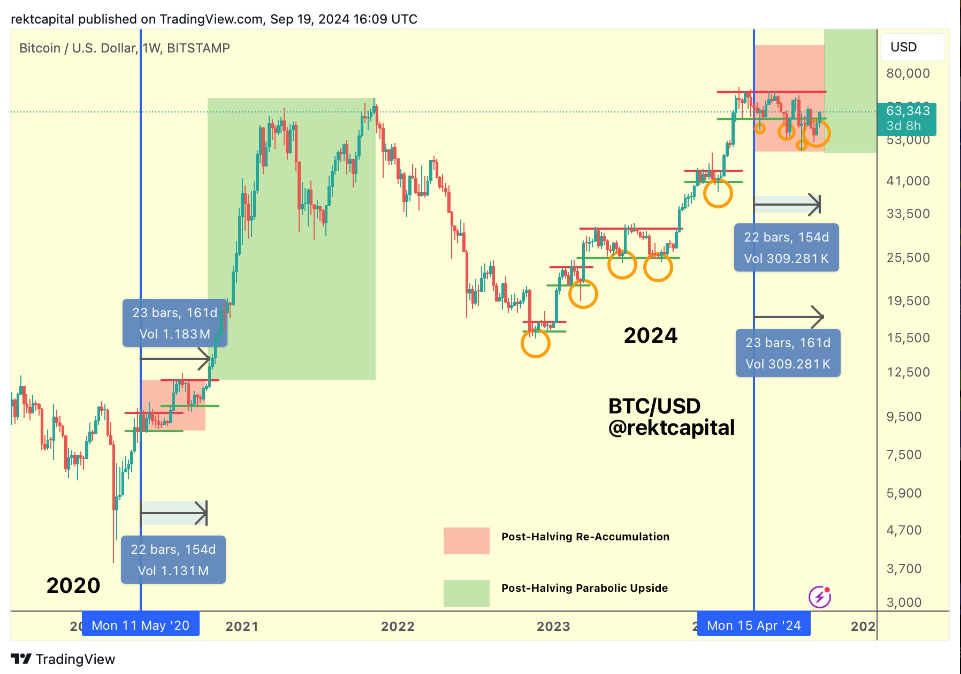 BTC/USD 1-week chart. Source: Rekt Capital


