

Bitcoin BTC is down at $63,873. The drop below $63,000 on September 22 indicated possible profit booking by short-term traders. Some analysts believe that Bitcoin may enter a minor consolidation before attacking the key overhead resistance level of $65,000.
While short-term uncertainty remains, analysts are optimistic about the long-term outlook. Geoff Kendrick, global head of digital asset research at Standard Chartered Bank, expects Bitcoin to reach $200,000 by the end of 2025. Kendrick expects positive inflows into Bitcoin exchange-traded funds, a small rise in inflation, and the potential revocation of Staff Accounting Bulletin 121 (a rule that effectively prevents banks from holding digital assets for clients) to be the main triggers for Bitcoin's rise.
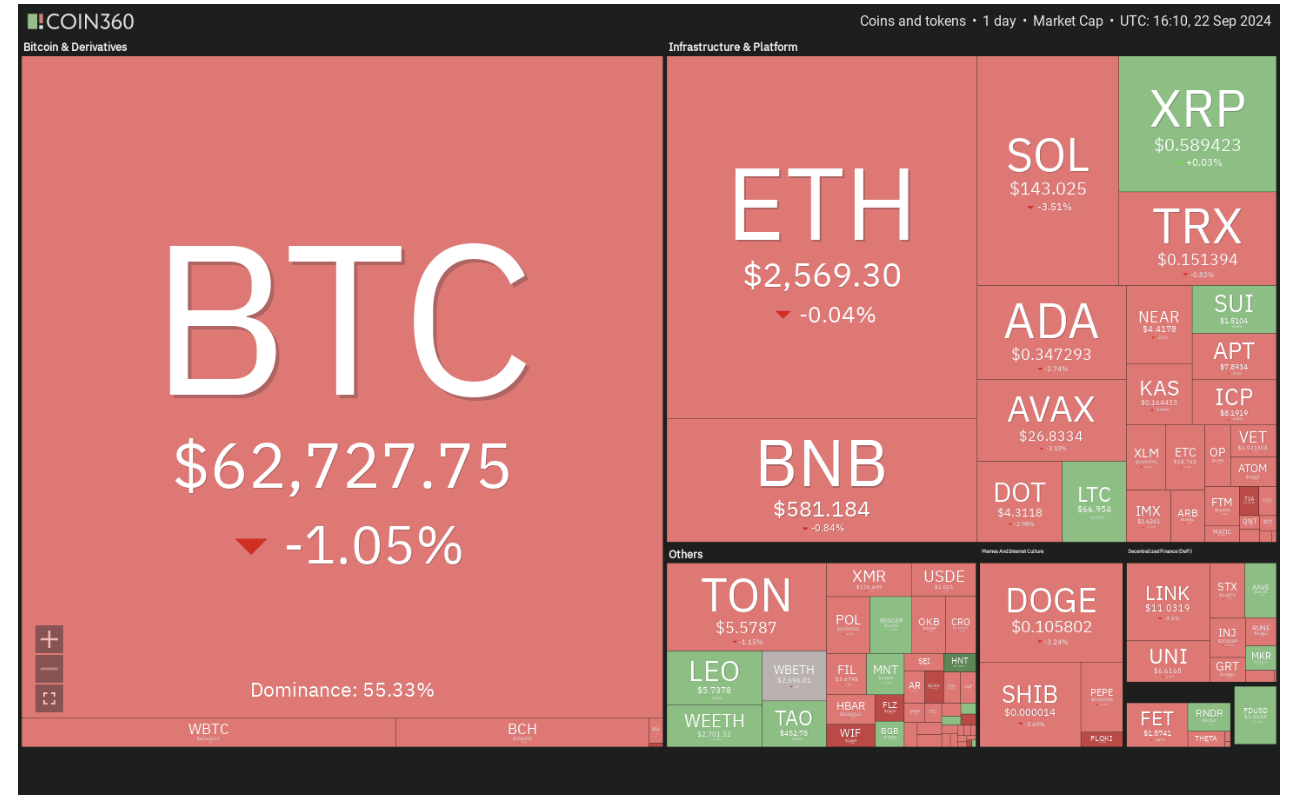
A daily view of cryptocurrency market data. Source: Coin360
Bitcoin’s recovery has fueled buying in some Altcoin, which have broken above their respective overhead resistance levels. If Bitcoin consolidates around current levels, traders may turn their attention to Altcoin.
Can Bitcoin bulls prevent a break below the $61,200 support? Will Altcoin start a rebound in the coming days? Let’s examine the top 5 cryptocurrencies that are performing strongly on the charts.
Bitcoin Price Analysis
Bitcoin’s recovery is facing profit-taking near $64,000, suggesting that bulls are nervous about continuing to buy near the overhead resistance of $65,000.
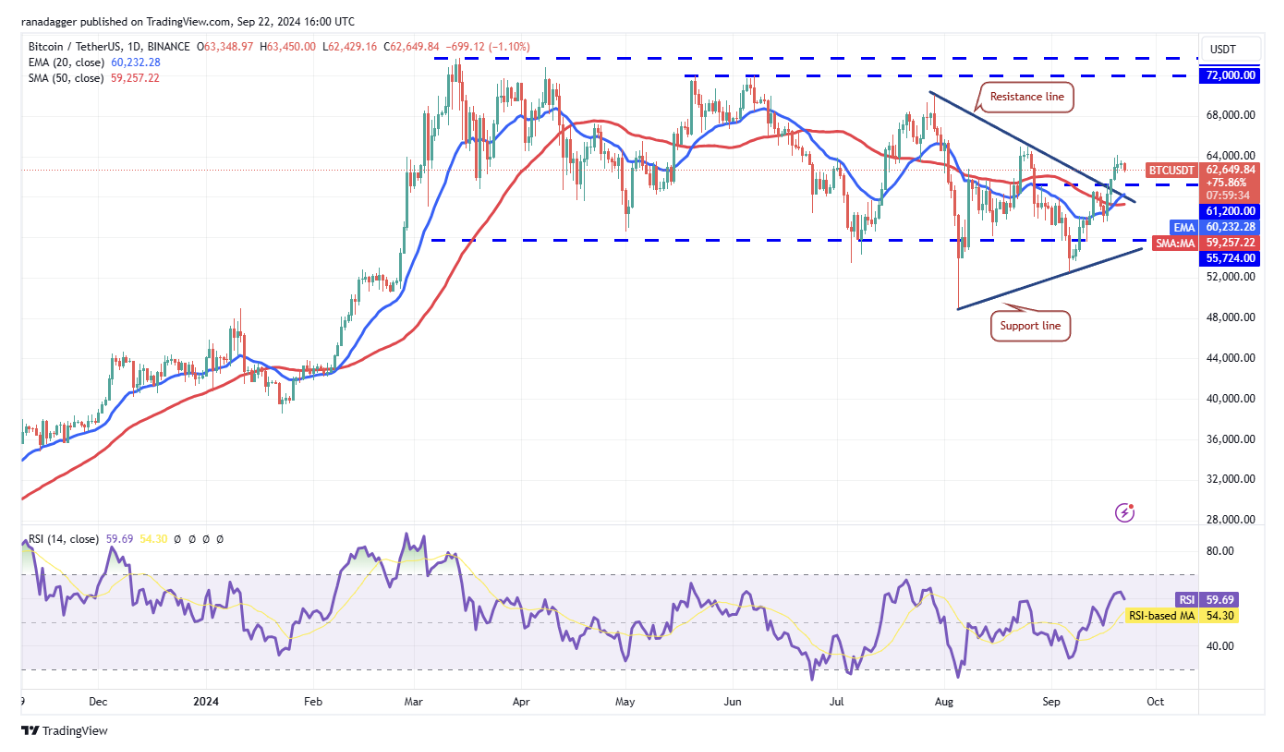
BTC/USDT daily chart. Source: TradingView
The BTC/USDT pair could pullback to the 20-day exponential moving average ($60,232), which is an important level to watch. If the price rebounds off the 20-day EMA, it will improve the prospects of a rally above $65,000. The pair could then surge towards the strong resistance at $70,000.
Conversely, if the price continues to move lower and breaks below the moving averages, it will suggest that the market has rejected higher levels. The pair is likely to then drop to the support line.
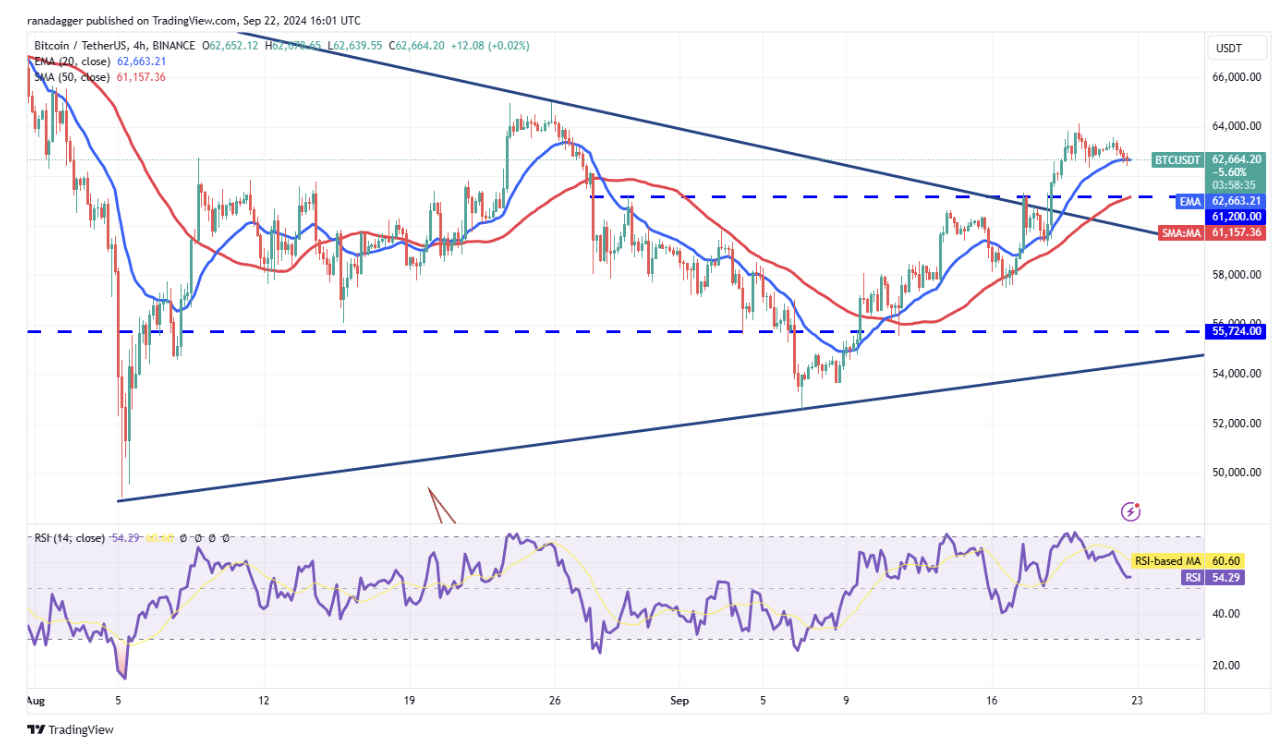
BTC/USDT 4-hour chart. Source: TradingView
The pair has retreated to the 20-EMA on the 4-hour chart. If this support cracks, the pair could drop to the 50-SMA. Buyers are expected to buy aggressively at lows of $61,200. If the price rebounds off this level, it will suggest that the bulls have flipped the $61,200 level as support. The pair will then make another attempt to break out of the $65,000 resistance.
If the bears want to stall the upside, they will have to drag and keep the price below the 50-SMA. If they do so, the pair could drop to $59,000 and then to $57,500.
Avalanche Price Analysis
Avalanche AVAX stock fell $27.63 after breaking out and closing above a descending channel pattern on Sept. 19, indicating a potential trend change.
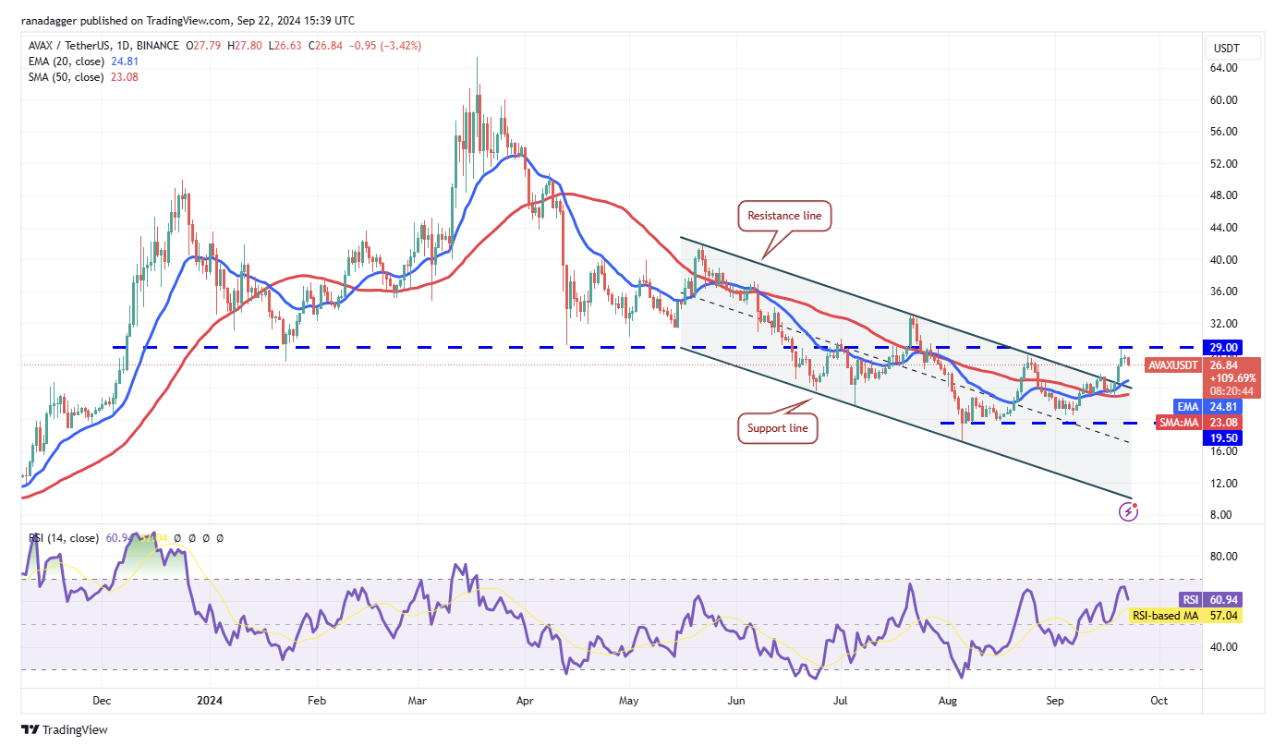
AVAX/USDT daily chart. Source: TradingView
The bears are trying to stall the recovery at the breakout level of $29. If the price turns down from the current levels but finds support at the 20-day EMA ($24.81), it will suggest that the bulls are trying to take control. The AVAX/USDT pair is likely to gain momentum above $29 and jump to $33.
Conversely, if the price turns down and breaks below the moving averages, it will suggest that the pair might remain range-bound between $19.50 and $29 for a while.
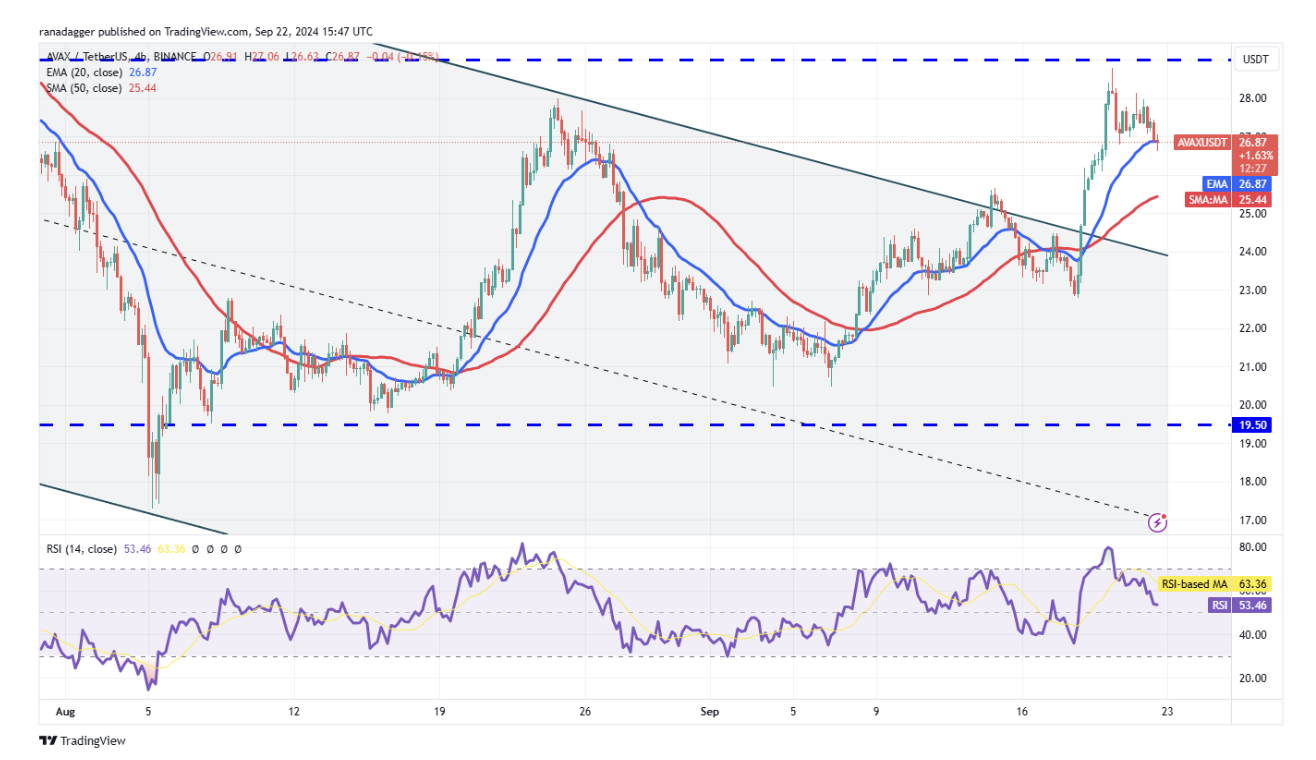
AVAX/USDT 4-hour chart. Source: TradingView
The pair turned down from the overhead resistance at $29 and hit the 20-EMA. This is a crucial level if the bulls want to maintain the positive momentum. A strong rebound off the 20-EMA could result in a retest of the overhead resistance.
Alternatively, if the price remains below the 20-EMA, it will suggest that the bulls are losing control. The pair could then drop to the 50-SMA. Buyers are expected to defend the moving averages vigorously.
Sui Price Analysis
On September 20, the bulls pushed Sui (SUI) above the overhead resistance of $1.44 but higher levels attracted selling.
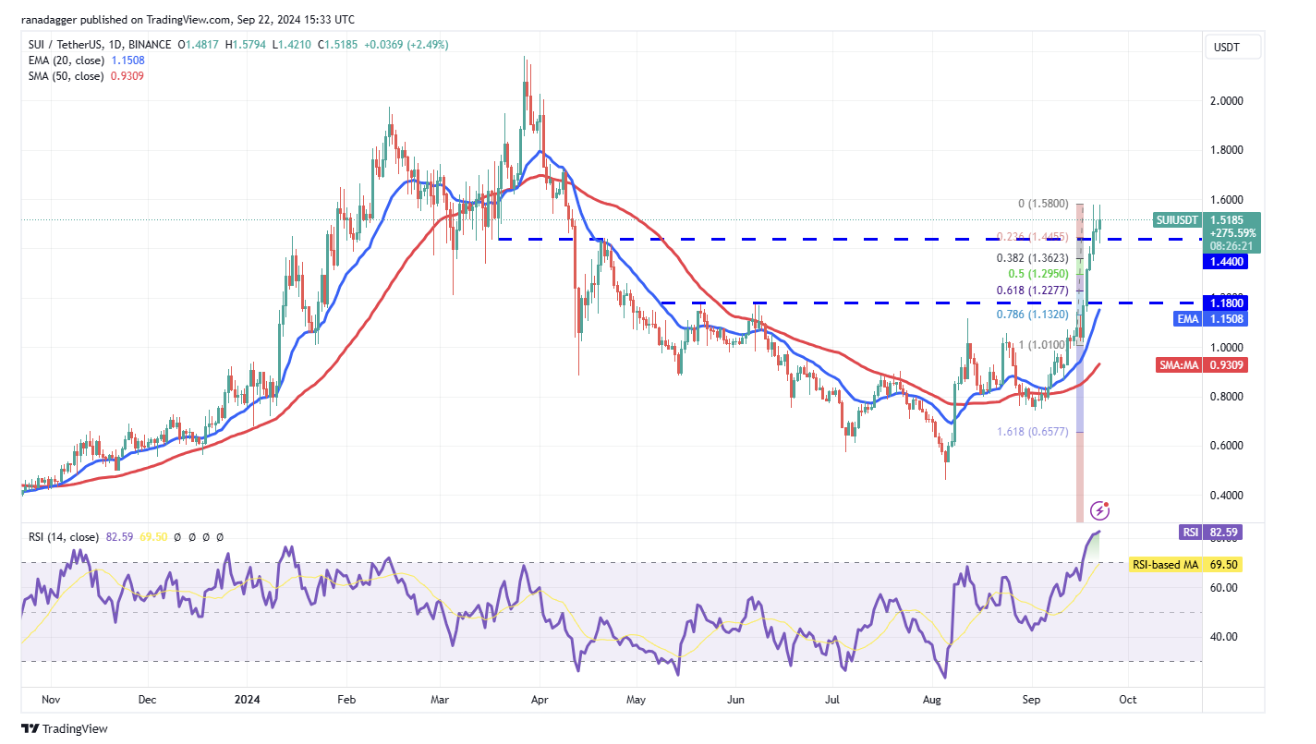
SUI/USDT daily chart. Source: TradingView
The SUI/USDT pair is experiencing a tough battle near $1.44. If the price turns up from the current levels and rises above $1.58, it will indicate that the bulls have flipped the $1.44 level as support. This will improve the prospects of a rally to $1.72.
Conversely, if the price slides and sustains below $1.44, a correction could reach the 50% Fibonacci retracement level of $1.29. Below this level, the pair could drop to the 20-day EMA ($1.15).
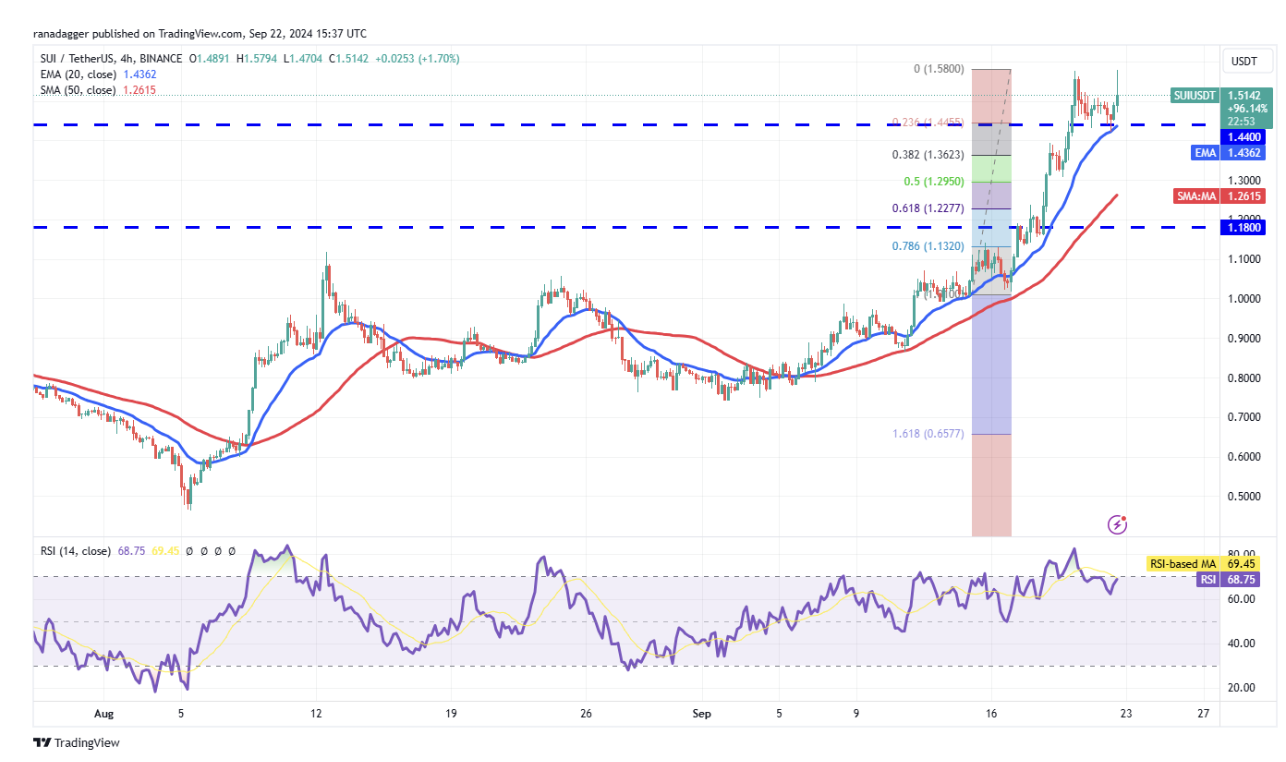
SUI/USDT 4-hour chart. Source: TradingView
The 4-hour chart shows that the bulls are attempting to push the price above the $1.58 resistance level. If successful, it will signal the resumption of the uptrend towards the next target of $1.72.
Contrary to this assumption, if the bears sink the price below the 20-EMA, it will signal the start of a deeper correction to $1.30. This is a critical support level to watch out for because a break below it could lead the price to $1.18.
Bittensor (TAO) Price Analysis
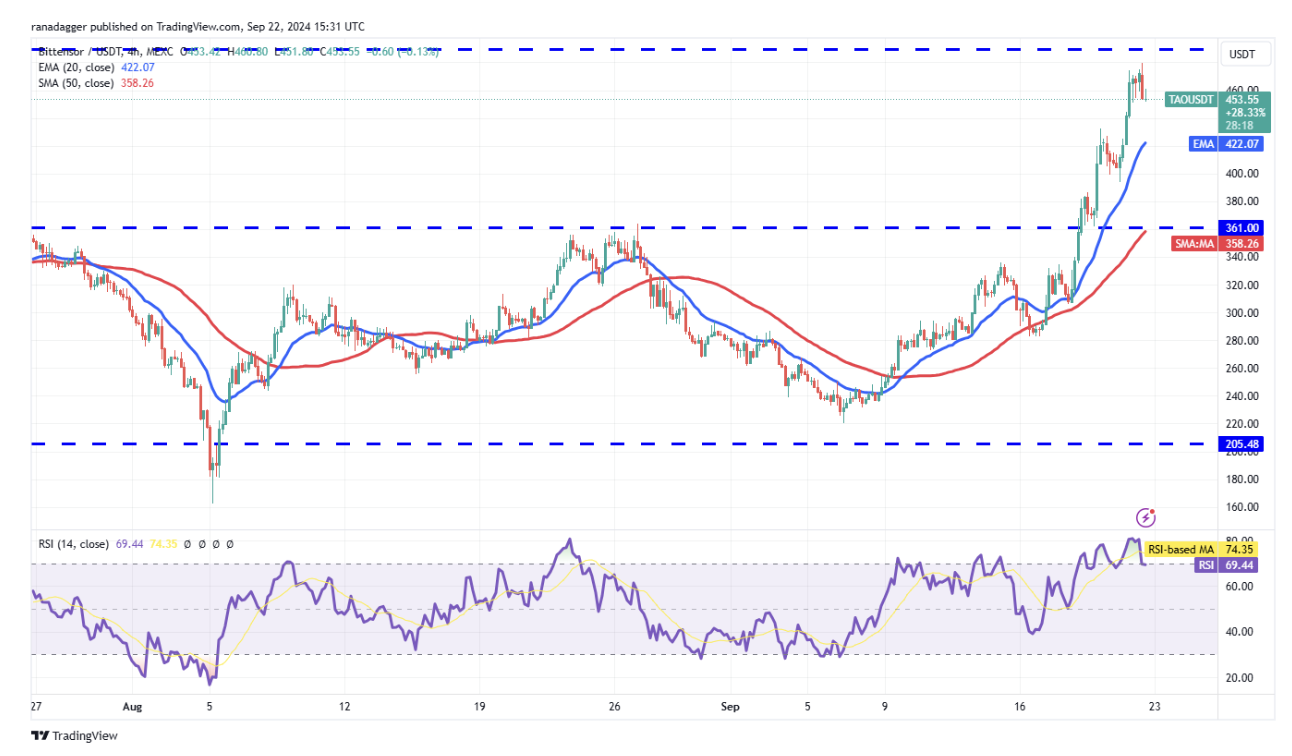
Bittensor (TAO) broke out and closed above the $361 overhead resistance, forming a triple bottom pattern on September 19. The setup has a target price of $517.
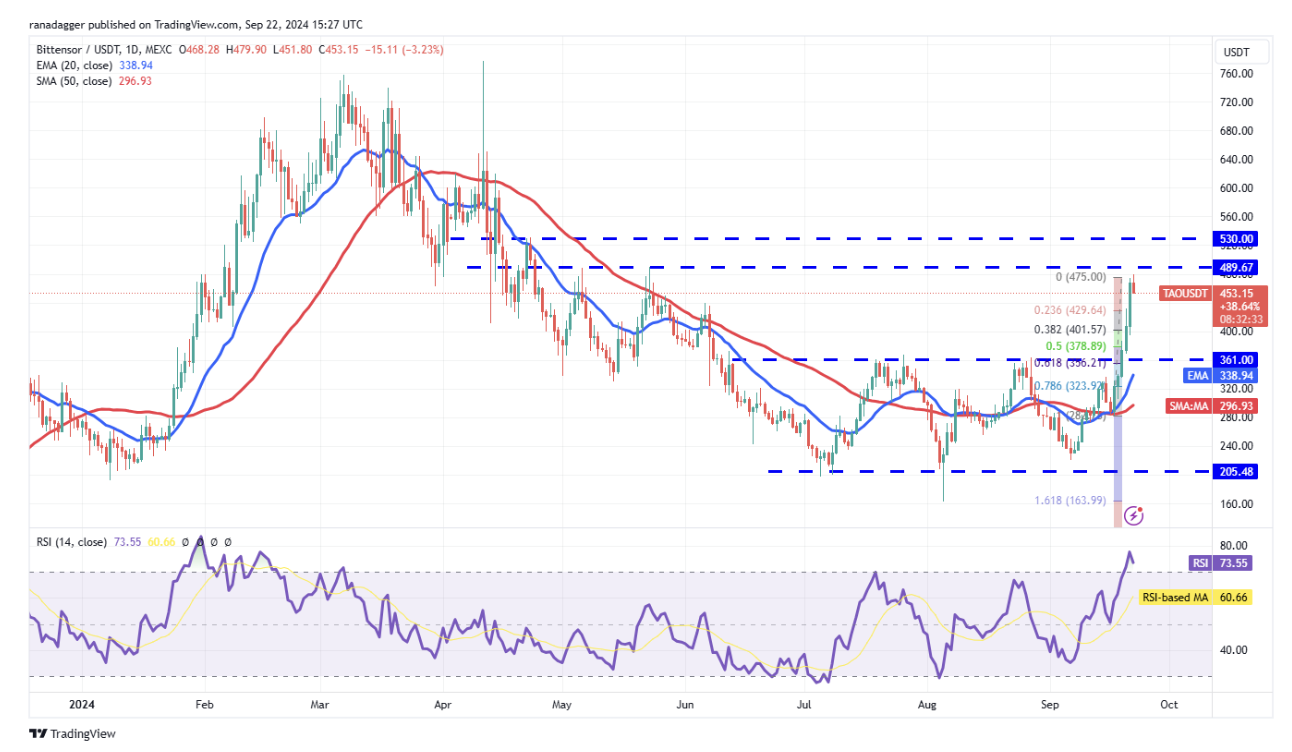
TAO/USDT daily chart. Source: TradingView
The rebound might face selling again near $490 and $530 but if the bulls do not give up too much, the TAO/USDT pair is likely to continue rising. If the $530 level is broken, the pair could surge to $640.
The first support on the downside is the 38.2% Fibonacci retracement level of $401, below which is the 50% retracement level of $378. A break below $378 could lead to a retest of the breakout level of $361, where the bulls and bears are expected to fight for supremacy.
TAO/USDT 4-hour chart. Source: TradingView
The pair is facing selling near $480. The bears will try to pull the price down to the 20-EMA. If the price rebounds off the 20-EMA, the bulls will again try to push the pair to $490 and below it to $530.
Conversely, if the price turns down and breaks below the 20-EMA, it will suggest that the bulls are booking profits. This could open the doors for a drop to the breakout level of $361, where the bulls are expected to step in.
Aave Price Analysis
Aave AAVE stock fell by $171.70 and closed above the overhead resistance of $154 on September 21, but the bulls had difficulty sustaining higher levels.
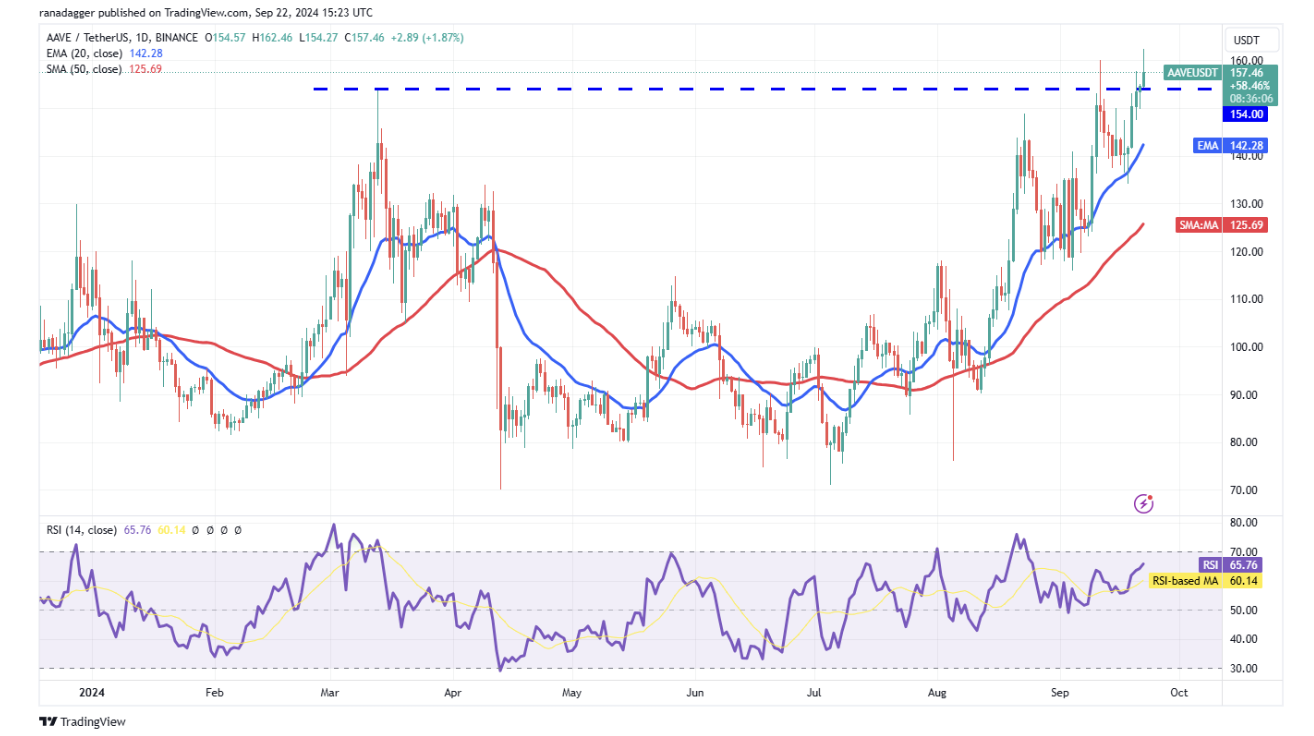
AAVE/USDT daily chart. Source: TradingView
The bears will try to pull the price back below the breakout level of $154. If they do, the AAVE/USDT pair can drop to the 20-day EMA ($142). A strong rebound off the 20-day EMA will indicate that the sentiment remains positive. The bulls will then make another attempt to break out of the overhead barrier and push the pair to $180 and then to $200.
This positive view will be negated in the short term if the price breaks and sustains below the 20-day EMA. This could potentially sink the pair to the 50-day SMA ($125).
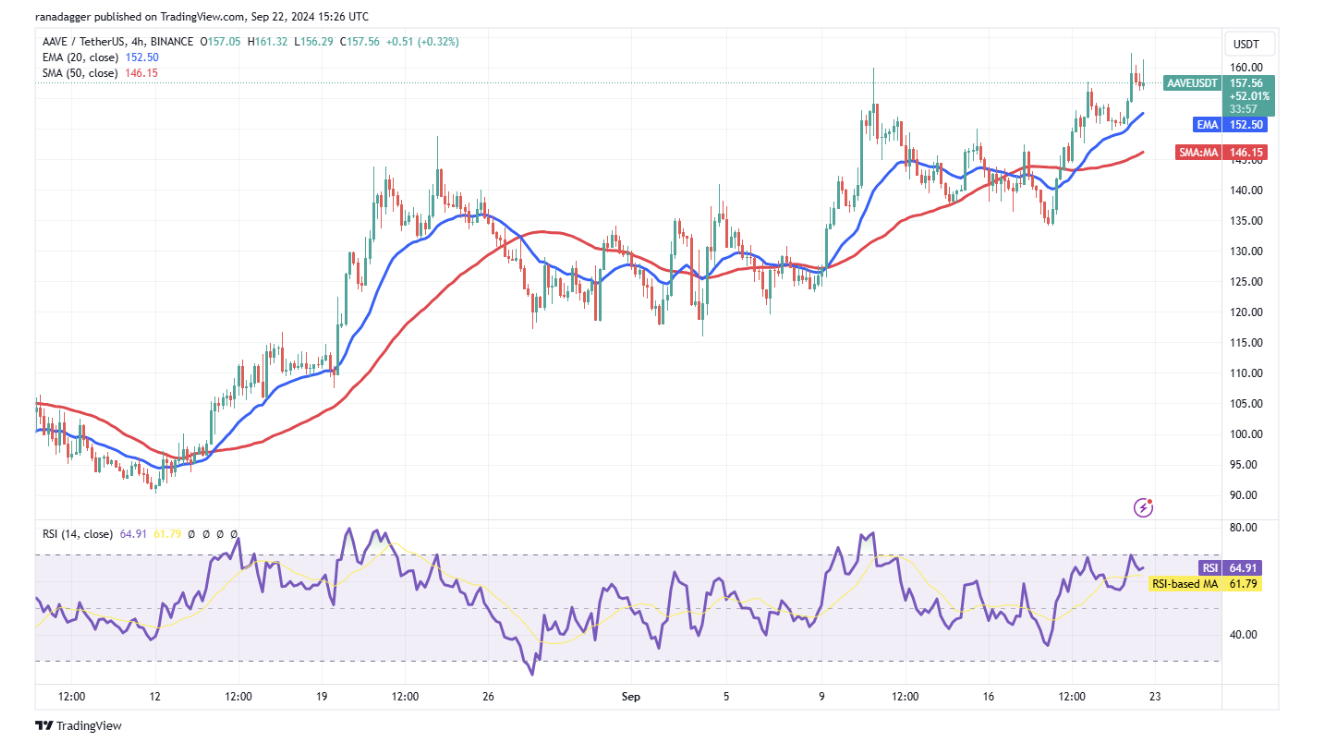
AAVE/USDT 4-hour chart. Source: TradingView
On the 4-hour chart, the uptrend is facing selling near $160, but a pullback is expected to find support at the 20-EMA. If the price rebounds strongly from the 20-EMA, it will increase the possibility of a continuation of the uptrend. The pair could then move up to $180.
Conversely, if the price turns down and breaks below the 20-EMA, it will indicate the start of a deeper correction towards the 50-SMA. This is an important level for the bulls to defend because a break below it could sink the pair to $134.


