

The recent price movements suggest that Bitcoin (BTC) may be approaching a turning point in its trend direction. The Directional Movement Index (DMI) indicates that the downward trend that has been hindering BTC's rise is weakening. The negative directional line that has been dominating the market is gradually disappearing.
Meanwhile, the positive directional line is showing signs of increasing momentum, with the upward trend strengthening. The Average Directional Index (ADX) is also rising, indicating an overall increase in the strength of the trend. If the positive line overtakes the negative line, it can signal a transition to an upward trend.
BTC DMI Suggests Upward Trend
The recent price movements of BTC suggest a turning point in market sentiment. While the downward momentum has dominated for a long time, selling pressure has shown signs of weakening, and the red line has started to decrease.
On the other hand, the positive directional line (blue) is gradually rising, indicating an increase in upward momentum. This convergence suggests that the persistent downward trend is weakening, and the upward trend is preparing to take the lead.
Read more: Top 7 Platforms Offering Bitcoin (BTC) Signup Bonuses in 2024
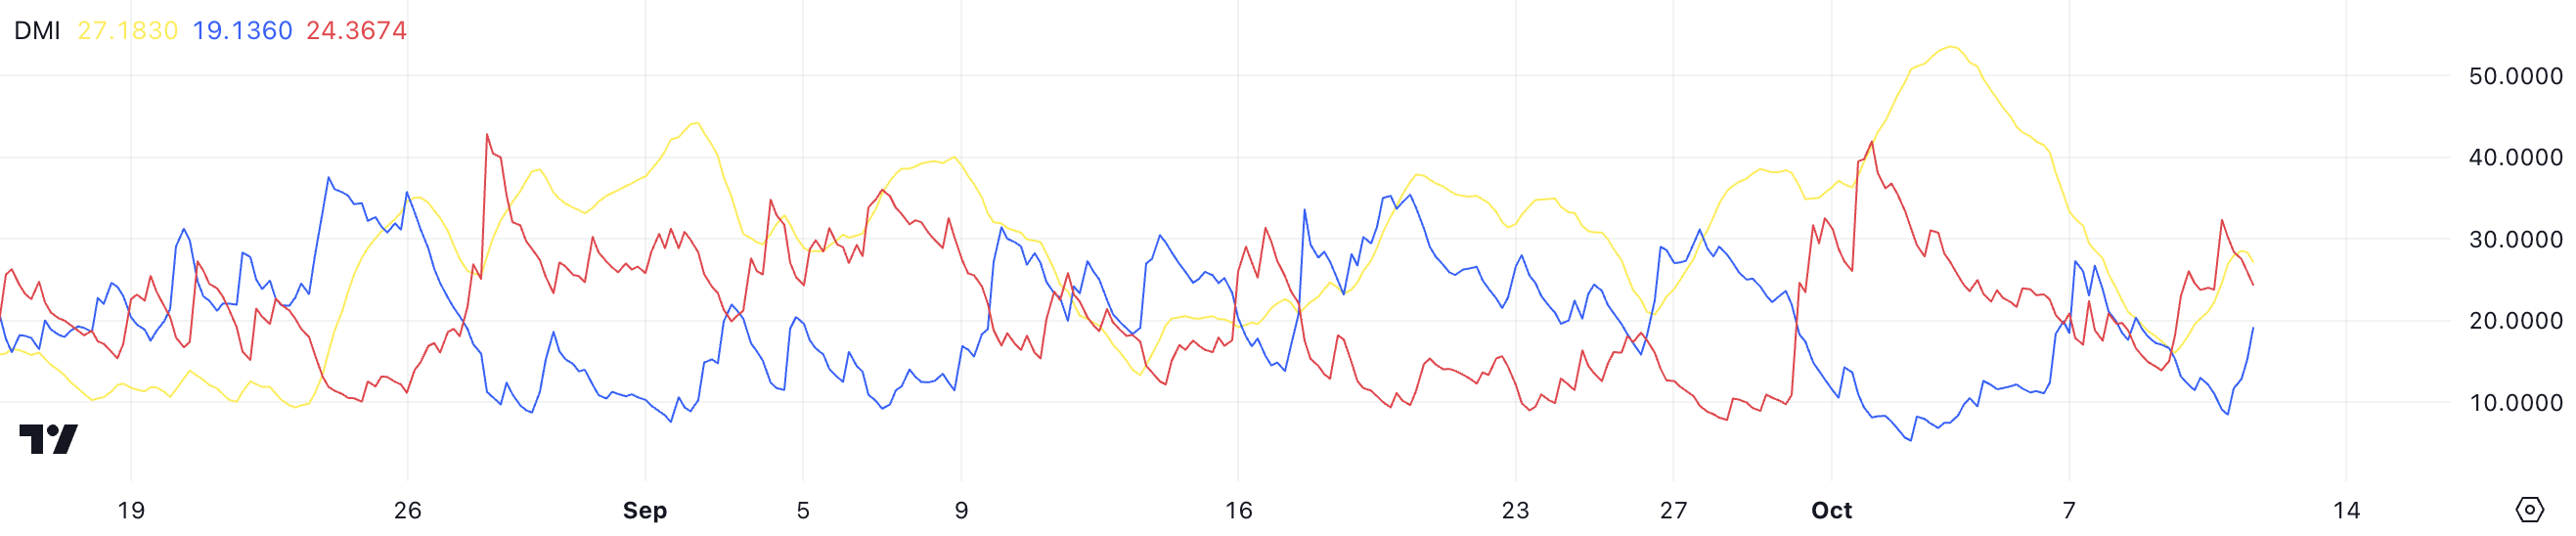
This changing situation is captured by the Directional Movement Index (DMI), which consists of three components: the Positive Directional Index (+DI), the Negative Directional Index (-DI), and the Average Directional Index (ADX). The yellow line representing the rising ADX measures the strength of the dominant trend.
As the downward line weakens and the upward line strengthens, the rising ADX suggests that a significant change in the trend is underway. If +DI crosses above -DI, it could signal a transition to an upward trend, potentially marking the start of a new upward cycle for BTC.
Bitcoin NUPL Lacks Clear Directionality
Bitcoin's Net Unrealized Profit/Loss (NUPL) has shown notable fluctuations over the past month. Initially, the NUPL indicator rose, crossing above 0.50 by the end of September, indicating that market participants were in profit.
This region generally suggests an increase in market optimism and a transition to the "belief" phase, where holders become more confident. However, the recent decline in NUPL below 0.50 suggests a shift in market sentiment.
This reversal reflects a decrease in unrealized gains driven by price declines, causing some investors to become more cautious.
Read more: Top 7 Cryptocurrency Exchanges for Trading Bitcoin (BTC) in the USA
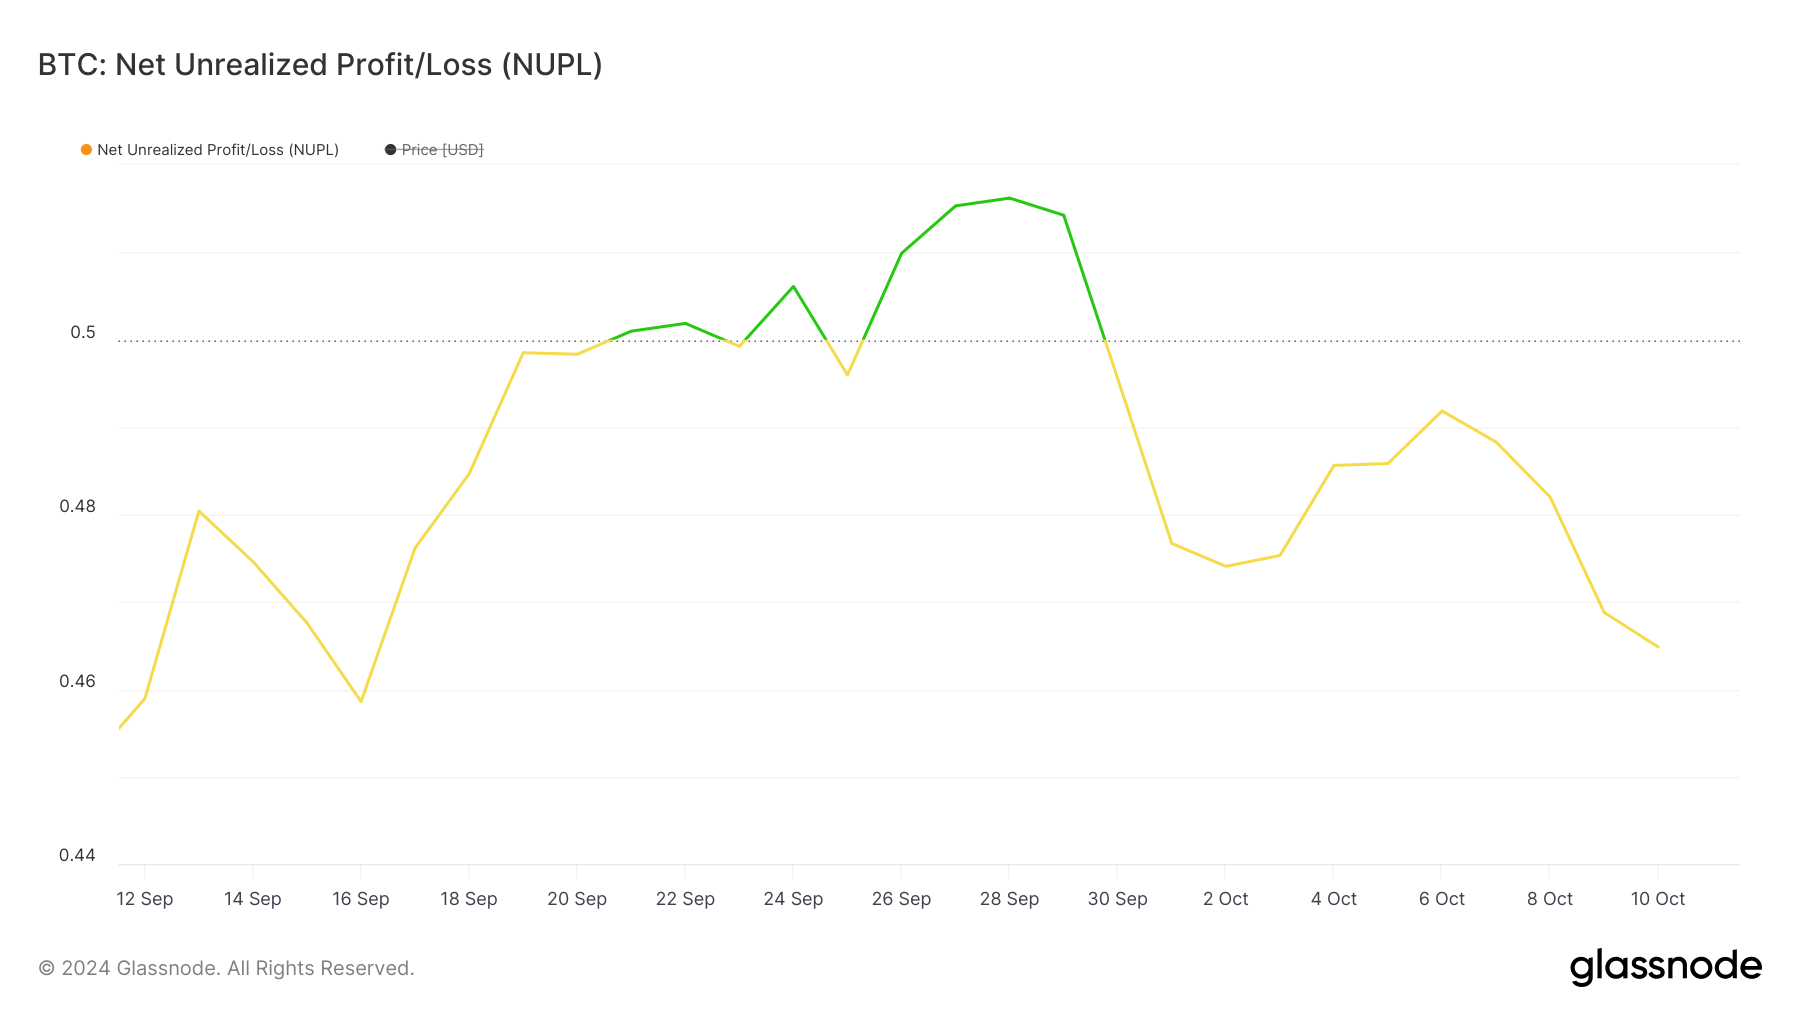
A decrease in NUPL often reflects a shift in sentiment from optimism to neutrality or unease, and if the indicator continues to decline towards 0, it may signal an increase in selling pressure.
If this trend persists, BTC may enter a stage where market participants become increasingly risk-averse. Conversely, if BTC's price stabilizes or recovers, it could reignite a new wave of optimism, pushing NUPL back to higher levels.
The current scenario suggests that the market is at a crossroads, and the next price movements will be crucial in defining the broader sentiment.
BTC Price Forecast: Potential for a Rebound Soon?
BTC's Exponential Moving Averages (EMAs) are currently aligned in a downward trend. The short-term lines are positioned below the long-term lines, but recent movements show a clear upward trend in the short-term lines.
If the short-term lines cross above the long-term lines, they can form a "golden cross" pattern. A golden cross is an upward signal where the short-term moving average crosses above the long-term moving average, often indicating the potential for an upward trend reversal.
EMA (Exponential Moving Average) lines are a trend-following indicator that smooths out the data variations across different time frames, allowing for a more accurate understanding of market trends. They place more weight on recent price movements, making them more sensitive to changes in momentum. Traders often use the positions and crossovers of short-term and long-term EMA lines to identify potential buy or sell opportunities.
Read more: Bitcoin (BTC) Price Prediction 2024/2025/2030
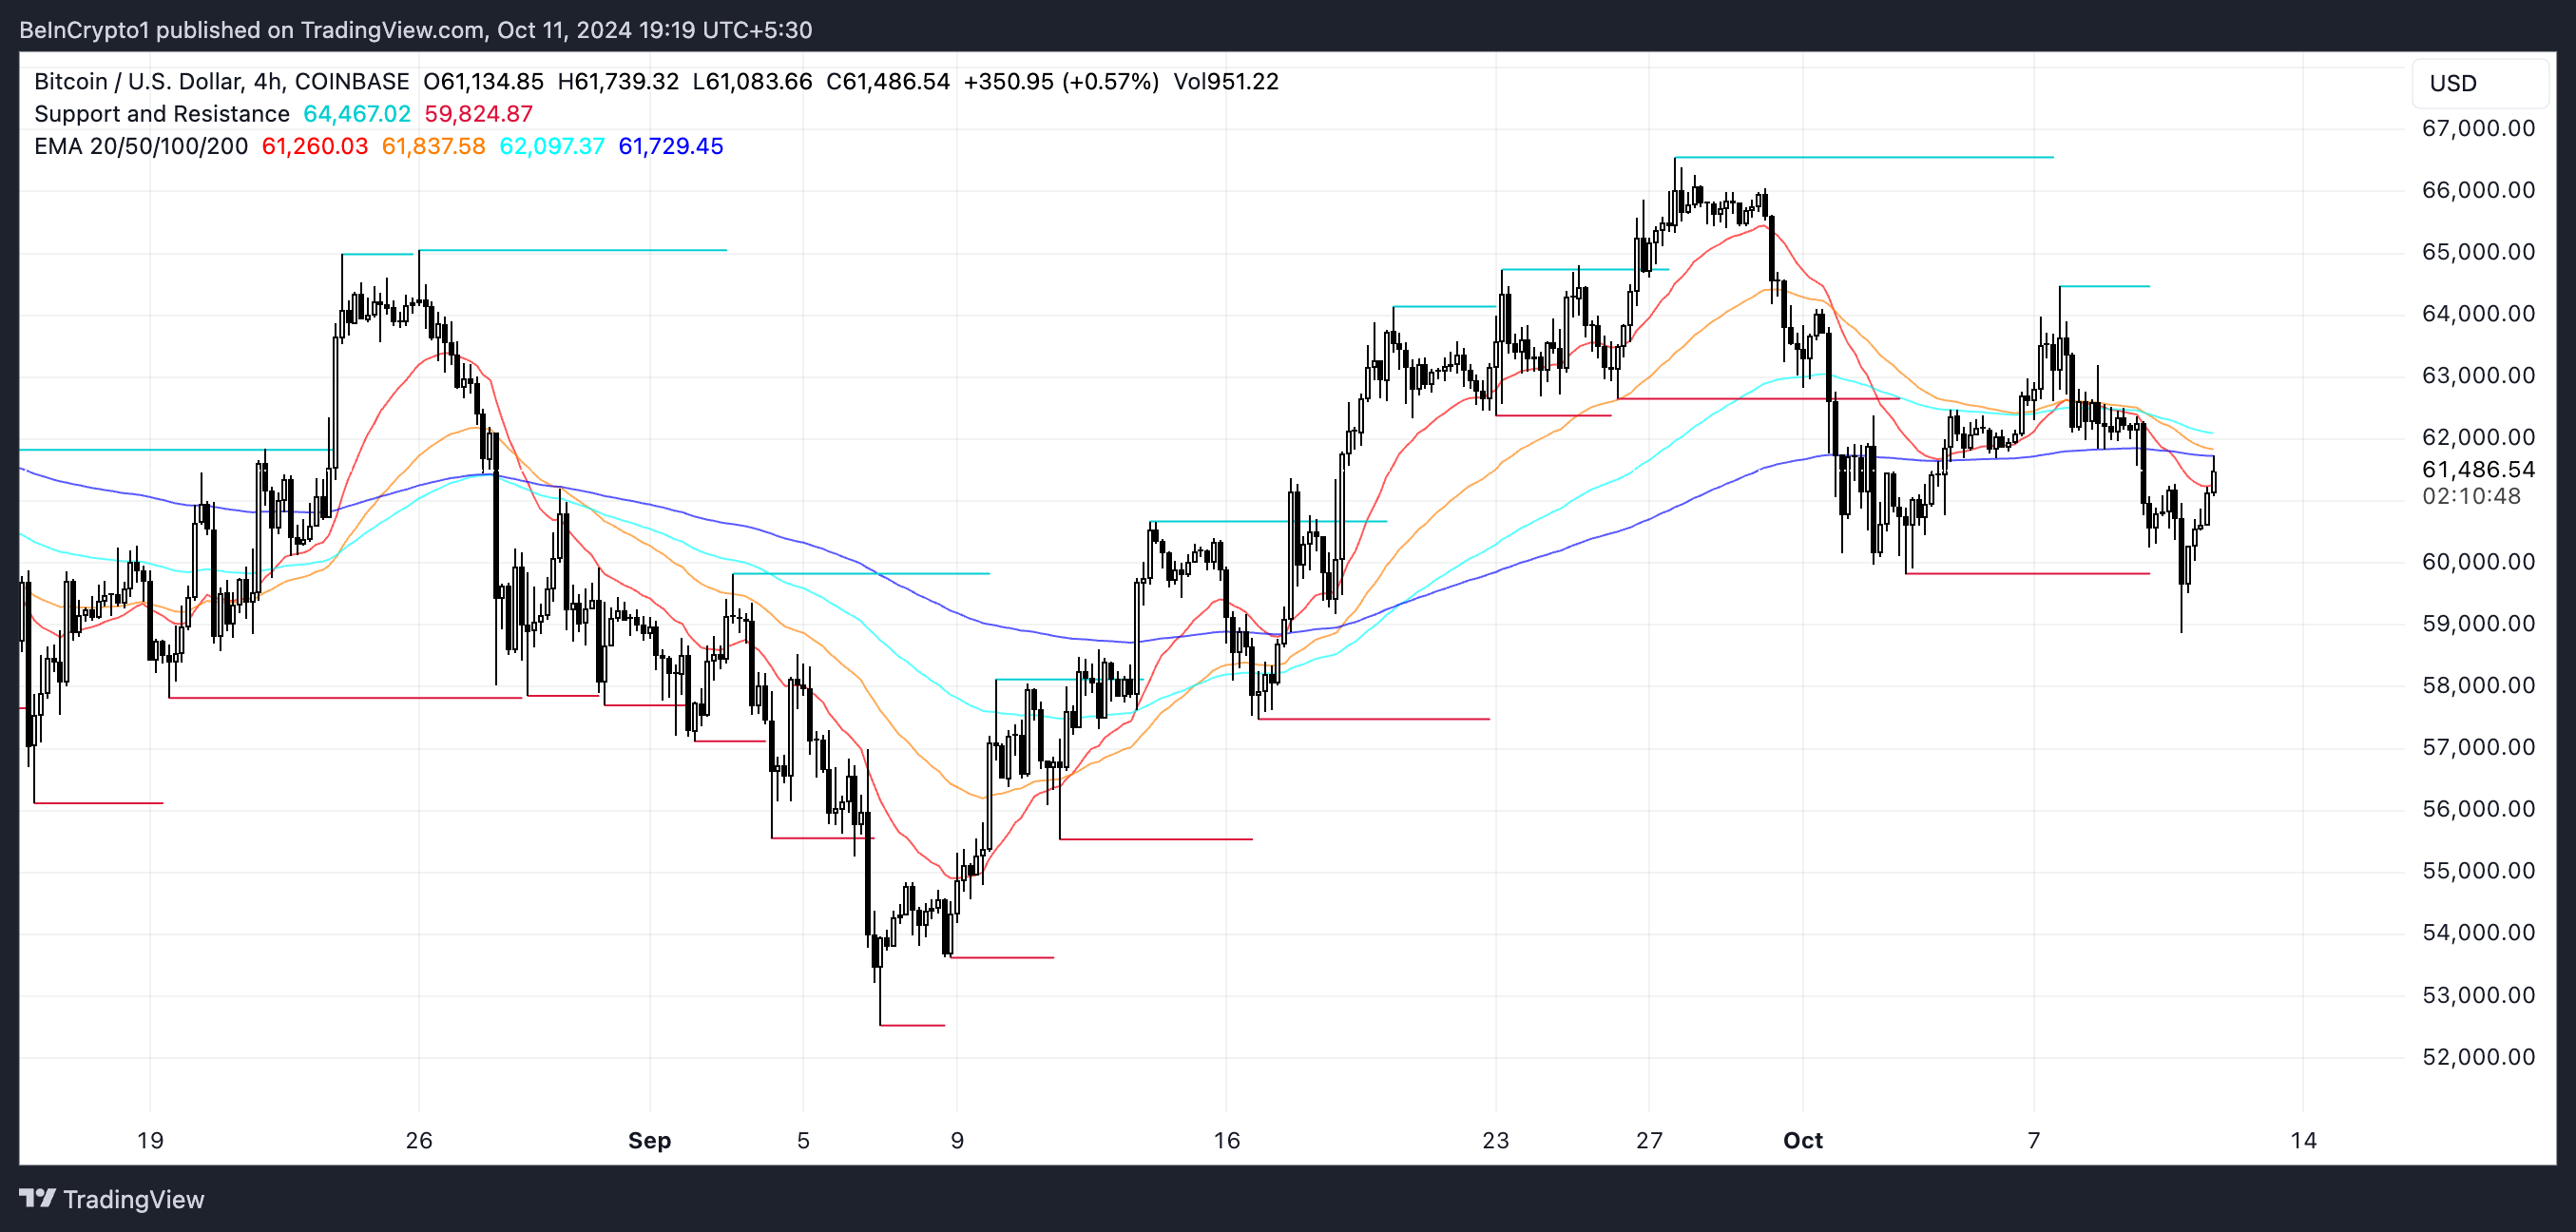
If the upward trend continues to develop, BTC is likely to test resistance around $64,700. If this level is breached, further upside towards $66,500 could follow, representing a 7.2% price increase.
However, if the upward trend does not materialize, BTC may maintain its downward trajectory and test support around $59,000. If this level fails to hold, the price could drop to $57,000, resulting in an 8% decline.


