

Author: 1912212.eth, Foresight News
The market is not as optimistic as many people want, but it is also not as pessimistic as some people think. No one could have predicted that the crypto market's decline, which began in March of this year, would last a full six months. It once fell to the point where some investors couldn't help but swear, cursing the heavens, the earth, and the exchanges, to the point where a certain ancient OG prophet predicted that they should be prepared for an 18-month protracted war, and to the point where some whales posted on Twitter giving up on the crypto circle, calling for more people to go all-in on the A-shares.
Will there be an altcoin season again? Whenever the market is skeptical, it is precisely the bottom of the market. Whenever history gives an answer, it always responds: there will be.
History is also surprisingly similar. In 2023, the market began to stagnate in the middle of the year, until it took off again starting in October of last year. This year is the same. Interestingly, some funds seem to be smart, as if they have smelled the scent and have quickly positioned themselves in advance. As a result, the market saw a sharp rise as early as the end of September.
After a brief correction in early October, the self-fulfilling prophecy of "October's rise" was realized again. BTC has risen again from the short-term $52,000 level to around $68,000, just $6,000 away from the all-time high, and even the once-despised altcoins have also seen significant gains from the bottom, some even doubling or tripling.
After half a year of waiting, has the bull market arrived?
Bitcoin Spot ETF Data Continues to See Massive Inflows
Bitcoin spot ETF data represents the real volume of buying power outside the market. Unlike our personal trading, it represents the willingness of some people to pay a fee to have someone else buy BTC for them. Looking at the historical chart, when the net inflow is large, the buying power is strong, and the price of Bitcoin tends to rise. When the net outflow is large, the price tends to fall.
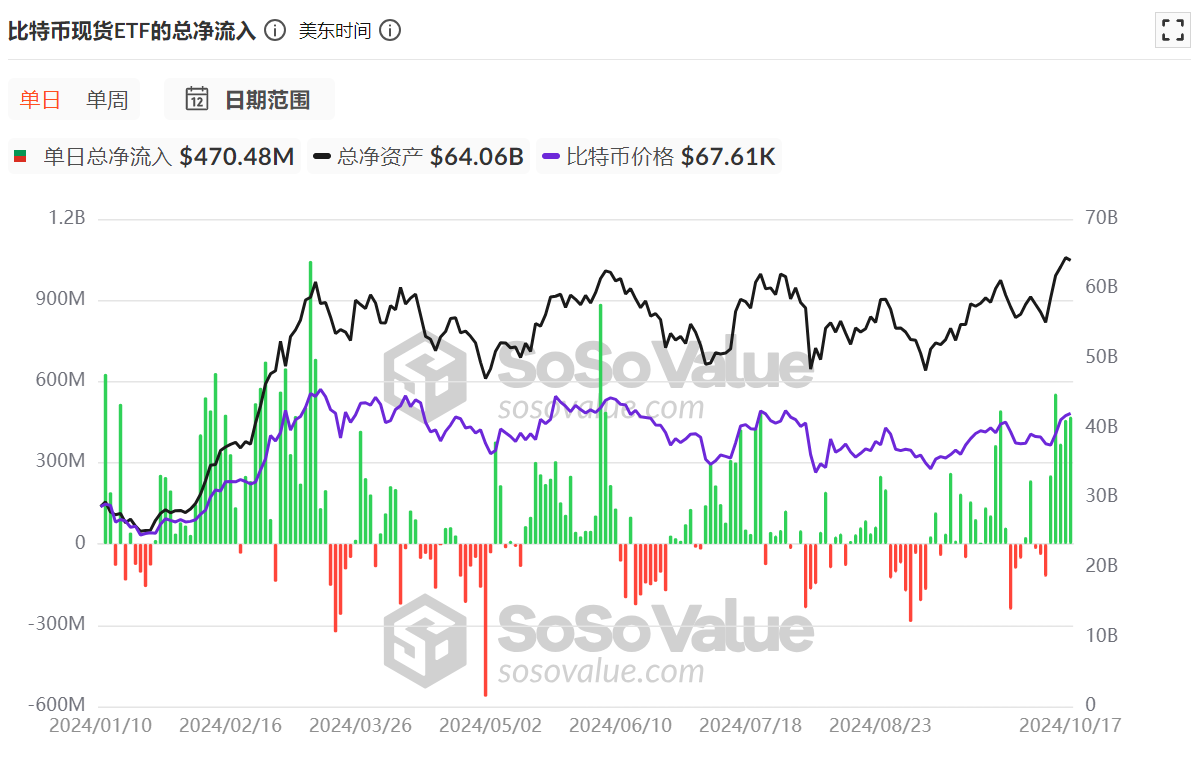
Since the spot ETF was officially launched, the total net inflow has reached $20.66 billion. It is worth noting that from October 1st to the present, there have been 6 days of net outflows, but 7 days of net inflows, and the amount of net inflows has been quite large. On October 14th, the net inflow exceeded $555 million, and on October 16th and 17th, the net inflows both exceeded $450 million. On October 15th, the net inflow exceeded $370 million.
Although in terms of the number of days, the net inflows and net outflows are roughly equal, the net outflow amounts are small, while the net inflow amounts are often several times the net outflow.
Even the unpopular Ethereum spot ETF has seen a rare single-day net inflow of $48.41 million since October.
The buying power outside the market remains quite strong.
Stablecoin Market Cap Approaches All-Time High
Changes in the total stablecoin market cap represent the size of capital inflows and outflows. Although the market has fluctuated up and down over the past few years, with capital flowing in and out, when we zoom out, it is difficult to be pessimistic.
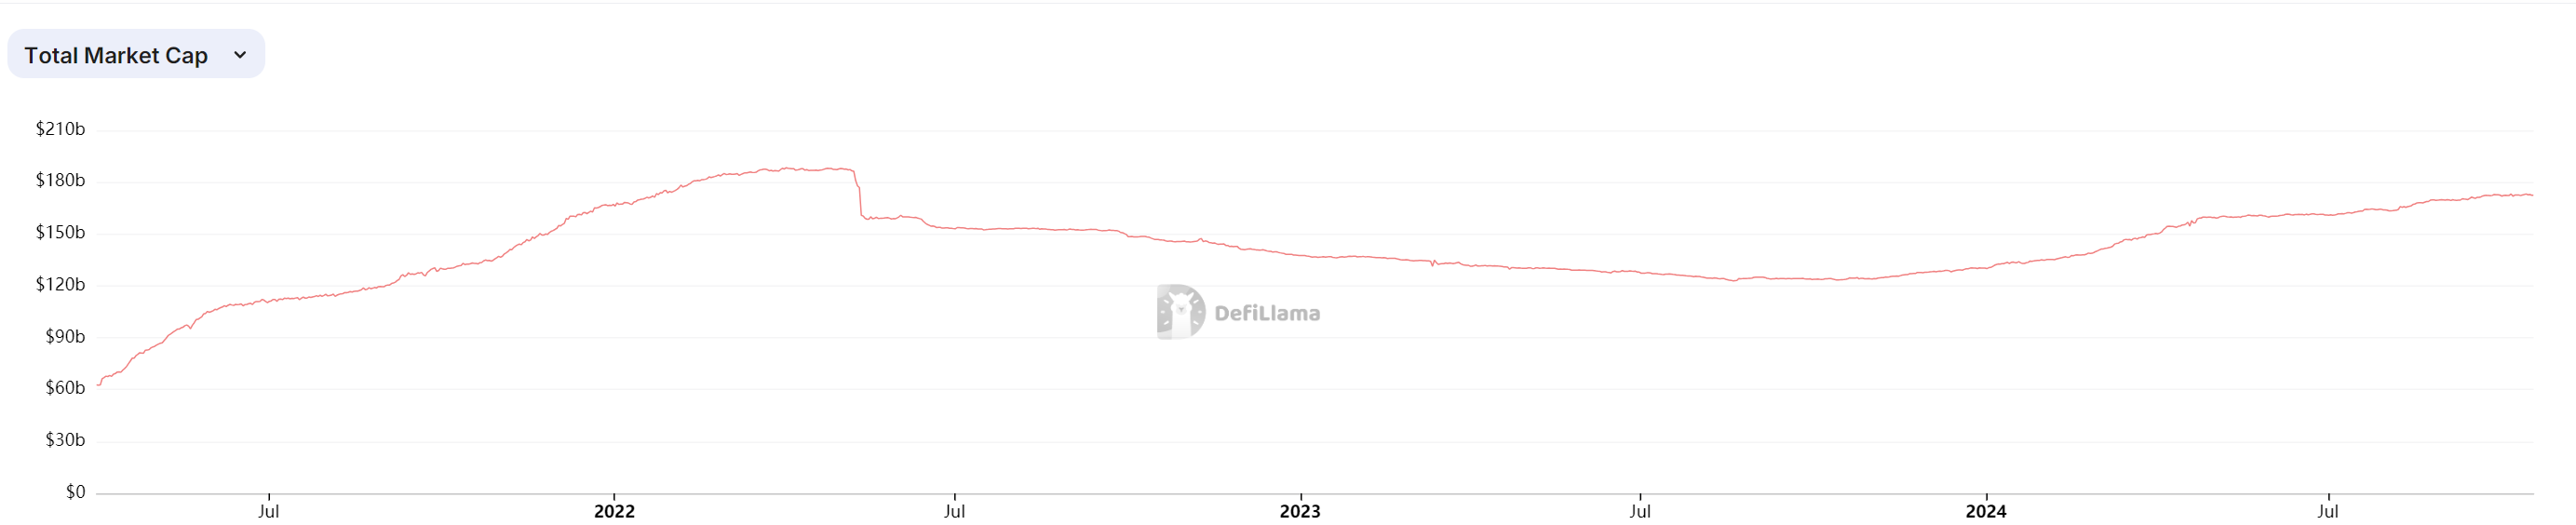
The total stablecoin market cap reached a historical high of $186.3 billion in mid-2022, and then fell continuously, but overall maintained above $120 billion. Fast forward to October 2023, capital inflows have been accelerating, and the current total stablecoin market cap has exceeded $172.3 billion, close to the historical high.
BTC Unrealized Net Profit/Loss Indicates Most Players Are Profitable
Bitcoin's unrealized net profit/loss is a metric mainly used to measure the profitability/loss of Bitcoin chain players. We can see that the color of the line from top to bottom is red, orange, light yellow, gray-white, and light blue. The bottom blue represents the majority of people taking losses, while the top red represents the majority of players being profitable.
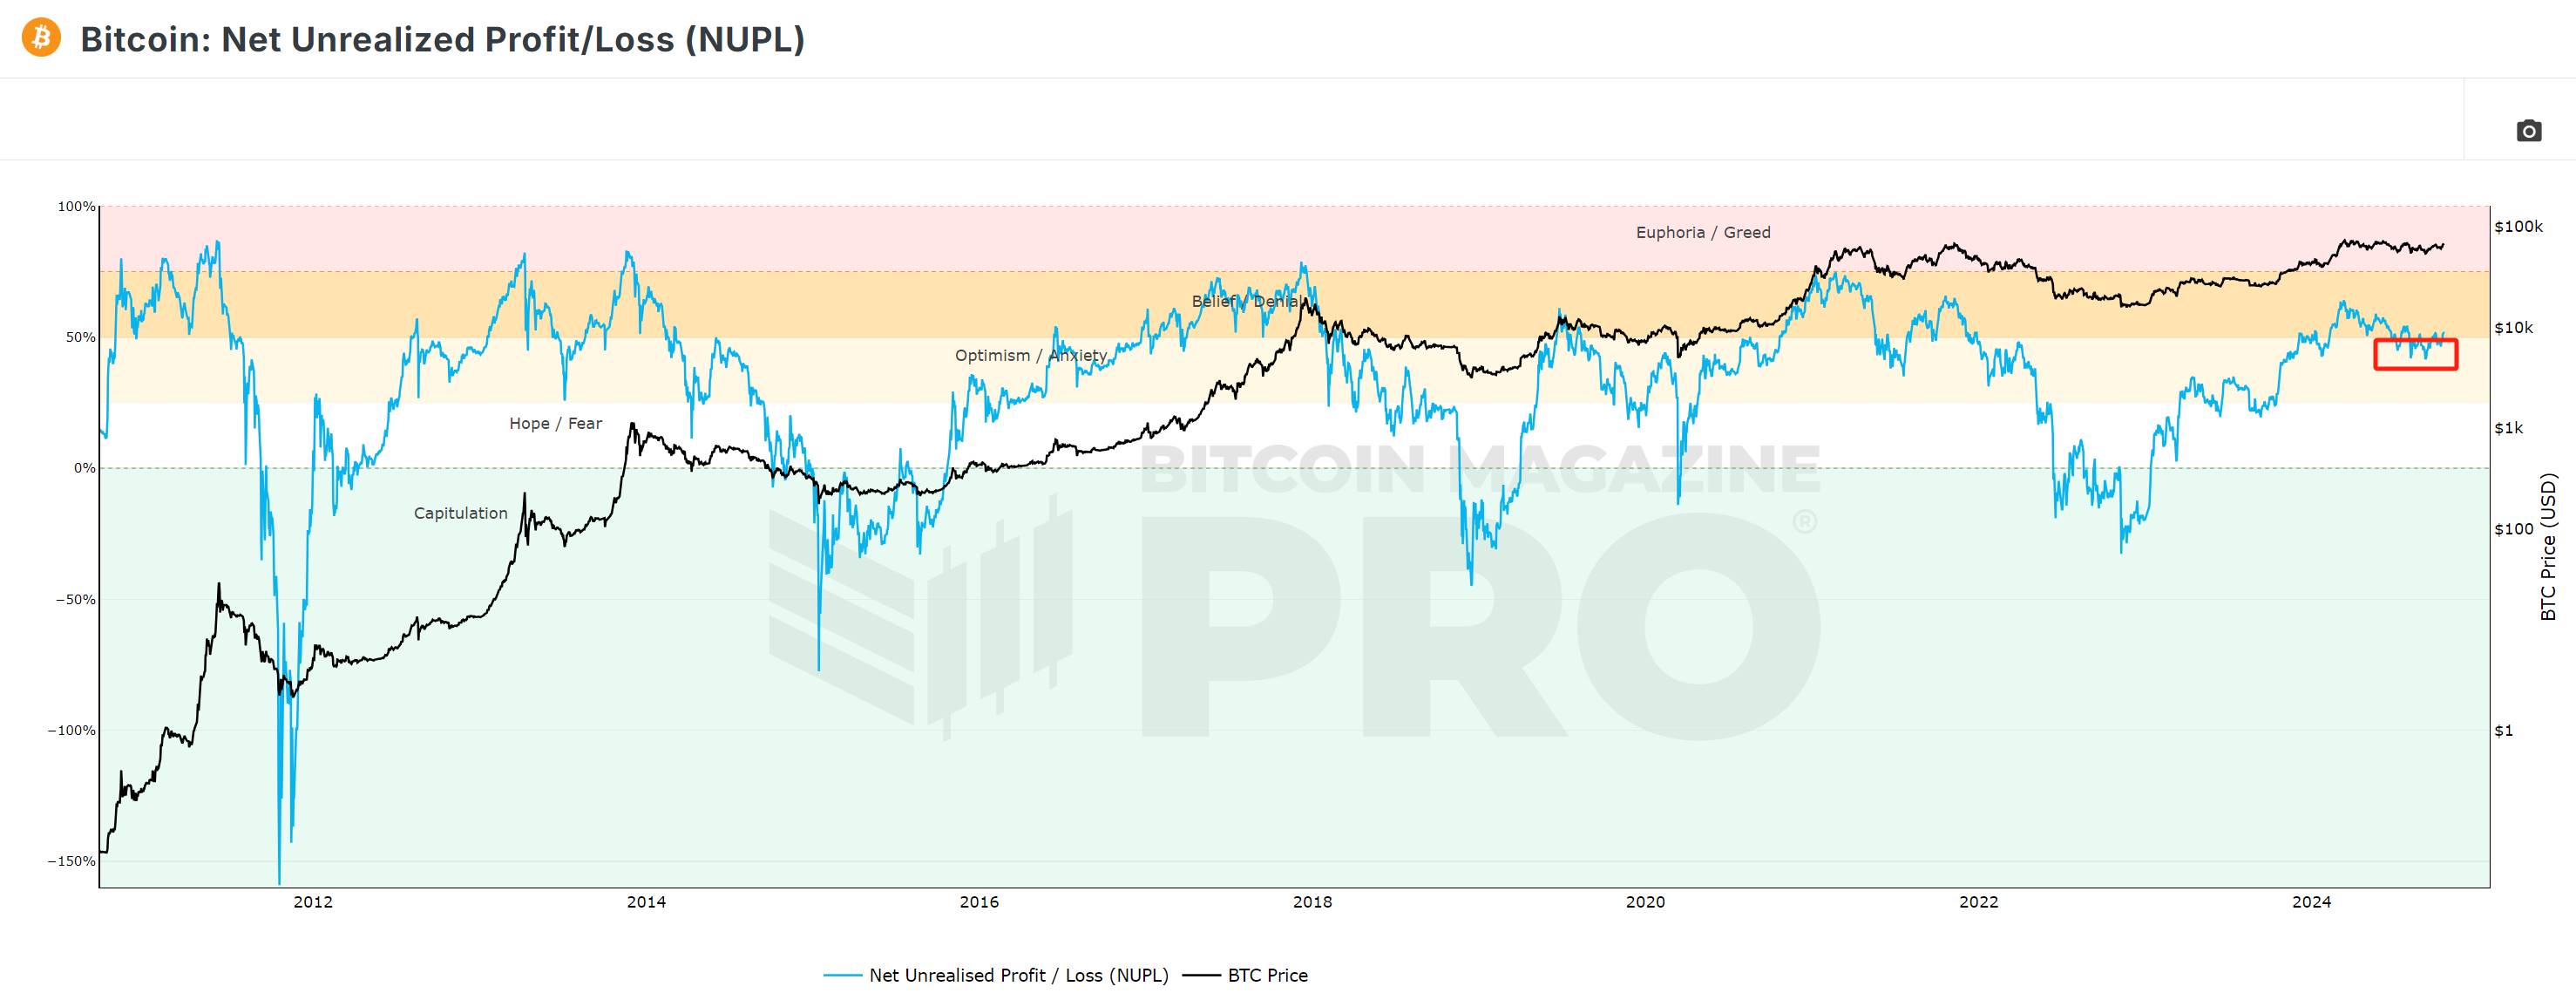
When the line chart is in the light blue area, it is often the bottom of the BTC price range, as those who have taken losses continue to exit and establish a bottom. When the line chart is in the yellow or red area, it is often the top of the BTC price range, as a considerable number of profit-takers choose to take profits and exit, leading to the top of the cycle. This cycle repeats.
From the line chart, the market has now climbed back from the light-colored area to the yellow area. According to data disclosed by IntoTheBlock, 95% of BTC addresses are now profitable, and market sentiment has clearly improved.
Historically, this level often signals a strong bullish trend, but it may also represent potential overheating.
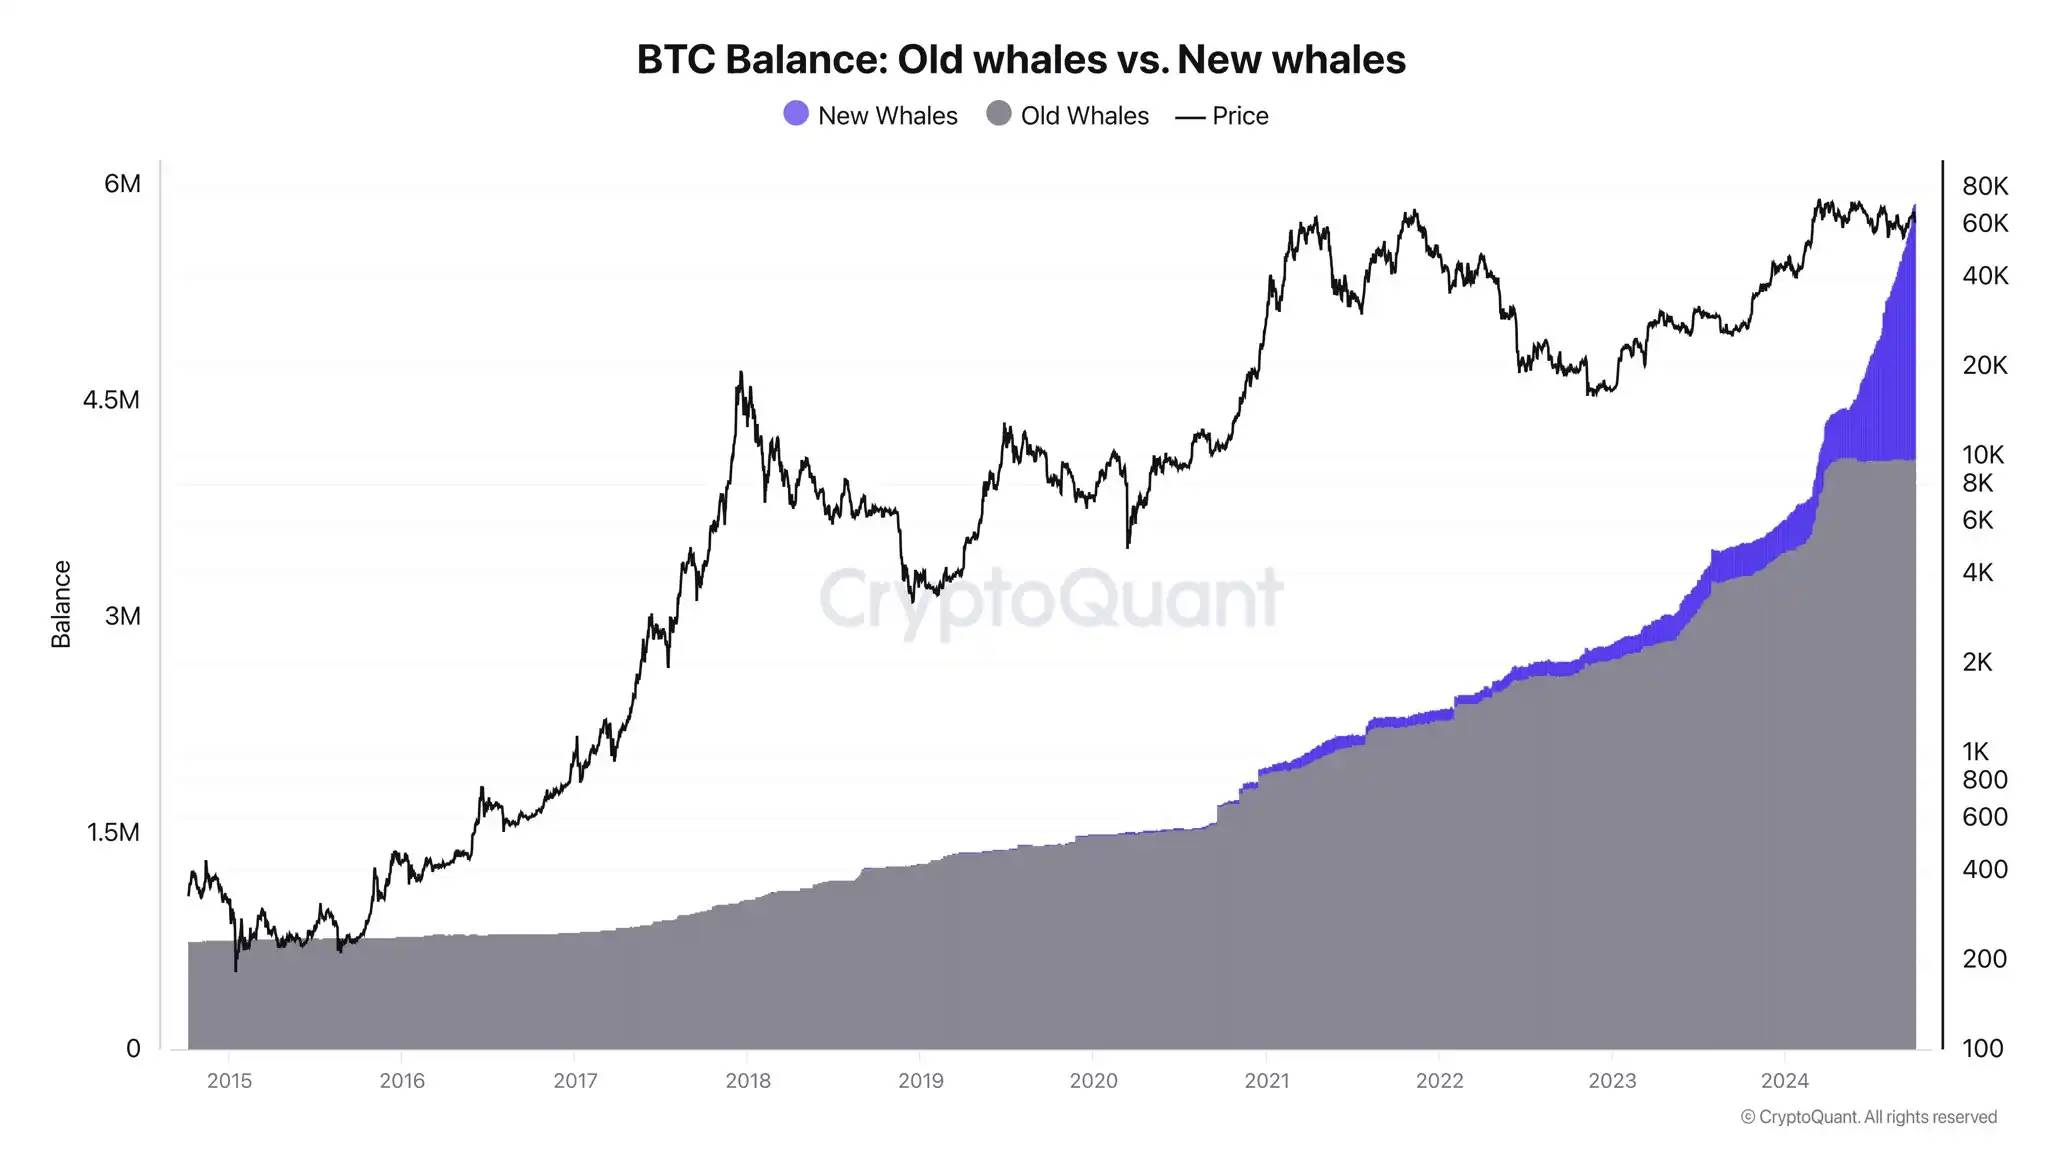
Long-Term Bitcoin Holders Continue to Buy, Buy, Buy
The long-term holder supply, mainly shows the total BTC held by long-term holders. Here, long-term holders refer to addresses that have held BTC for more than 155 days.
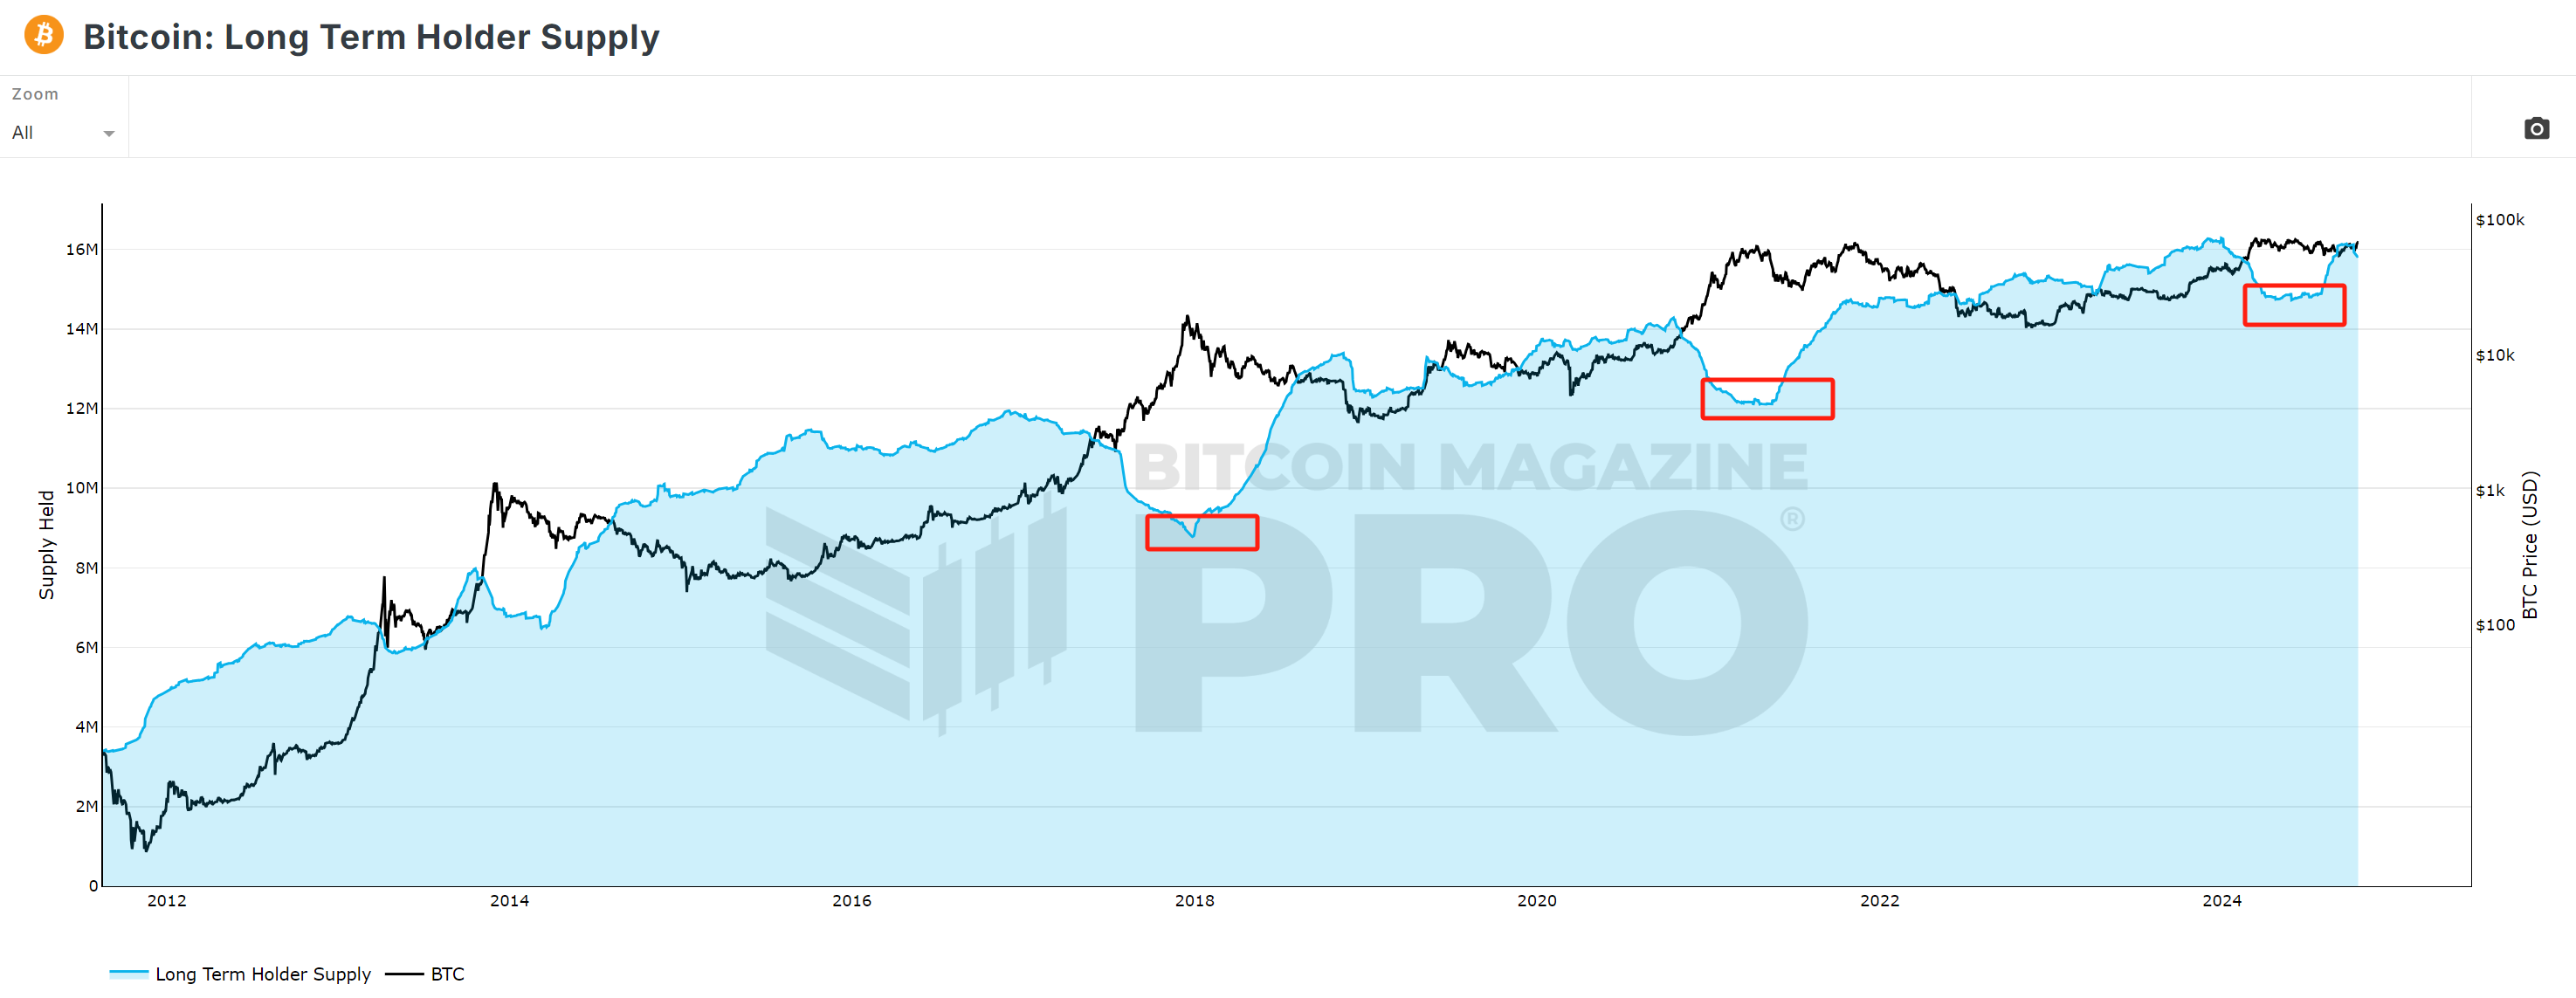
The chart shows that whenever BTC price reaches a top, the number of addresses of long-term holders decreases. This is because smart money always chooses to take profits when the price reaches its peak. After the decline, they start accumulating BTC again, and when the price rises to a high point, they sell again, repeating the cycle.
The chart shows that this group of long-term holders started buying again in late July this year, and the right side of the line chart appears quite steep. Clearly, this smart money is optimistic about the future market outlook.
It is worth mentioning that according to CryptoQuant data, new whale addresses are hoarding BTC at an almost crazy pace. The founder Ki Young Ju said that the BTC market has never seen such hoarding behavior. Some believe that the new whales are mainly due to ETF inflows, but their recent hoarding behavior shows that these new whale addresses have little to do with ETFs.
Bitcoin Open Interest Reaches All-Time High
Today, according to Coinglass data, the total Bitcoin open interest has risen to over $39.7 billion, setting a new all-time high.
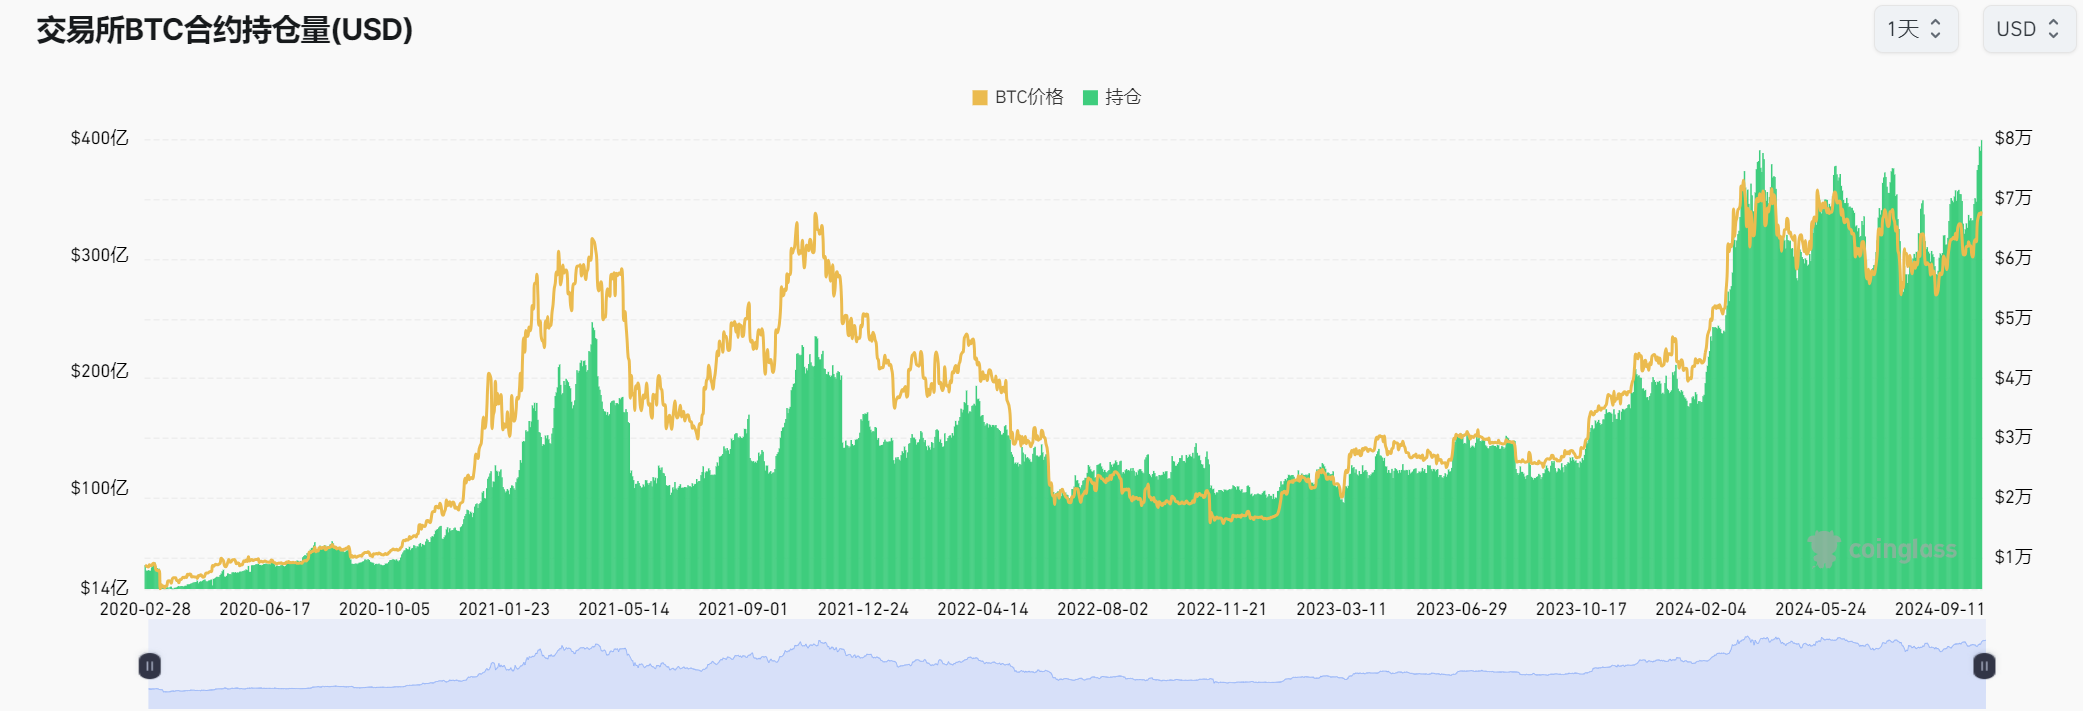
Contract data often represents the market's view on the future trend. It often lags behind the performance of the Bitcoin spot price. As the market becomes extremely bullish on the short-term outlook, it is also easy to see a correction, washing out positions and leverage.
It is worth noting that over the past half year, Bitcoin's open interest has remained at a relatively high level. This new all-time high data has broken the over $38 billion recorded at the beginning of the year for the first time. Market optimism has clearly risen.
Summary
On the macro front, the Federal Reserve will cut interest rates further in November and December, and some global liquidity will continue to flow into risk assets, providing more liquidity to the crypto market. Meanwhile, a series of on-chain data shows that the market is warming up and capital is flowing in.
"The market is always born in despair, grows in half-belief, matures in aspiration, and breaks in hope."
Perhaps, after nearly half a year of waiting, the next bull market in the crypto market is ready to take off.


