

Original Author: @calilyliu
Original Compilation: zhouzhou, BlockBeats
Editor's Note: This article reveals the EVM bias in the a16z report, ignoring Solana's outstanding performance in transaction fees, Non-Fungible Tokens, and the DeFi market. Although Solana has ranked among the top in Non-Fungible Token addresses and transaction volume over the past year, the report failed to mention the significant innovations of DePIN, such as Helium and Hivemapper. These groundbreaking projects demonstrate the real-world applications of decentralized networks, especially the thriving ecosystem of Solana, which is full of promise for the future.
The following is the original content (edited for better readability):
I read the a16z "State of Crypto" report and gained a lot of insights! Although I mainly focus on areas outside of the EVM, I always cherish the opportunity to learn about other innovations in the self-custody space. However, I noticed a certain implicit EVM bias in the report. Here are some of my observations:
Related Reading: a16z Annual Crypto Report
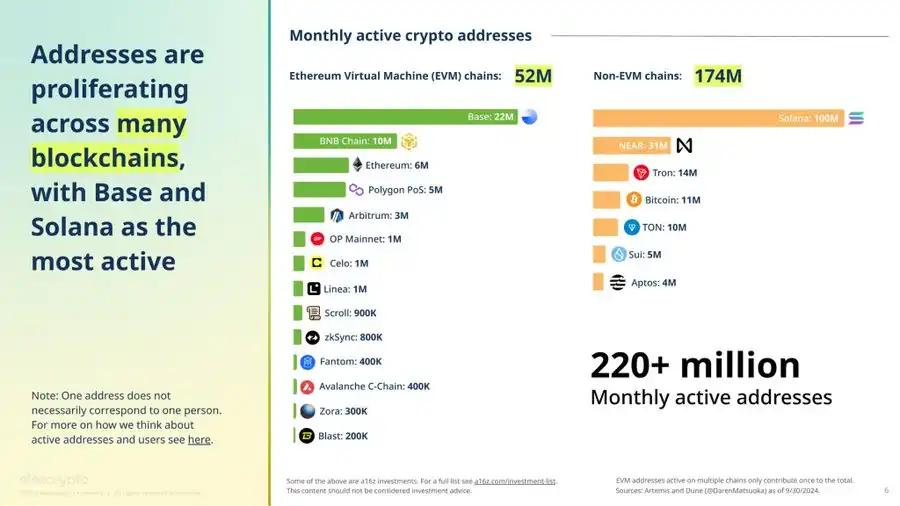
The author frames the world as a dichotomy between EVM and non-EVM, creating a binary opposition that views ecosystems and developers who do not choose to build within the EVM as the "other." For example, the visualization of active addresses is misleading. Solana reaches 100 million monthly active addresses, surpassing Base's 22 million, yet the chart almost equates the two. A more accurate approach would be to use a single bar chart, differentiating the EVM and non-EVM bars with different colors (if necessary). Additionally, the slide claims that "Base and Solana" have the highest monthly active addresses, but a careful reader will notice that NEARProtocol has 31 million active addresses, surpassing Base. Therefore, the title should be changed to "...Solana and Near are the most active."
Now let's discuss the choice of metrics. Our industry typically uses active addresses and Total Value Locked (TVL) as standard benchmarks for ecosystem health. However, I suggest measuring the activity, demand, and overall well-being of ecosystems in a more meaningful way: transaction fees. Transaction fees directly reflect the level of user participation in valuable economic activities, their willingness to pay for execution, and the profitability of validators.
With Solana's introduction of a fee market, we can now differentiate the economic value of different types of activities within an ecosystem and apply this approach to other ecosystems.
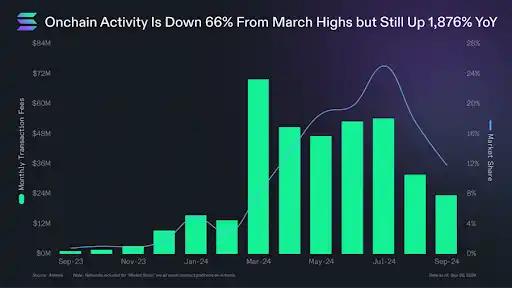
In terms of transaction fees, Solana has made significant progress. Prior to December 2023, Solana's monthly transaction fee market share never exceeded 1.5%. Since April 2024, this ratio has consistently remained above 10% and reached a peak of 25% in July. When we consider MEV tips to measure "Real Economic Value" (REV), Solana is closing the gap! The chart from blockworksres highlights the narrowing gap in REV between Solana and Ethereum.
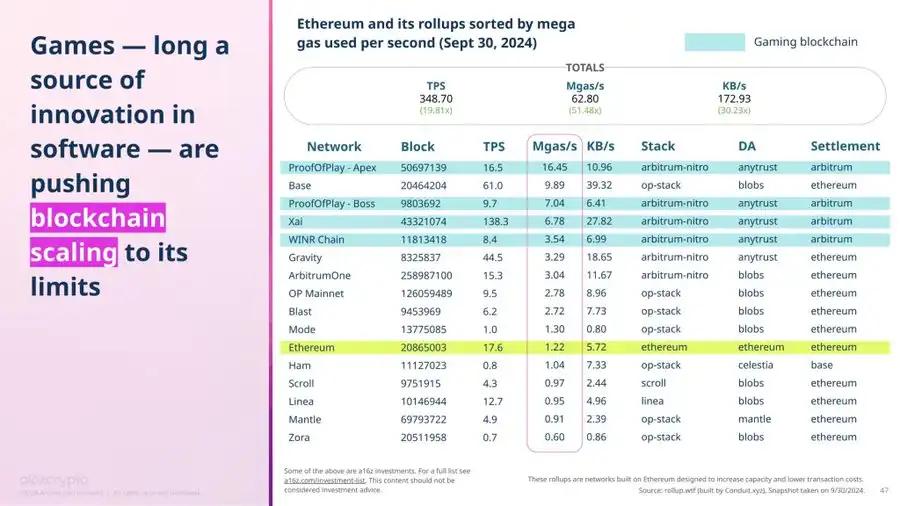
This is another EVM-centric perspective, this time related to the gaming domain. Using mgas/s as a metric to evaluate gaming infrastructure excludes Solana and other non-EVM networks, leading to meaningless comparisons and limiting our view to only a portion of the blockchain gaming ecosystem.
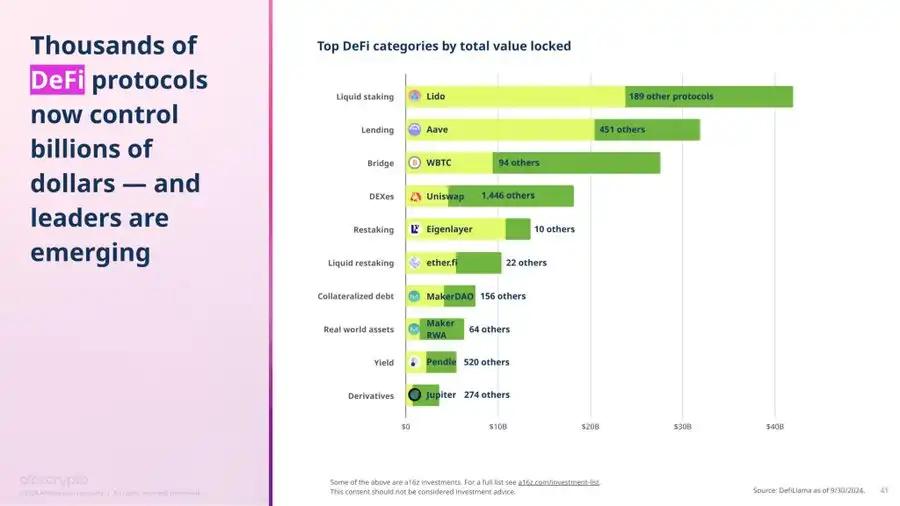
Another example related to DeFi, where TVL as a metric for comparing DeFi activity is insufficient, especially in key categories such as DEXes, derivatives, and bridges, where trading volume is more relevant. While the report highlights overall DEX trading volume, it only provides a protocol breakdown based on TVL, ignoring critical aspects of liquidity activity.
TVL often favors ecosystems with large asset reserves but limited liquidity, such as Ethereum. Although Solana's TVL is only 10% of Ethereum's, its monthly DEX trading volume fluctuates between 50% to occasionally exceeding Ethereum's. To accurately reflect on-chain economic activity, the focus should be on the economic value of transactions, not just the value held. In this context, ecosystems with higher capital efficiency and superior on-chain performance stand out.
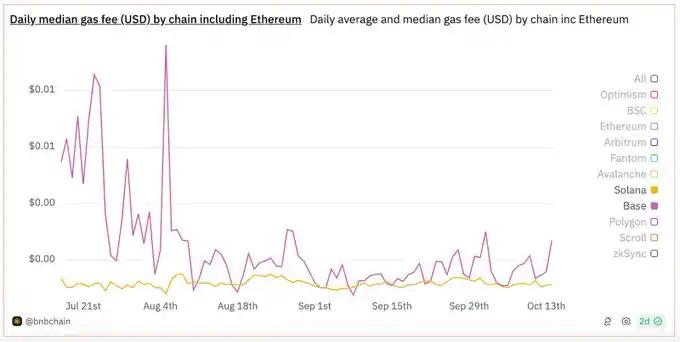
Among the comparable metrics across ecosystems, the report still primarily focuses on Ethereum and EVM L2s. It views the implementation of EIP-4844 as a significant milestone in industry-wide fee reduction. However, it is worth noting that since its launch in March 2020, Solana has also maintained relatively low transaction costs. Furthermore, in terms of transaction affordability, Solana's median fees have consistently been lower and more stable than Base.
Although according to nftpulseorg data, Solana ranked first in Non-Fungible Token addresses, second in transaction volume, and fourth in unique collections over the past year, Solana is once again excluded from this Non-Fungible Token comparison.
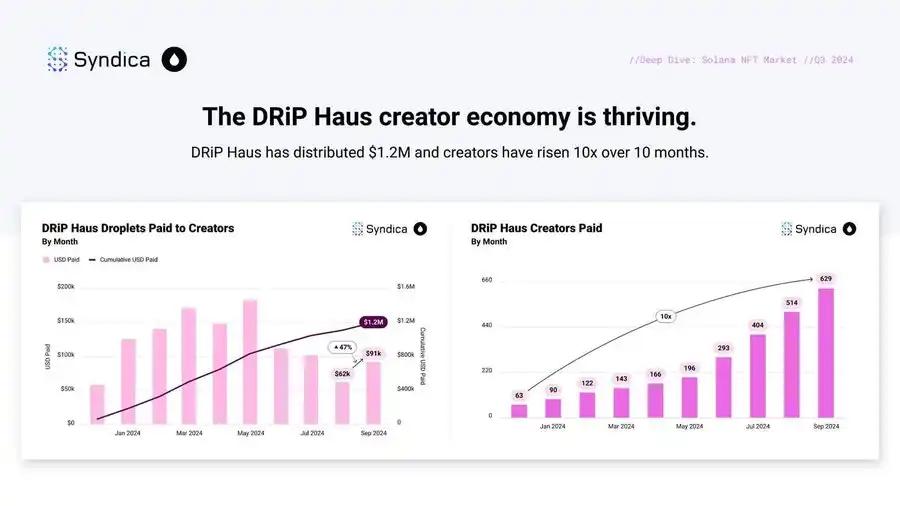
The slide mentions that low transaction costs drive new consumer behaviors, which can be well illustrated by the example of drip haus. Since March 2023, the platform has achieved 182 million Non-Fungible Token mints at a total cost of only 1,600 SOL (at a SOL price of $150, each Non-Fungible Token costs only $0.001), as pointed out by ledger top.
The absence of DePIN is very apparent, as Helium is revolutionizing cellular networks, currently with over 1 million active hotspots in 182 countries. Hivemapper is using decentralized networks to map the global landscape, recording over 7.5 million kilometers of street data in more than 50 countries. Render Network provides decentralized GPU rendering services, offering critical computing capabilities for industries like gaming and artificial intelligence. This is an upgraded version of SETI@home, demonstrating real-world application value.
More importantly, these innovations are predominantly happening in the Solana ecosystem rather than the EVM ecosystem. Could this be the reason why the report did not mention DePIN at all?


