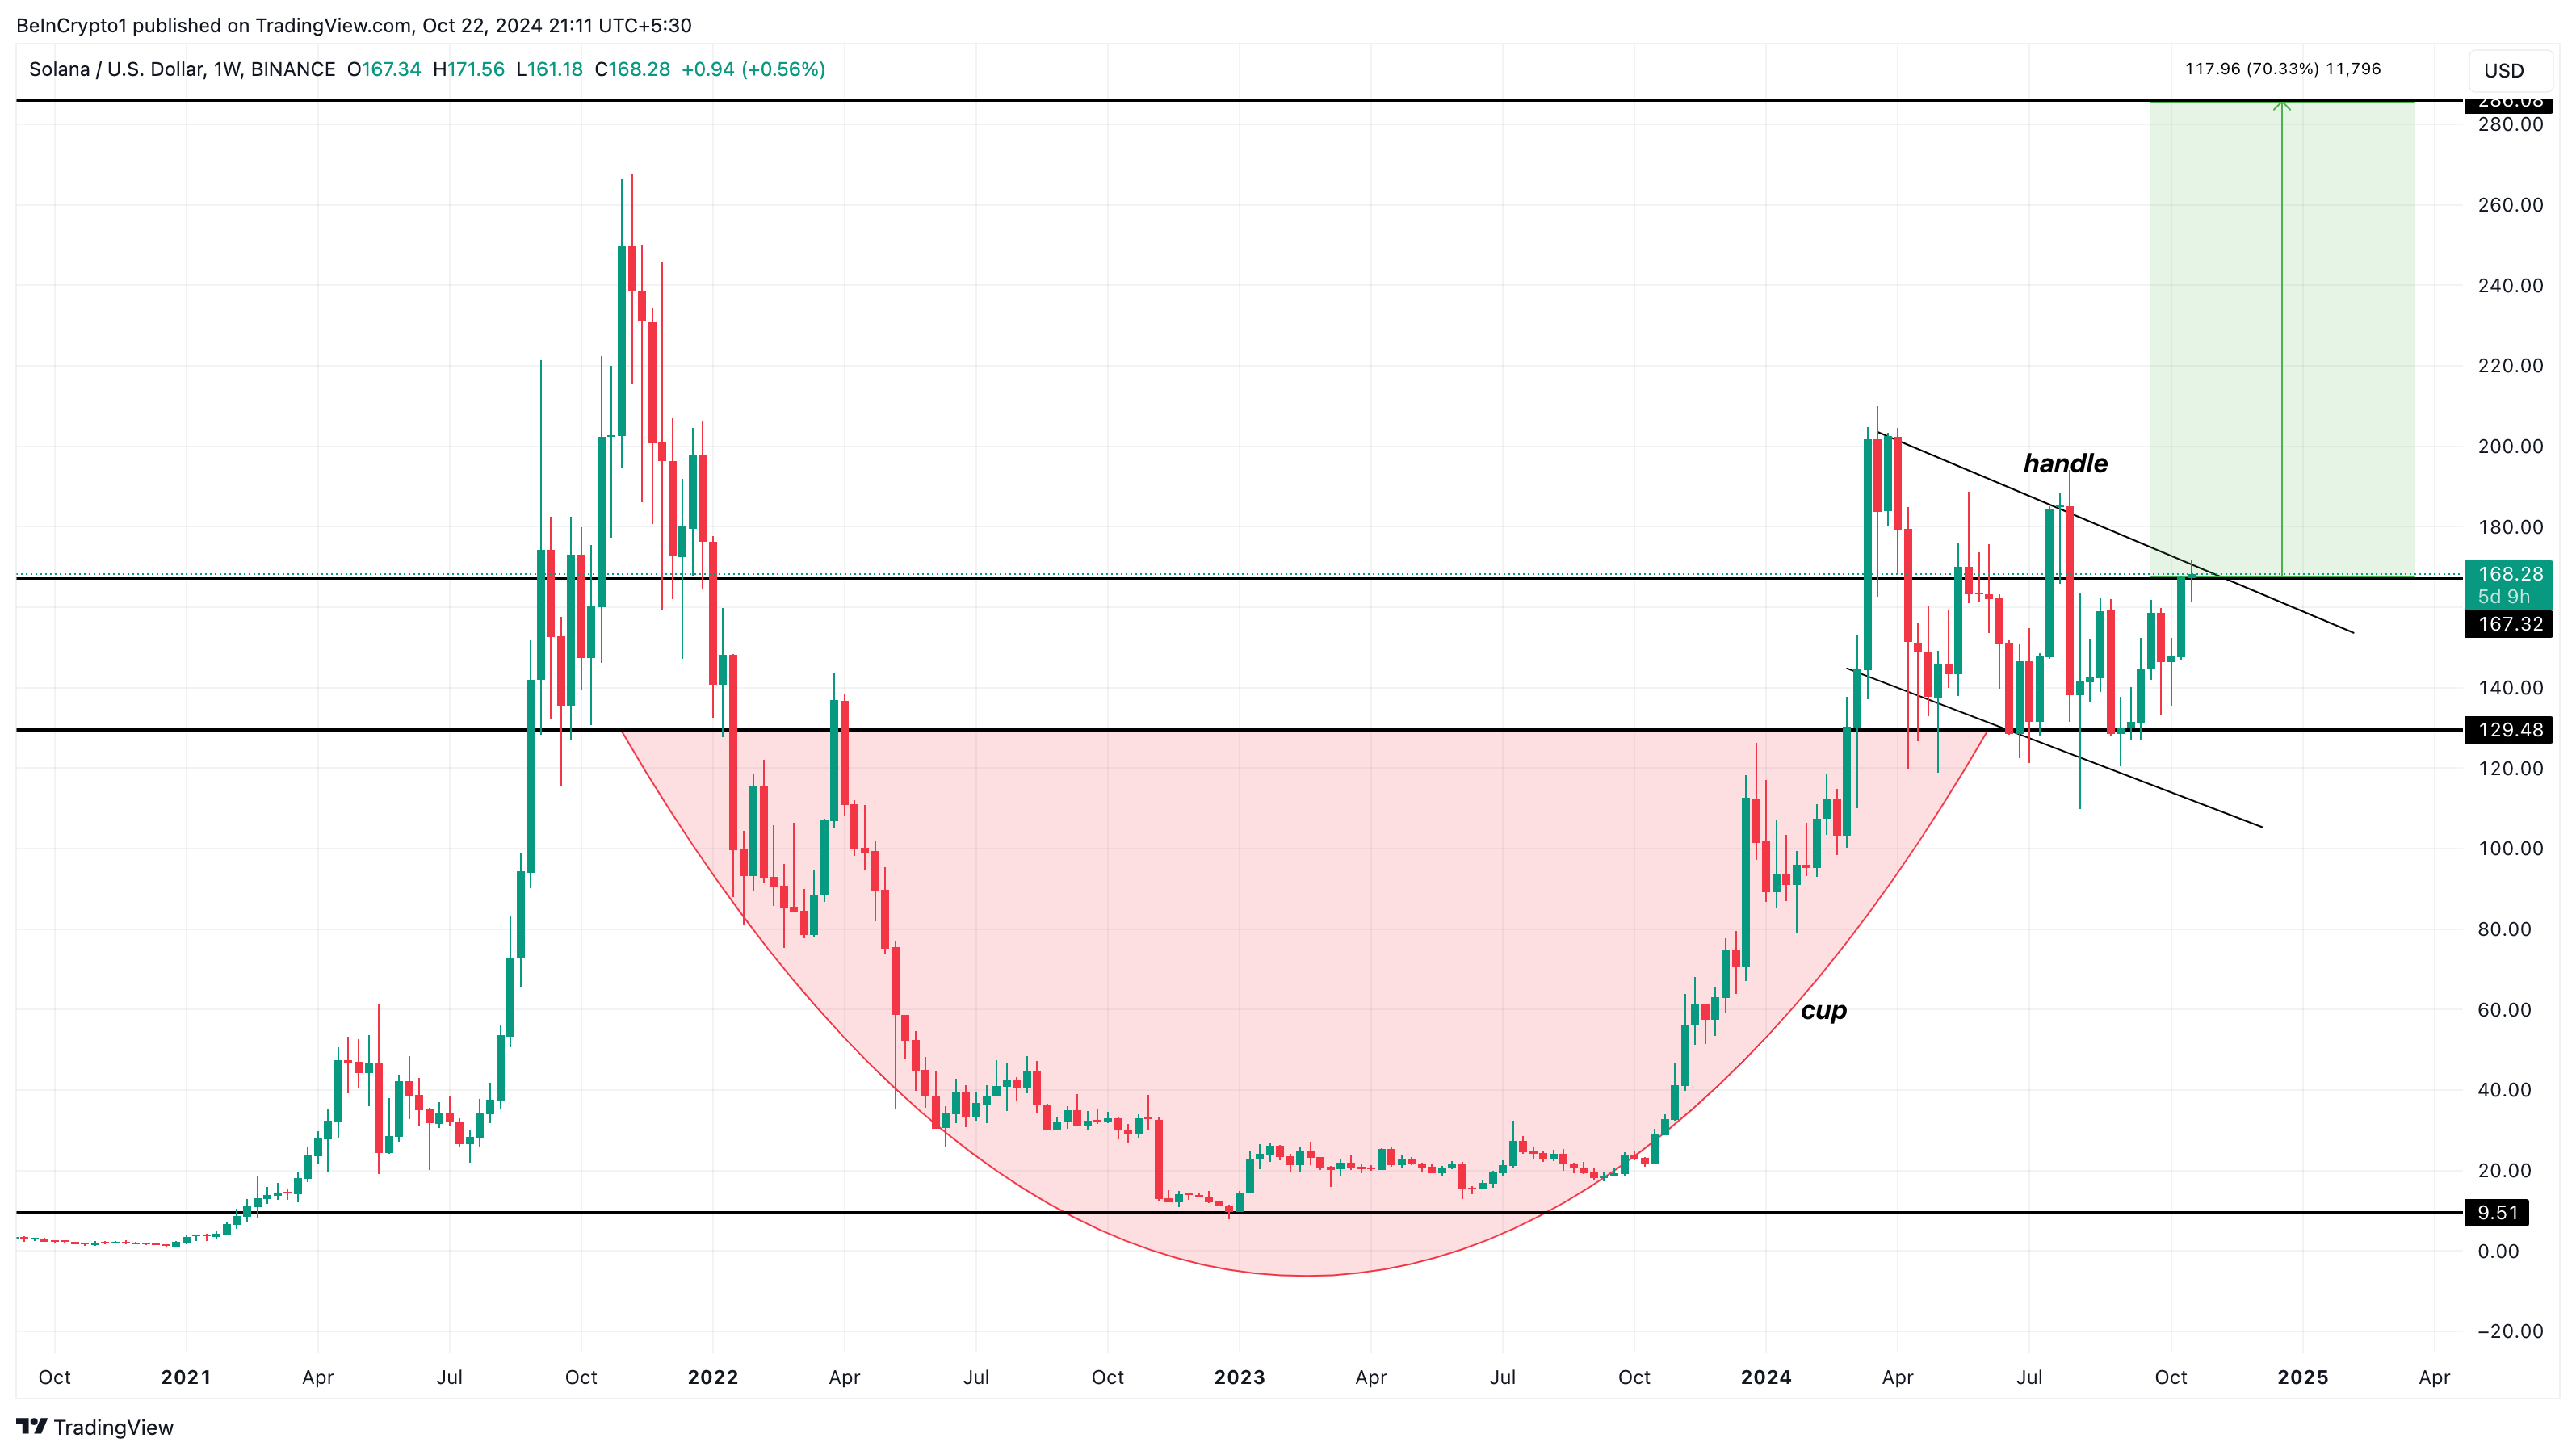
The price chart of Solana (SOL) shows that this altcoin has the potential to rise by 70%. In August, the price of Solana fell to $130.
Today, the price has risen to $168, indicating that a potential breakout may already be underway. This analysis explains how SOL can rise above its current level before the end of this year.
Solana forming an upward pattern on the weekly chart
According to the weekly chart, SOL has formed a cup and handle pattern. This shape appears when the price experiences a U-shaped recovery, followed by an adjustment phase that looks like a 'handle'.
From March, the price of SOL has been oscillating between $127 and $201, reflecting uncertainty about which direction the handle will choose. However, for the pattern to be valid, it must break out above the key neckline.
If this breakout occurs, the price can rise by the maximum distance between the cup's lowest point and the neckline. In the case of SOL, the token has broken through the neckline at $167. Therefore, the value of the altcoin can rise by 70% to reach $285.
Read more: 7 Best Platforms to Buy Solana (SOL) in 2024
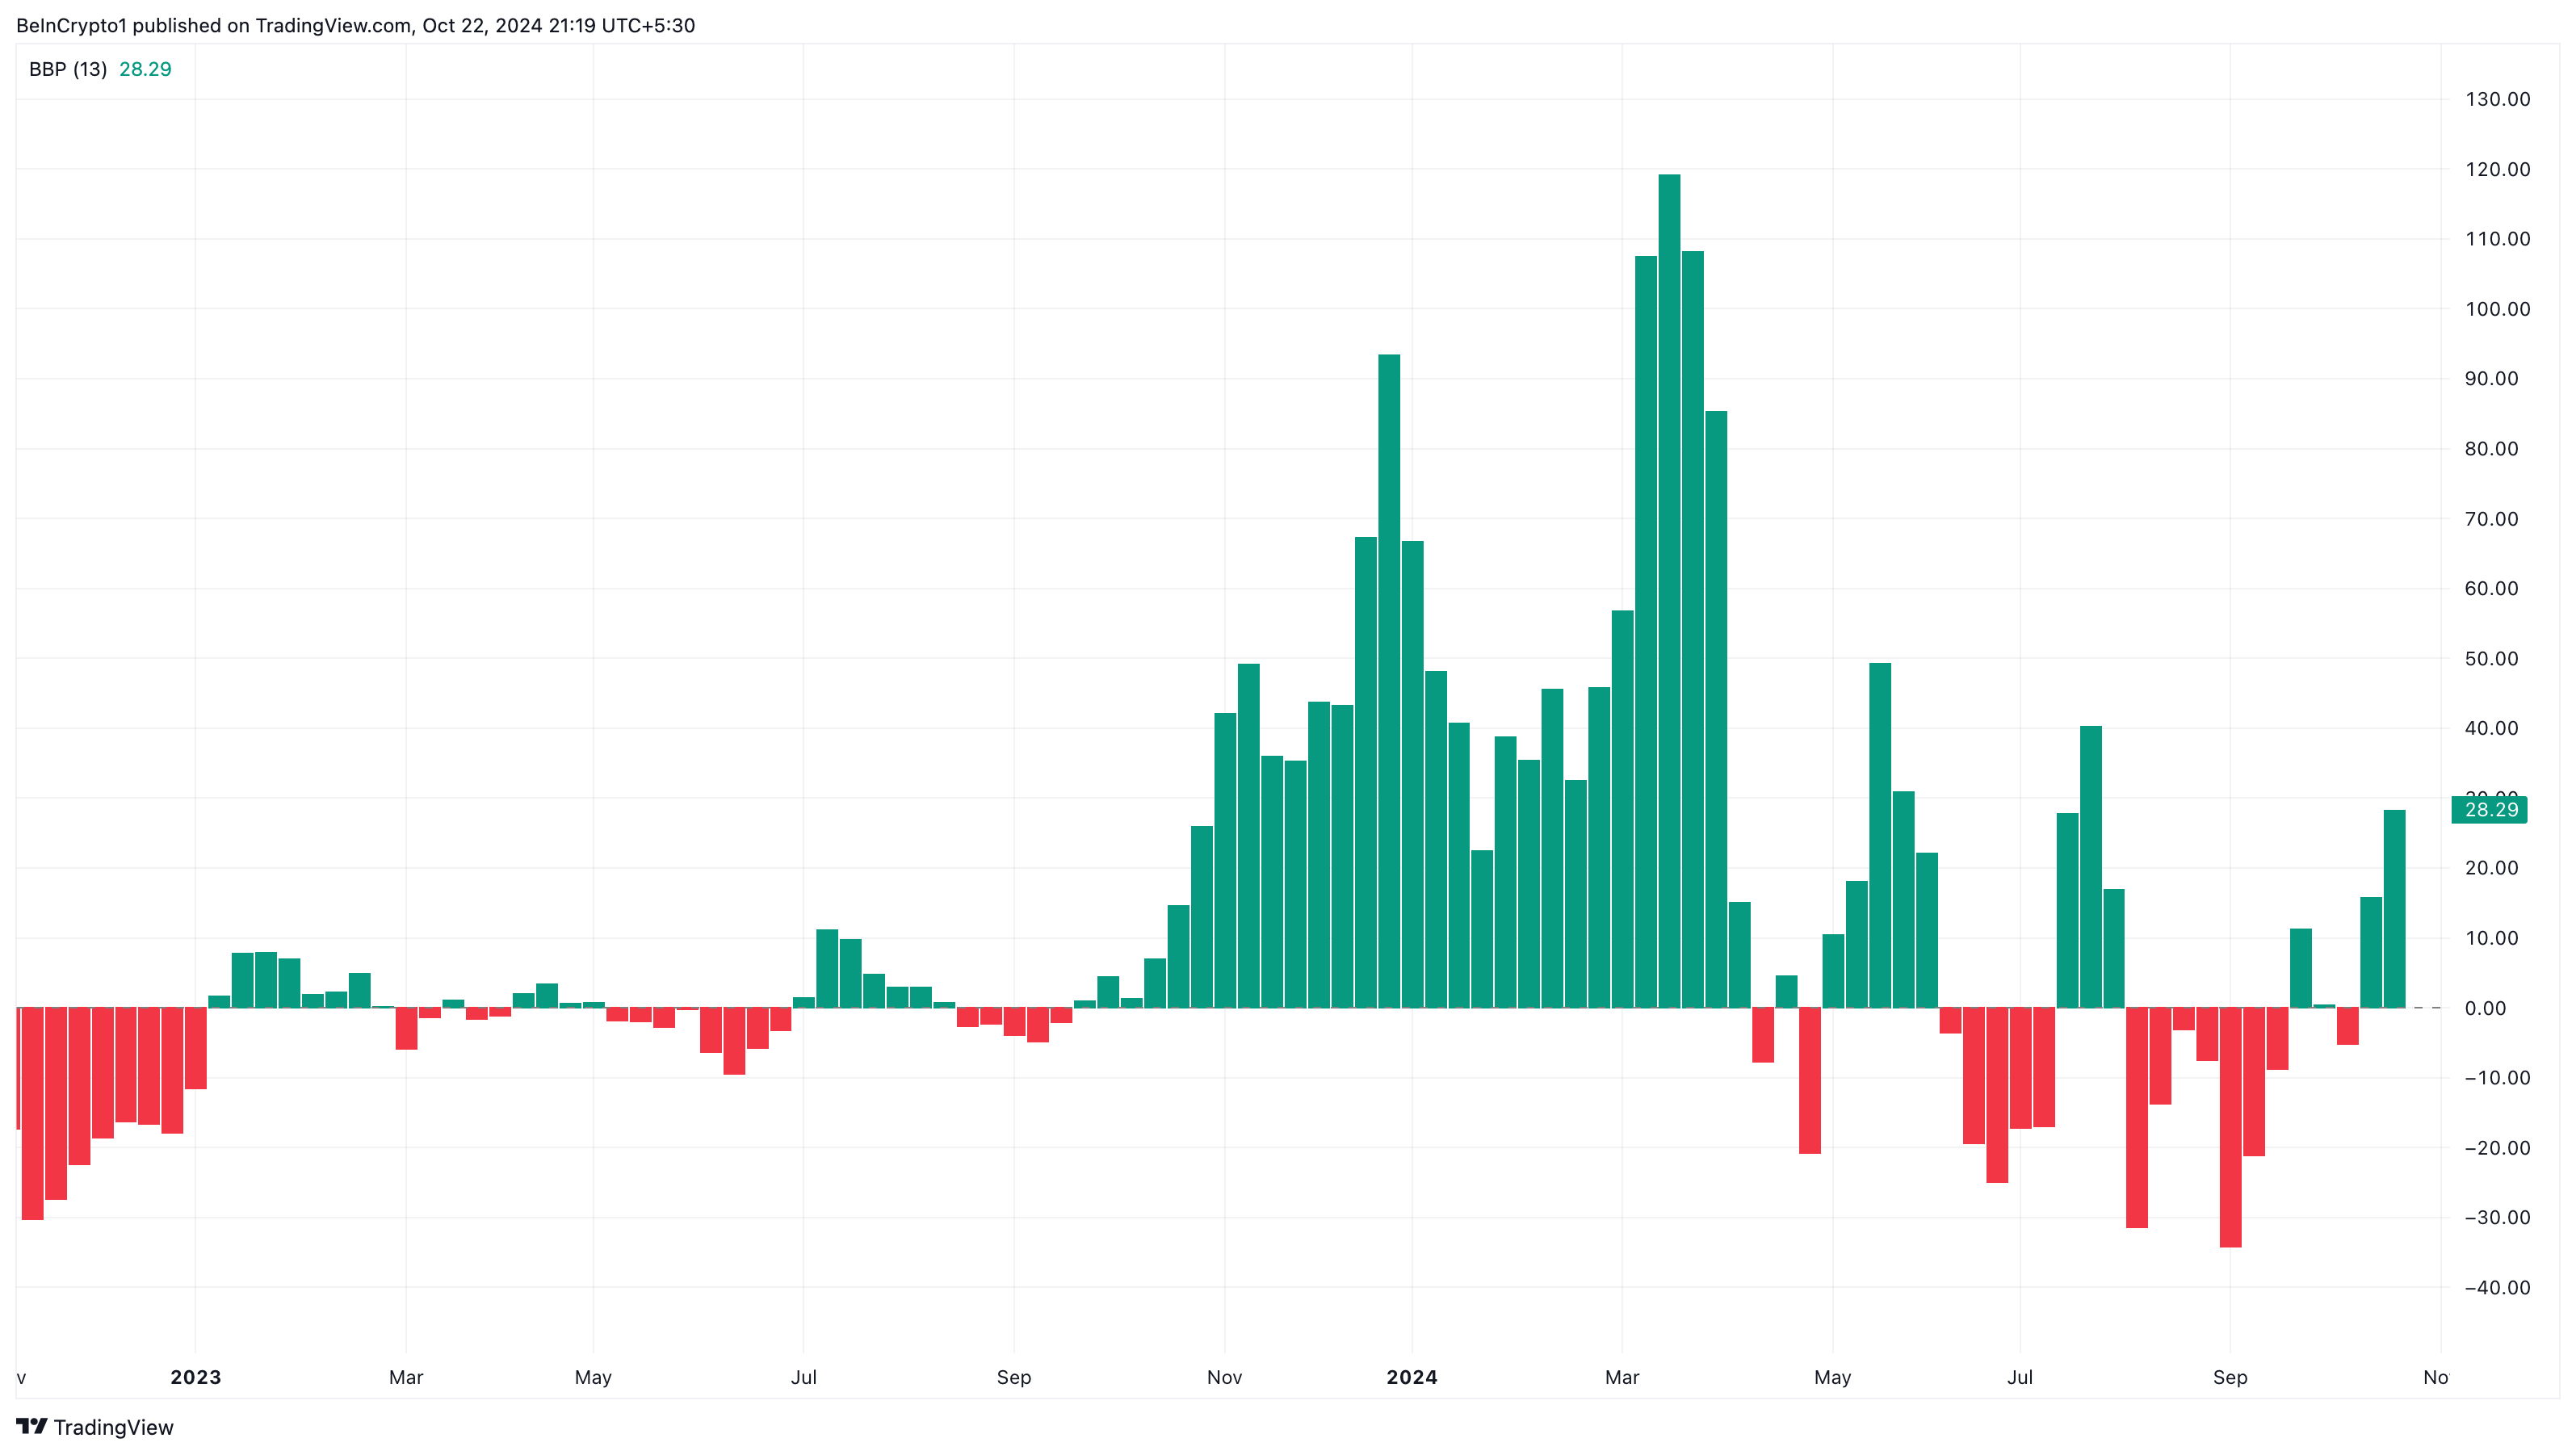
Additionally, the Bull Bear Power (BBP) on the chart shows that the Bulls are in control, and the prediction can be realized. BBP shows whether the buying power is stronger than the Bears or if the Bears are dominant.
Generally, a negative reading indicates that the Bears have a greater impact on the cryptocurrency price. On the other hand, a positive reading suggests that the Bulls can drive the price higher.
Another factor that can positively impact the price of Solana is the increasing institutional adoption of the altcoin. Recently, the asset management company VanEck included Staking rewards for the Solana Exchange Traded Note (ETN) in Europe.
This move suggests that Solana can receive significant attention from institutions, following the notable adoption of Bitcoin (BTC) and Ethereum (ETH).
SOL Price Prediction: Potential Upside to $176
From a short-term perspective, the price of Solana has rebounded above the $155 support level. If it had fallen below this point, a notable correction in the cryptocurrency could have occurred, but since it did not, SOL can move higher.
The Fibonacci retracement also appears to support this move. Based on the Solana price chart below, if buying pressure increases, the altcoin can jump to the 78.6% Fibonacci retracement level. In that scenario, the token can reach $176.07, which could signal further upside to $194.08.
Read more: Solana (SOL) Price Prediction 2024/2025/2030
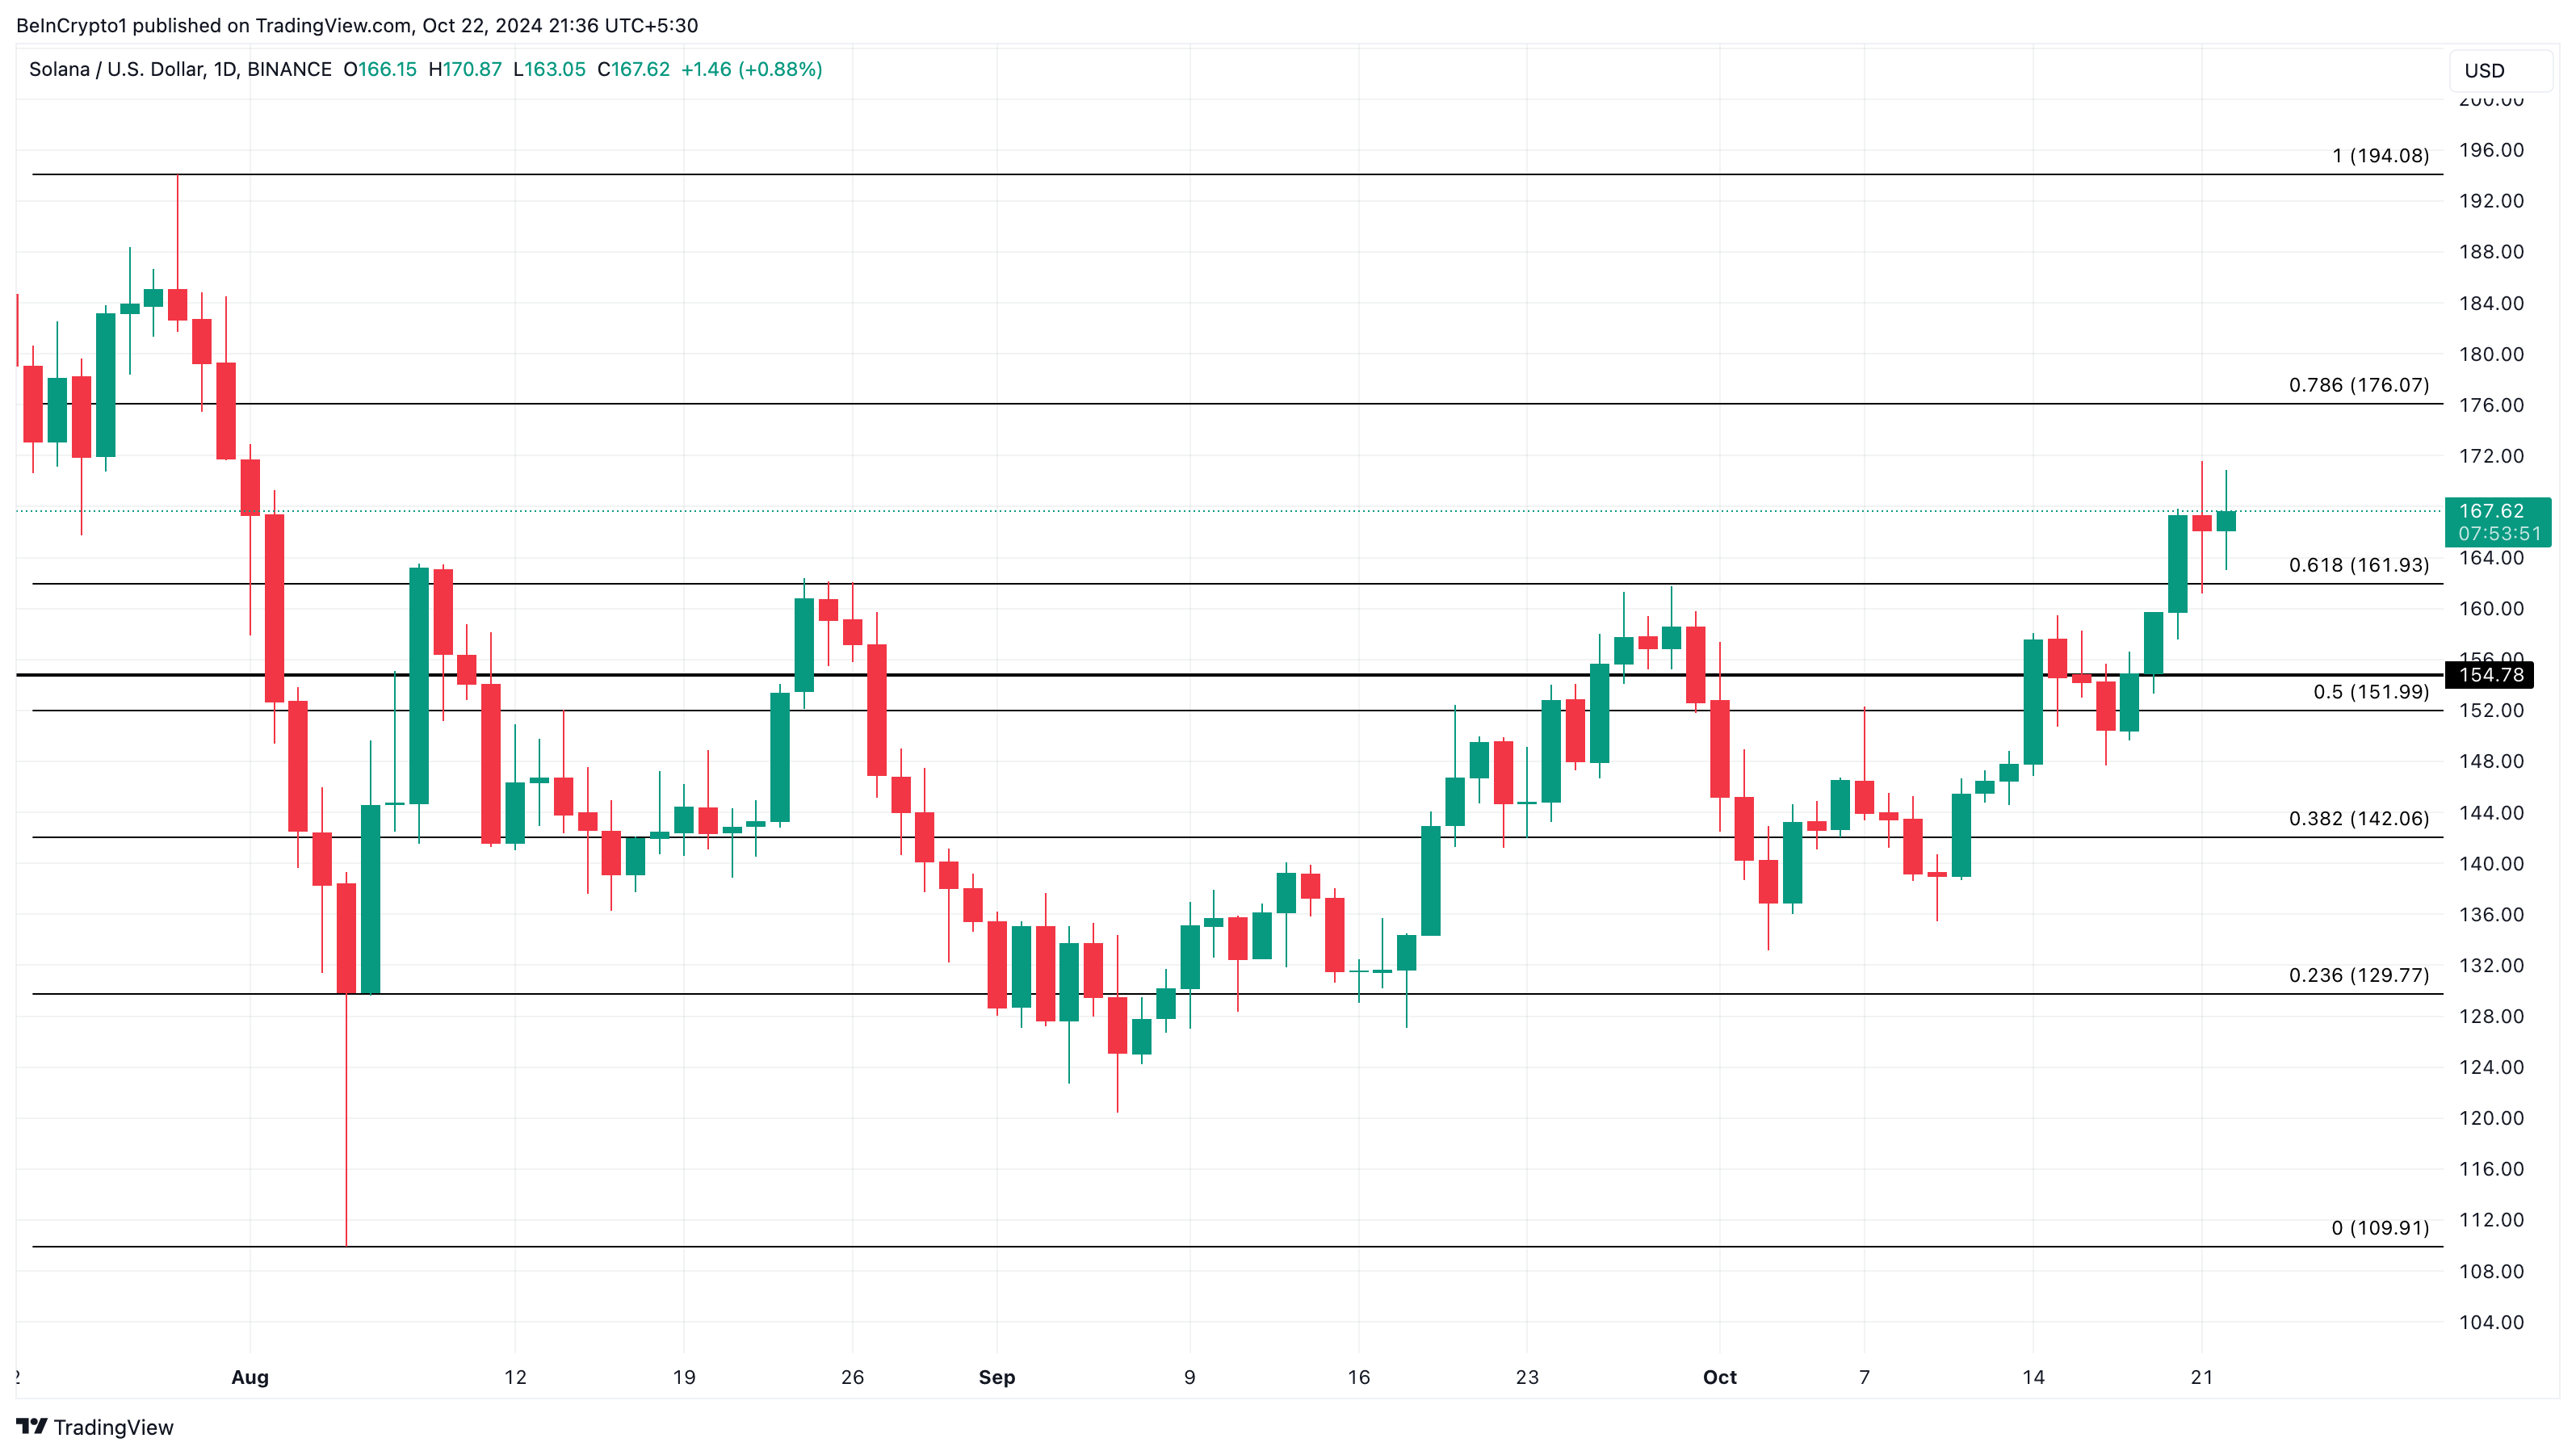
However, if the price falls below the 61.8% Fibonacci level, the prediction may not materialize. Instead, SOL could decline to $142.06.


