Ethereum [ETH] has once again attracted attention, with a net outflow of over 25 million per day, leading all other blockchains in terms of capital flow. Such a large-scale shift may indicate that major investors are taking profits or repositioning their strategies.
As of the time of writing, the trading price of ETH is $2,628.40, up 0.61%, a trend that raises the question: Will this outflow of funds consolidate liquidity and drive a new bullish wave? Let's analyze the technical and market indicators behind the current price dynamics of Ethereum.
Join the discussion group → → VX: ZLH1156
ETH Price Analysis: Is a Breakout Imminent?
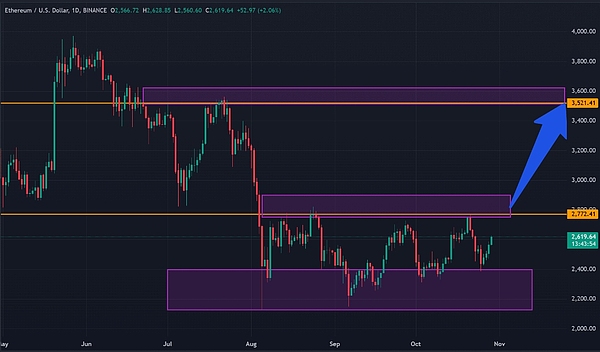
Ethereum's recent price action suggests that a breakout may be in the works. Despite market volatility, ETH has maintained a strong position above $2,500, a key psychological support level.
This level has proven to be resilient and may serve as a launchpad for a stronger upward push.
Looking ahead, $2,772 is a direct resistance level, while $3,521.41 represents a more significant hurdle that can confirm or halt the bullish momentum.
If Ethereum successfully breaks through these levels, we may see a significant rebound. However, if the resistance levels hold firm, ETH may enter a consolidation phase, awaiting a decisive catalyst.

MACD and RSI Indicate Strengthening Momentum
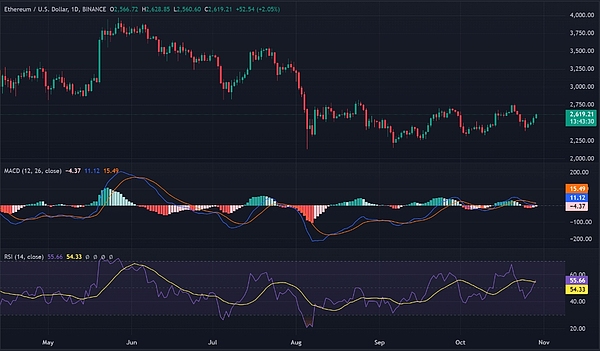
Ethereum's technical indicators further highlight its upside potential. The Moving Average Convergence Divergence (MACD) indicator is showing bullish signs, as the MACD line has crossed above the signal line, which is often seen as a precursor to positive price action.
Additionally, the Relative Strength Index (RSI) is currently around 54.33, indicating a moderately bullish level.
Therefore, Ethereum still has considerable upside room before approaching overbought territory, suggesting that buyers may continue to push the price higher in the short term.

Exchange Outflows: A Sign of Bullish Sentiment?
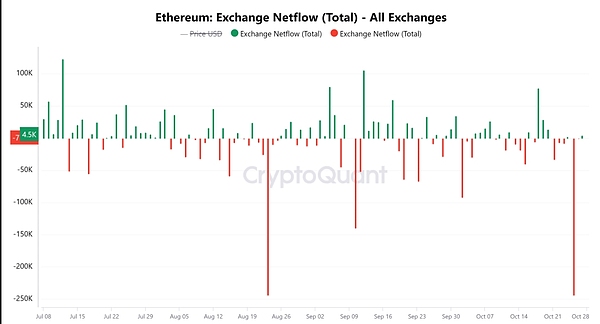
Ethereum's exchange net flow data shows a massive outflow of 4.5K ETH over the past 24 hours, indicating a 3.03% decrease in available exchange liquidity.
When large amounts of ETH are withdrawn from exchanges, it typically suggests that investors are choosing to hold their assets long-term or deploy them elsewhere, relieving immediate selling pressure.

ETH Liquidation Data Highlights the Dominance of Long Positions
Ethereum's liquidation data supports the bullish outlook. The majority of liquidations are short positions, while long positions are in the dominant position. This trend suggests that traders are confident in Ethereum's upside potential, as long-holders expect Ethereum to continue its upward trajectory.
This confidence in long positions may further increase the upward pressure, providing the necessary support for a sustained rally.

The massive outflow of funds from Ethereum exchanges, coupled with its supportive technical indicators, suggests a potential bullish trend.
Breaking through key resistance levels could be the ultimate catalyst for a strong rebound. With liquidity consolidation, Ethereum appears poised for a significant upswing, making the coming days crucial for ETH's price performance.
That's the end of the article. Follow the public account: Web3 Tangy for more great articles~
If you want to learn more about the crypto world and get the latest news, feel free to consult me. We have the most professional community, where we publish daily market analysis and recommend high-potential coins. There is no threshold to join the group, welcome everyone to join the discussion!
Join the discussion group → → VX: ZLH1156


