
Source: Talk Li Talk Outside
Remember in an article in December 2022, we had helped everyone sort out 10 Bitcoin indicators, and believed that at that time we had entered the late stage of the then bear market, and it was also a relatively good time to start investing. As shown in the figure below.

Unknowingly, 2 years have passed, and we have finally waited for the long-awaited new round of bull market.
Although it is said that the bear market does not speak of the bottom, and the bull market does not speak of the top, many people seem to like to try to find some answers to this question. So in the spirit of research, in this issue we will simply share 15 Bitcoin top exit reference indicators.
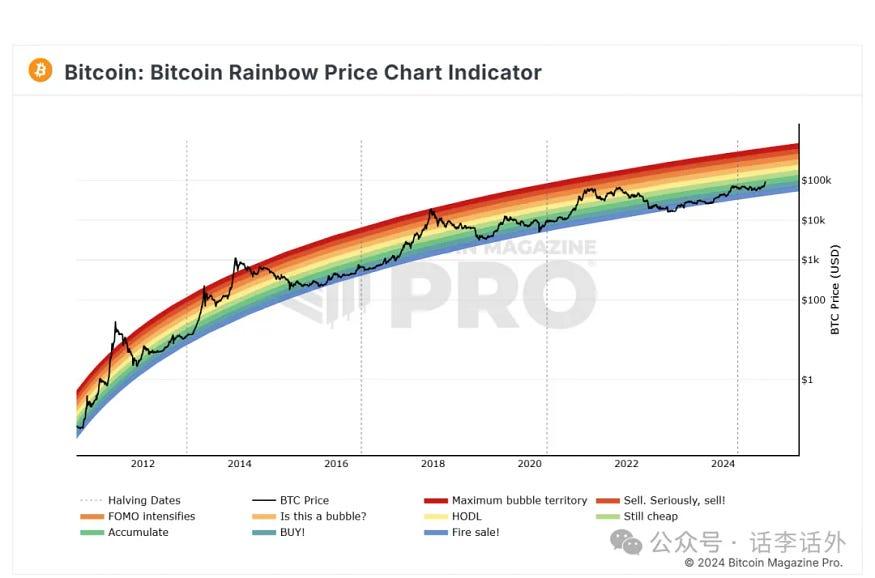
Indicator 1: Rainbow Price Chart Indicator
As a long-term value valuation tool for Bitcoin, the Rainbow Chart indicator should be quite familiar to everyone, at least you should have heard of it. This indicator uses a logarithmic growth curve to predict the potential future price direction of Bitcoin, it overlays the rainbow color band on the top of the logarithmic growth curve channel to highlight the market sentiment of each rainbow color stage as Bitcoin prices move. Here the suggested top exit position can be selected between the yellow and red zones. As shown in the figure below.
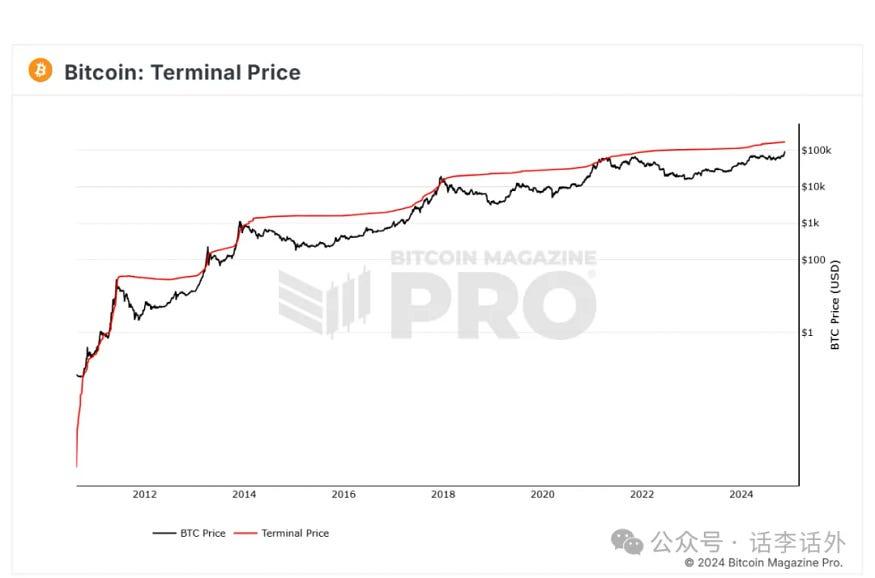
Indicator 2: Terminal Price
Historically, this indicator has been quite effective in predicting the tops of the Bitcoin price cycle, such as the Bitcoin price reaching the red line during the bull top period in November-December 2017, and the Bitcoin price reaching the red line again during the bull top period in March-May 2021. According to this indicator, as long as we wait until Bitcoin's price approaches or touches the red line again, we can sell. The current display position of the red line price is around $170,000. As shown in the figure below.
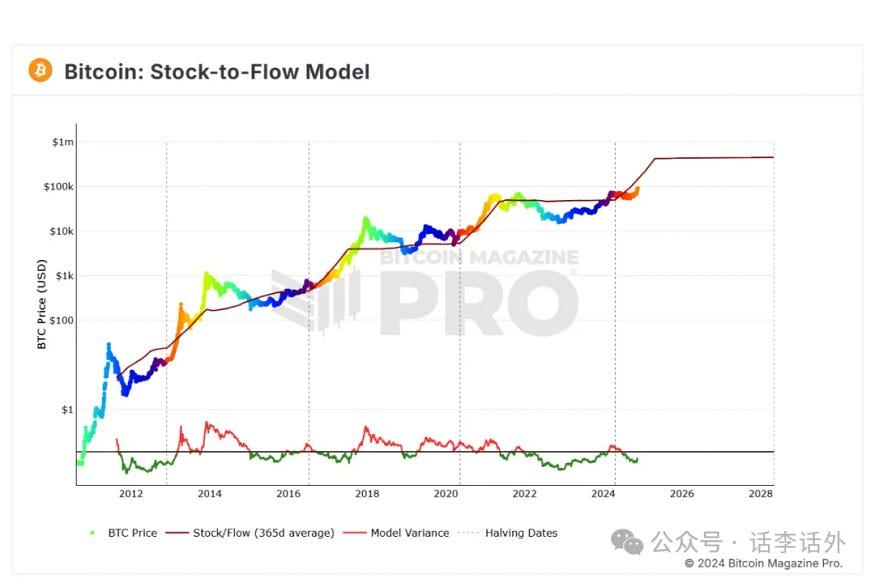
Indicator 3: Stock-to-Flow Model (S2F Model)
Over time, Bitcoin's price will change with changes in stock and flow. When the price is higher than the S2F level, the divergence line will change from green to red. When the price is lower than the S2F line, the divergence line will change from red to green. From the current trend of this indicator, the first quarter of next year (2025) seems to be a favorable time to sell. As shown in the figure below.
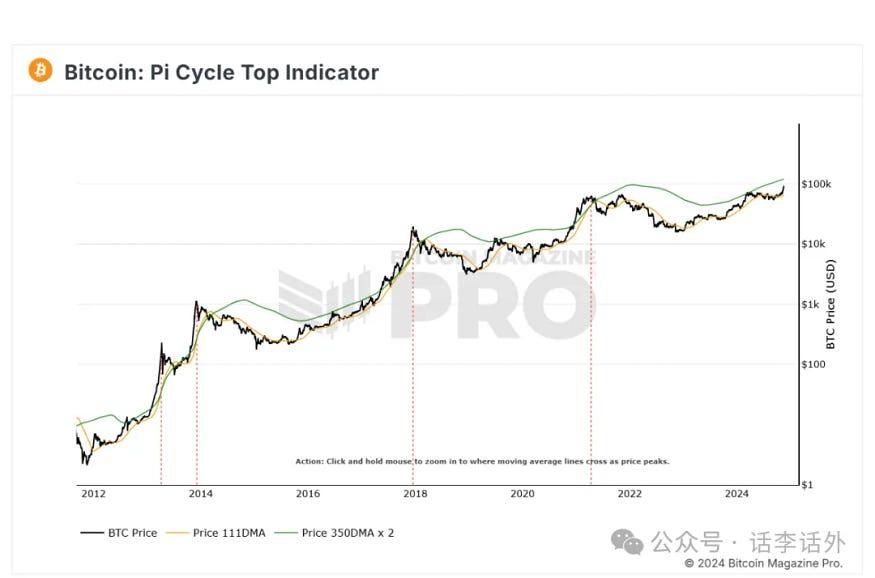
Indicator 4: Pi Cycle Top Indicator
This indicator uses 111DMA (i.e. 111-day moving average) and 350DMA x 2 (i.e. double the 350-day moving average) to identify the top of the market cycle. Historically, in the past three bull market cycles, when the 111DMA moved upward and crossed the 350DMA x 2, we saw it coincide with the price top of Bitcoin. Currently, the green line (350DMA x 2) of this indicator is $120,000, which means that the Bitcoin in this bull market may top out after breaking through $120,000. As shown in the figure below.
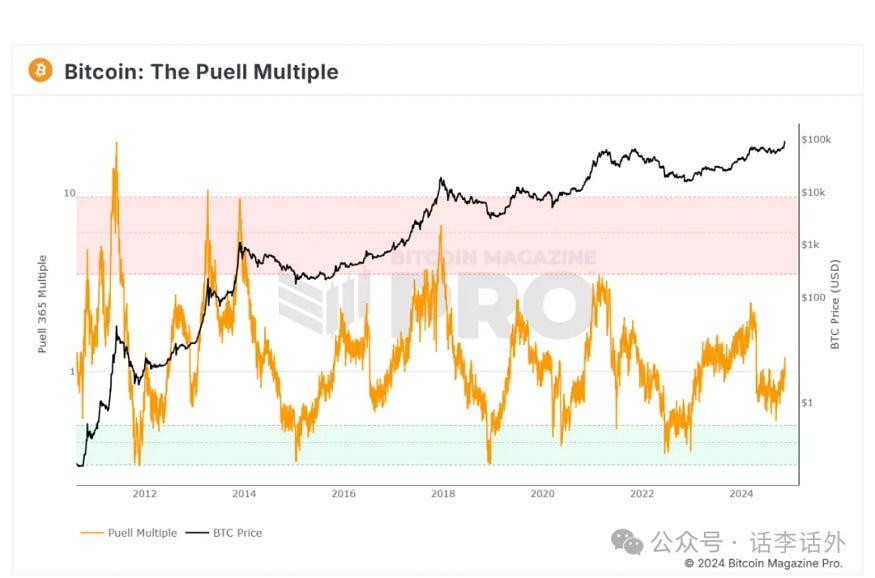
Indicator 5: The Puell Multiple
This indicator mainly highlights the two important range areas of Bitcoin, where the Puell Multiple entering the green box area indicates a period of extremely low Bitcoin value, and the Puell Multiple entering the red box area indicates a period of extremely high Bitcoin value. We need to sell when the Puell Multiple approaches or enters the red area. But combined with the current market situation, the suggestion here is that when the indicator index is above 2 again, you can consider selling in batches, and when it is above 3, you can exit the top. As shown in the figure below.
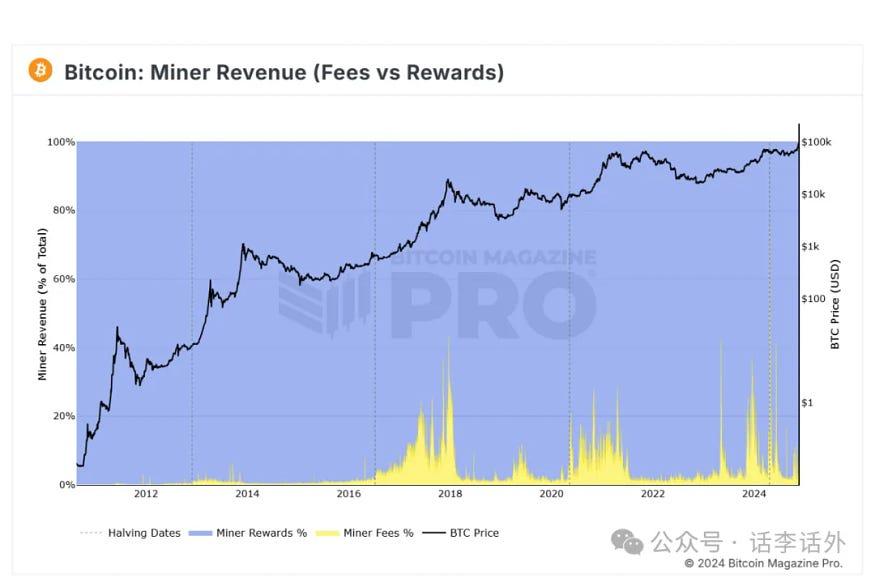
Indicator 6: Miner Revenue (Fees vs Rewards)
Historically, in previous bull markets, whenever Bitcoin prices started to top out, the percentage of Fees would rise sharply, because with the entry of more new participants in the market and more transactions generated on the network, the demand for Bitcoin naturally increases during the bull market. According to the current indicator, when the Miner Fees account for more than 30%, it can be considered to sell Bitcoin in batches. As shown in the figure below.
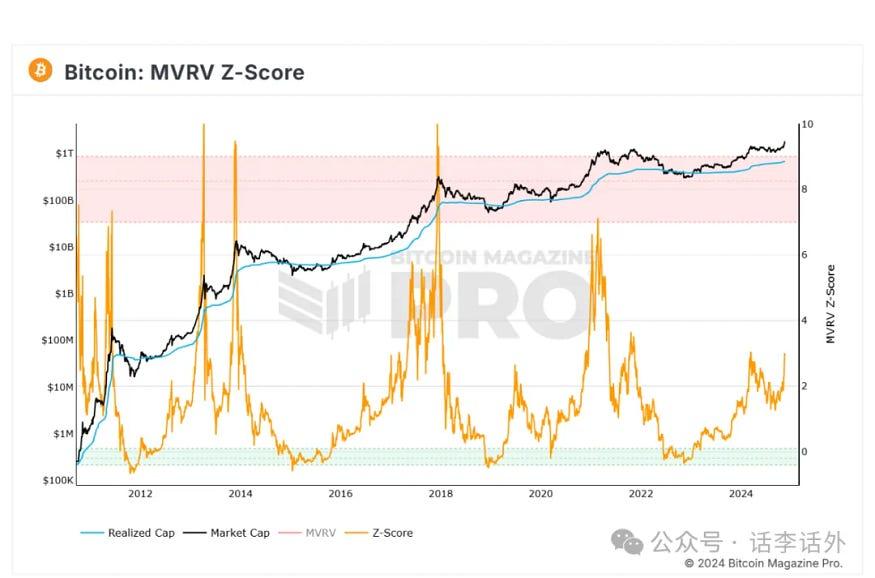
Indicator 7: MVRV Z-Score
This indicator is a metric to determine whether Bitcoin is undervalued or overvalued. Historically, since 2011, whenever the MVRV Z-score value approaches or exceeds 7, it indicates that the market is entering a peak. As shown in the figure below.
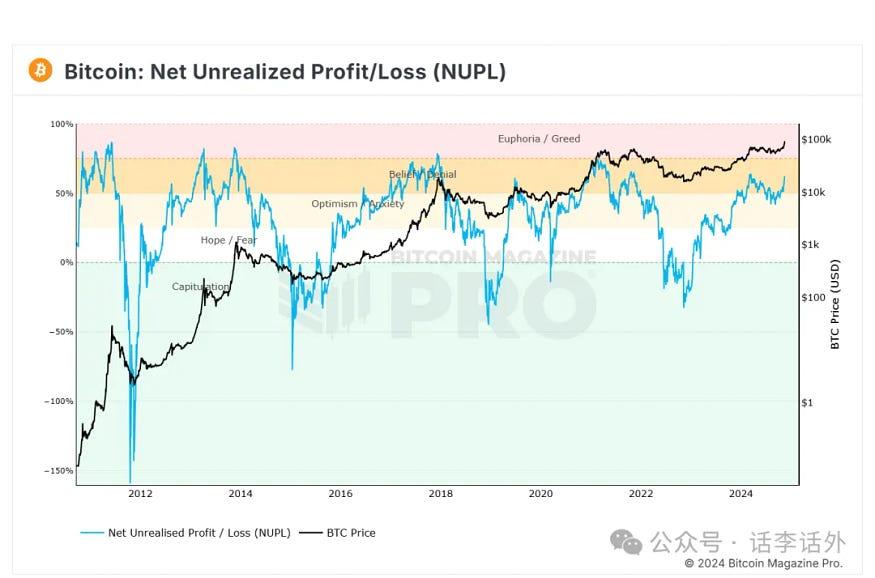
Indicator 8: Net Unrealized Profit/Loss (NUPL)
This indicator is a metric to assess the total accounting profit/loss of Bitcoin held by investors. Historically, whenever this indicator approaches or reaches 75%, it may be time for you to exit the top. As shown in the figure below.
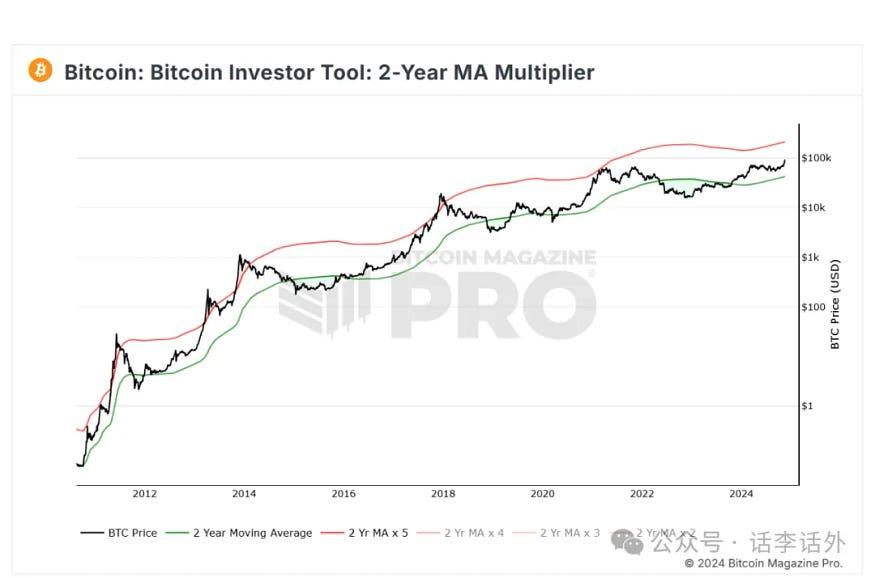
Indicator 9: 2-Year MA Multiplier
This indicator uses the 2-year MA (moving average) and its multiplier, i.e. 2-year MA x 5, to predict Bitcoin's price. Historically, when Bitcoin's price approaches or exceeds 2-year MA x 5 (i.e. the red line in the chart), it will be the best time to sell Bitcoin. As shown in the figure below.
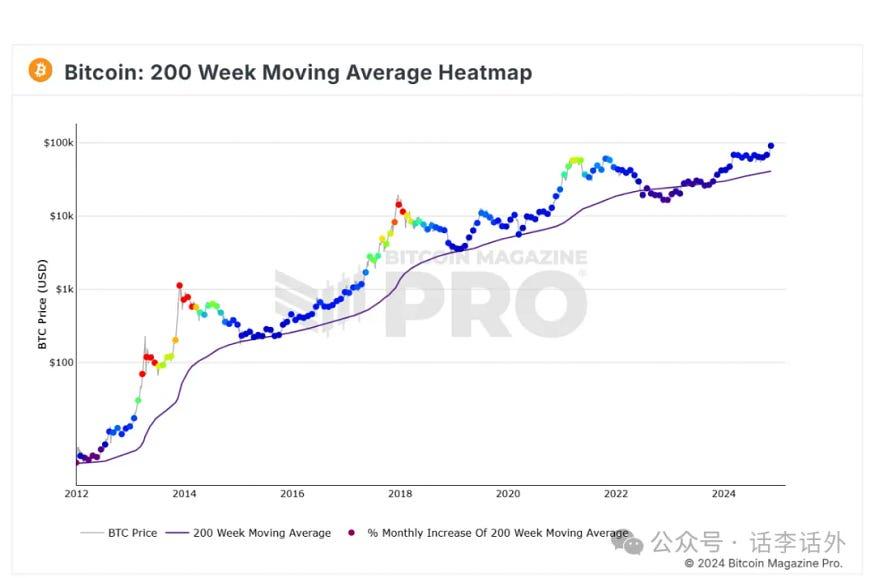
Indicator 10: 200 Week Moving Average Heatmap
This indicator uses a color heatmap based on the growth rate of the 200-week moving average, and assigns a color to the price chart based on the monthly percentage increase of the 200-week moving average. Historically, when we see orange or red dots on the price chart, it indicates that the market is overheated and it is the best time to sell Bitcoin for profit. As shown in the figure below.
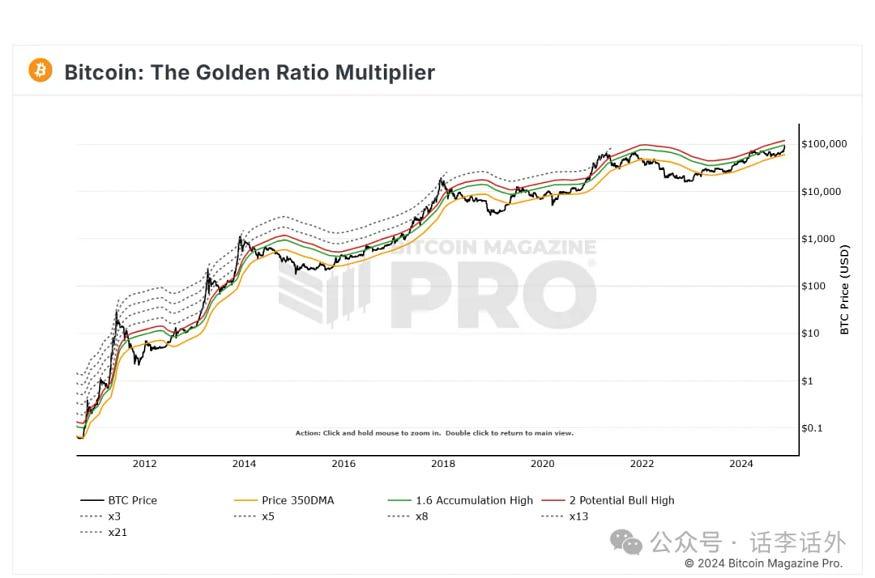
Indicator 11: The Golden Ratio Multiplier
This indicator uses multiples of Bitcoin's 350-day moving average (350DMA) to identify potential resistance areas in price fluctuations. From the current indicator, the area where it exceeds the green line and reaches the red line is a relatively good interval to sell in batches. As shown in the figure below.
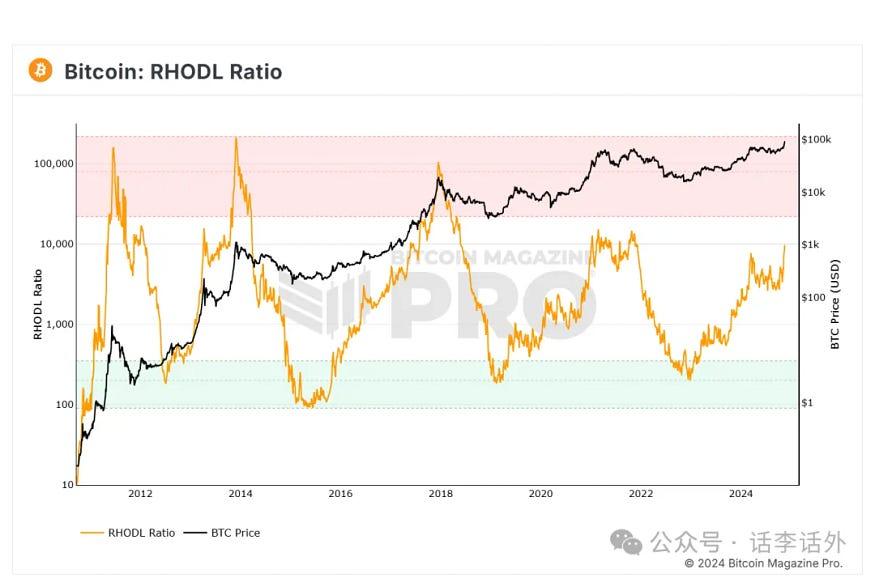
Indicator 12: RHODL Ratio
This indicator uses the ratio of realized value HODL waves, and when the orange line approaches or reaches the red wave band area, it indicates that the market is overheated and it is suitable to take profits in batches. As shown in the figure below.
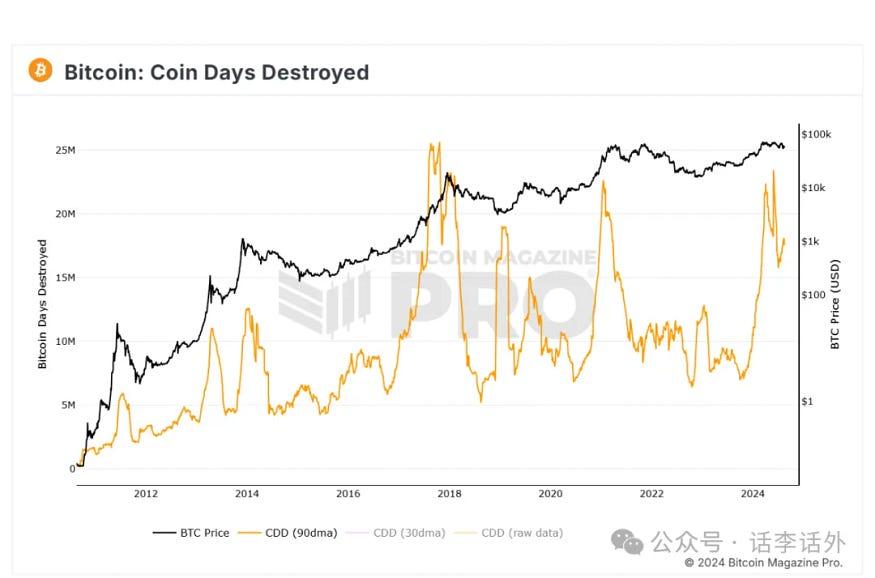
Indicator 13: Coin Days Destroyed
This indicator shows when those old, dormant Bitcoins suddenly wake up and are sent back to the market. When long-term holders start to transfer operations, it often means they are about to sell for profit, so we will see CDD soar sharply before the market peaks. As shown in the figure below.
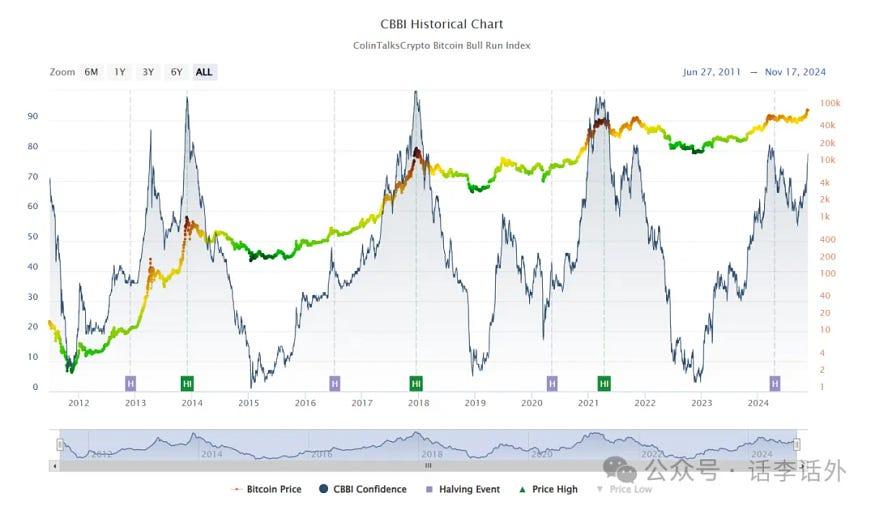
The 14th indicator: Bitcoin Bull Run Index (CBBI)
This indicator is a comprehensive data indicator that helps us understand the stage of the Bitcoin cycle by integrating and using 9 other indicators. A higher score indicates the potential top of the Bitcoin explosion cycle. Based on the current display data of this indicator, when the value exceeds 80, you can start to consider selling Bitcoins in batches. As shown in the figure below.
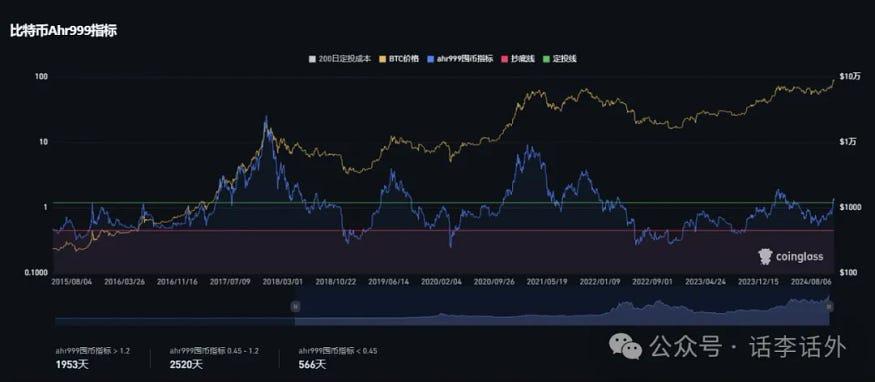
The 15th indicator: Ahr999
This indicator was proposed by a Chinese netizen named Ahr999 in the e-book "Hoarding Bitcoins". The coin hoarder Ahr999 has already retired, and the accounts with the same name online are not the real Ahr999. The calculation formula of this indicator is = (Bitcoin price/200-day cost-averaging) * (Bitcoin price/index growth valuation), where the index growth valuation is the fitting result of coin price and coin age.
This indicator is also called the Bitcoin hoarding indicator, and it is relatively simple to use. When the index is below the green line (value of 1.2), it indicates that the cost-averaging interval has been entered. When the index is below the red line (value of 0.45), it indicates that the buy the dips interval has been entered. Similarly, when the index exceeds the green line, it indicates that the sell interval can be considered. From the current perspective, this indicator seems to be no longer suitable for guiding the escape from the top, but more suitable for long-term cost-averaging reference. As shown in the figure below.
In addition to the above indicators, if you like to study the K-line chart, you can also use the MACD and RSI indicators on the weekly or monthly line as auxiliary reference. These cyclical indicators can not only be used to guide the sell (escape from the top) operations in the bull market, but also be used to seize the accumulation opportunities and hoard coins during the bear market.
In summary, there are still quite a few indicators for Bit, although we have shared 15 indicators, the key point here is not to say that you should use all the indicators, but to select a few that you think are most effective for long-term auxiliary reference.
No indicator is perfect, and when an indicator is focused on by everyone, it may no longer be a perfect indicator. What you need is to find new fusion points from different indicators. In addition, we also need to keep up with the times, such as combining the policy changes of some countries towards the crypto industry and the global macroeconomic situation to make comprehensive considerations and judgments.
At the same time, in this relatively long trading process, we also need to maintain enough patience and constantly improve our trading strategies and trading discipline.
Of course, the last point that needs to be supplemented is that all data indicators are based on historical data estimation or model calculation, and can only be used as auxiliary reference. Your trading operations should also be based on your own risk preference and position management. The indicators listed above are all cyclical indicators, and their guidance significance for short-term operations is not great.
Note: The above content is just a personal perspective and analysis, and is only for learning records and exchange, and does not constitute any investment advice. Any projects or websites mentioned in the article are not directly related to the author (the author does not accept any advertising from project parties), please evaluate the security of the corresponding projects or websites yourself. Investment always has risks, don't get into what you don't understand, and don't play what you can't afford to lose.