The major altcoin Ethereum (ETH) has experienced a notable price increase in the past 24 hours, breaking through the $3,600 mark. This is the first time since June, and ETH is currently trading at a slightly corrected $3,547.
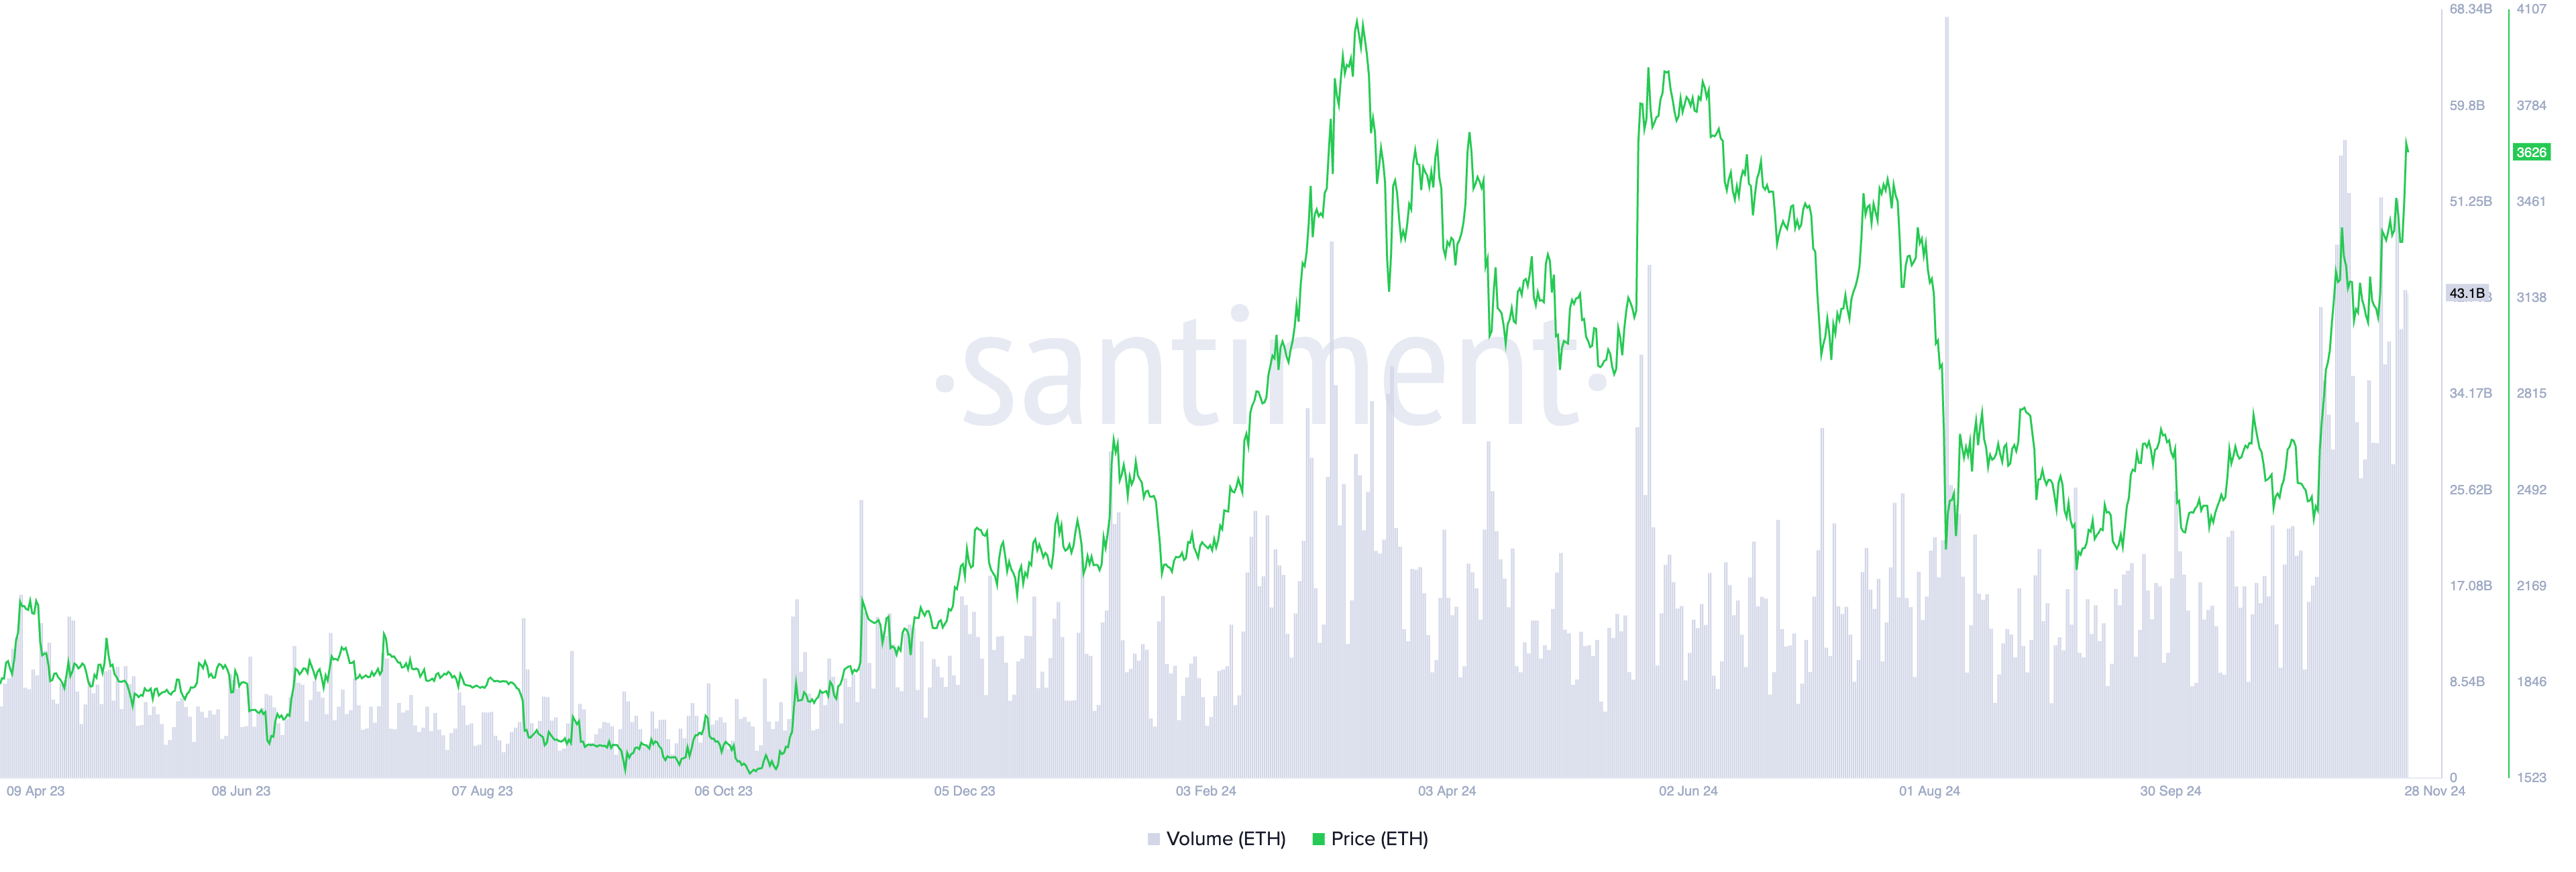
This rebound was driven by a massive trading volume exceeding $43 billion in the past 24 hours. This suggests a sustained rally towards the psychological price level of $4,000.
ETH Price Soars... Is an Altcoin Season Coming?
ETH's trading volume reached $43 billion in the past 24 hours. This surge in trading activity has lifted the coin's value back to prices seen five months ago.
When an asset's trading volume rises along with its price, it indicates strong market interest and confidence in the upward movement. This combination suggests the price rally is supported by substantial buying activity and is likely sustainable.
Therefore, ETH's high trading volume reflects increased market demand and broad participation. This reduces the likelihood of a sudden reversal.

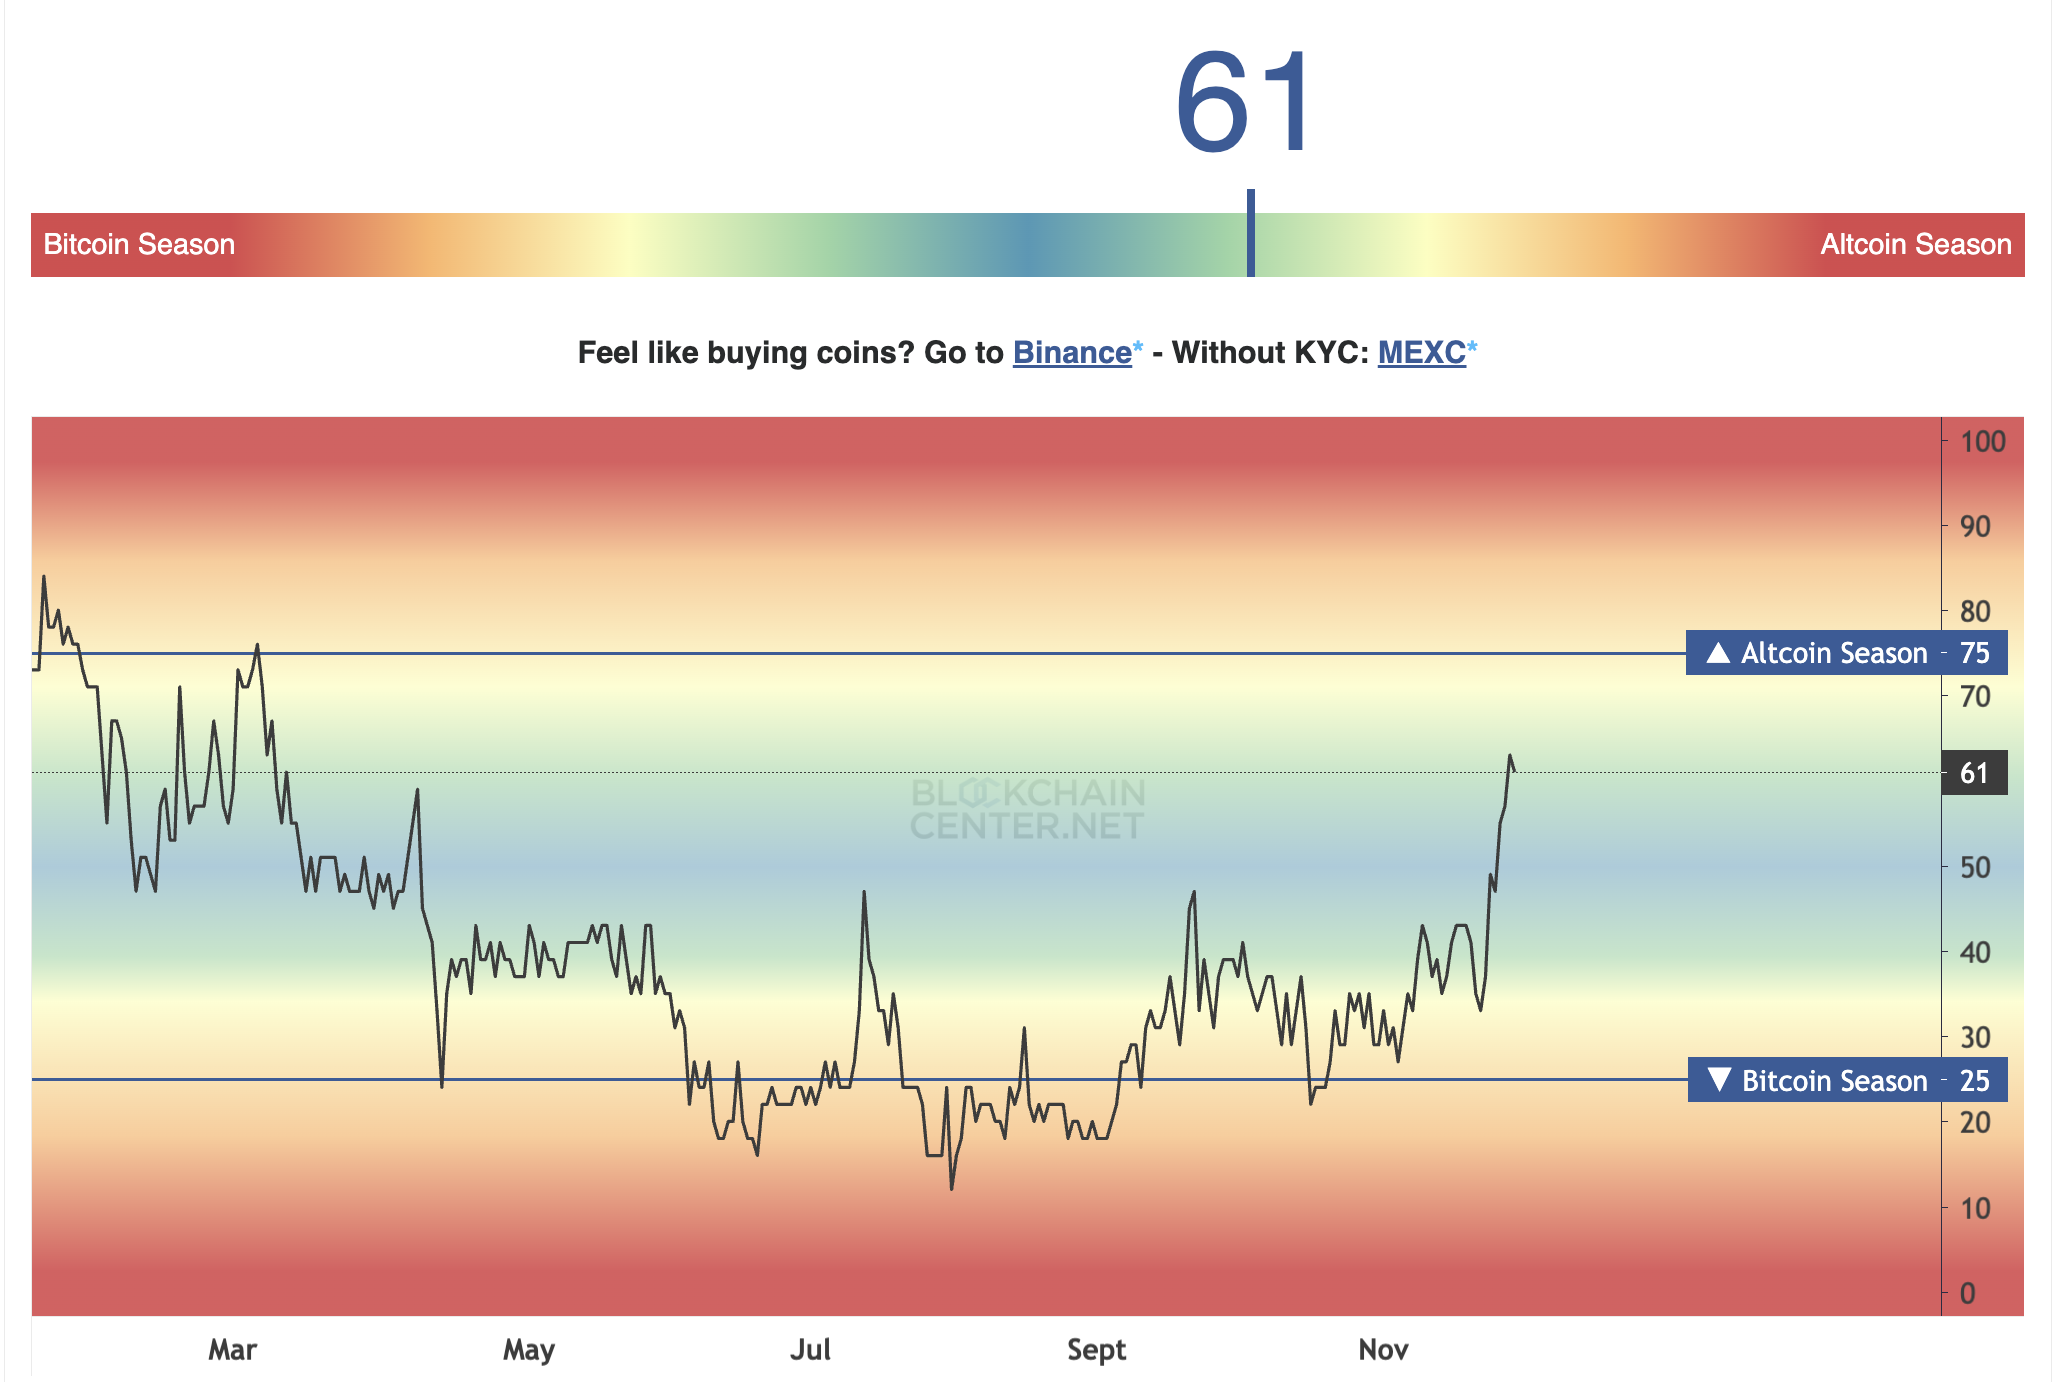
Furthermore, Ethereum's recent surge suggests a potential shift towards an altcoin season. According to the Blockchain Center's Altcoin Season Index (ASI), the current score of 61 out of 100 is approaching the 75-point threshold that signals the start of the expected period.

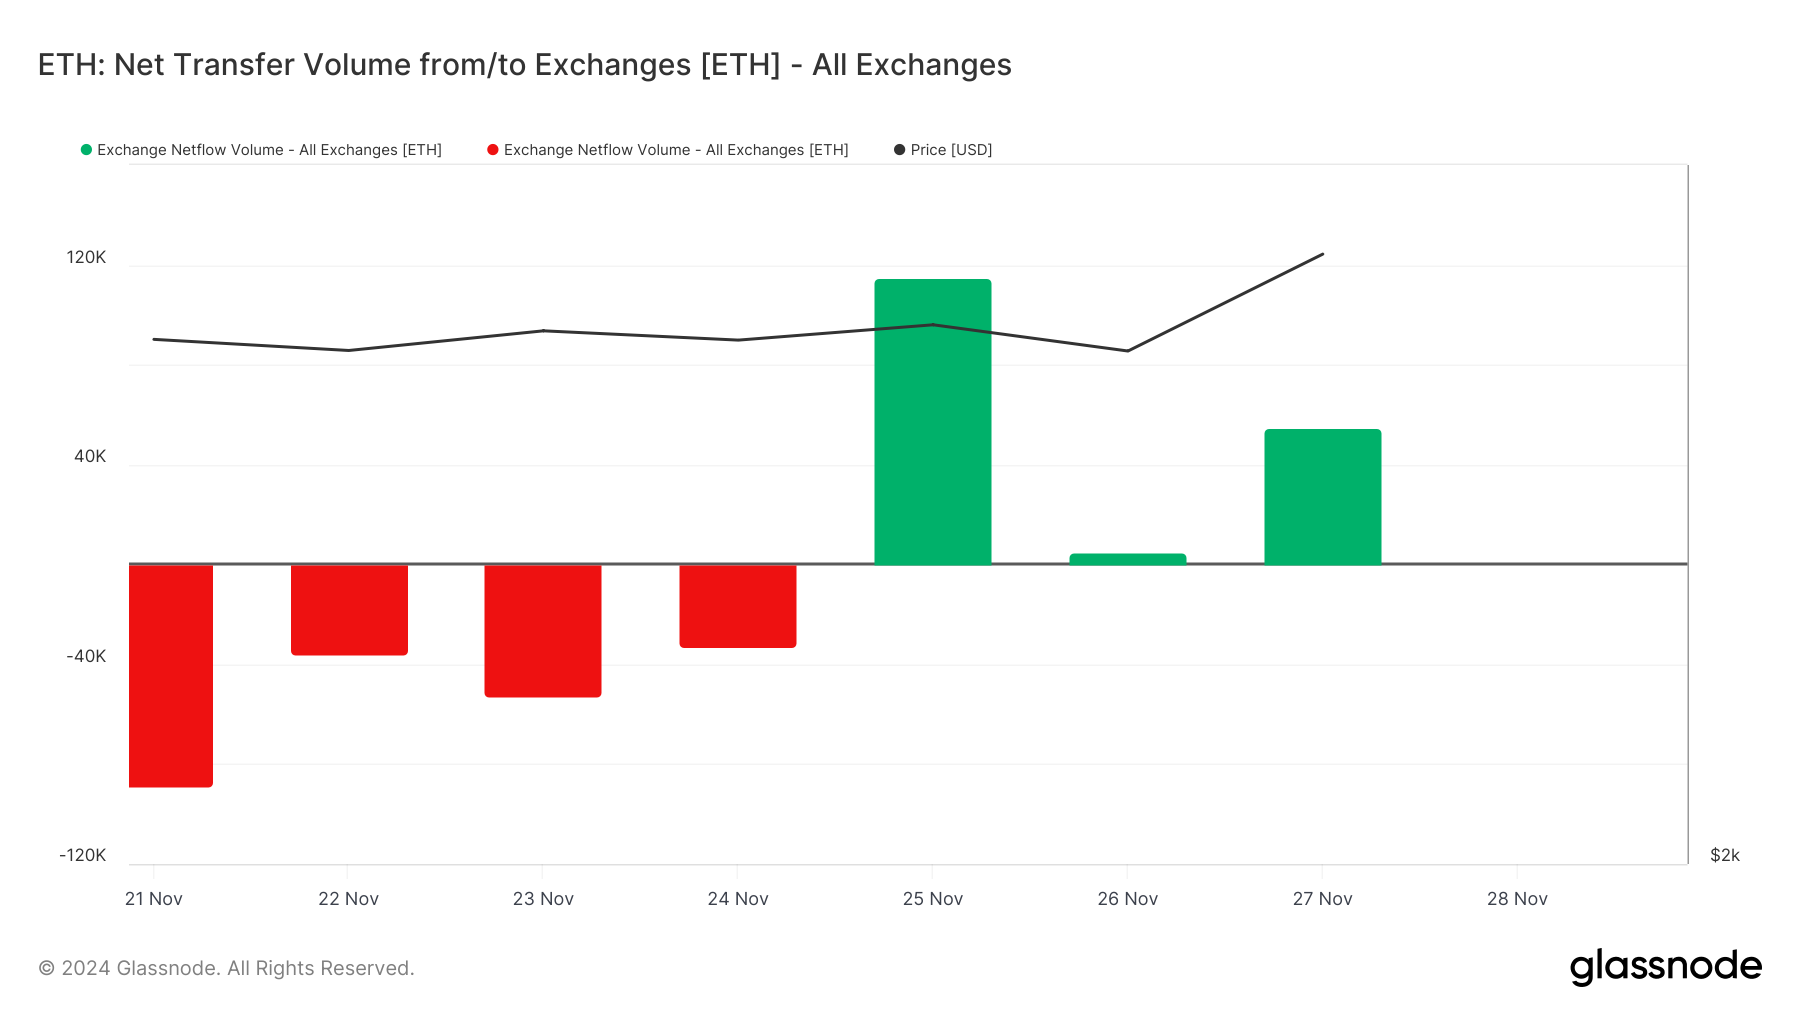
Notably, this price surge has already prompted some profit-taking activity, as reflected in the coin's positive exchange net inflows. On Wednesday, 54,974 ETH, valued at over $19.9 million, were transferred to exchanges.
The exchange net inflow metric measures the difference between inflows and outflows to exchanges over a specific period. Positive net inflows indicate more coins are moving to exchanges, often signaling selling pressure as traders prepare to sell.
An increase in exchange supply that does not match demand can put pressure on the price.

ETH Price Prediction: Heading Towards Yearly Highs?
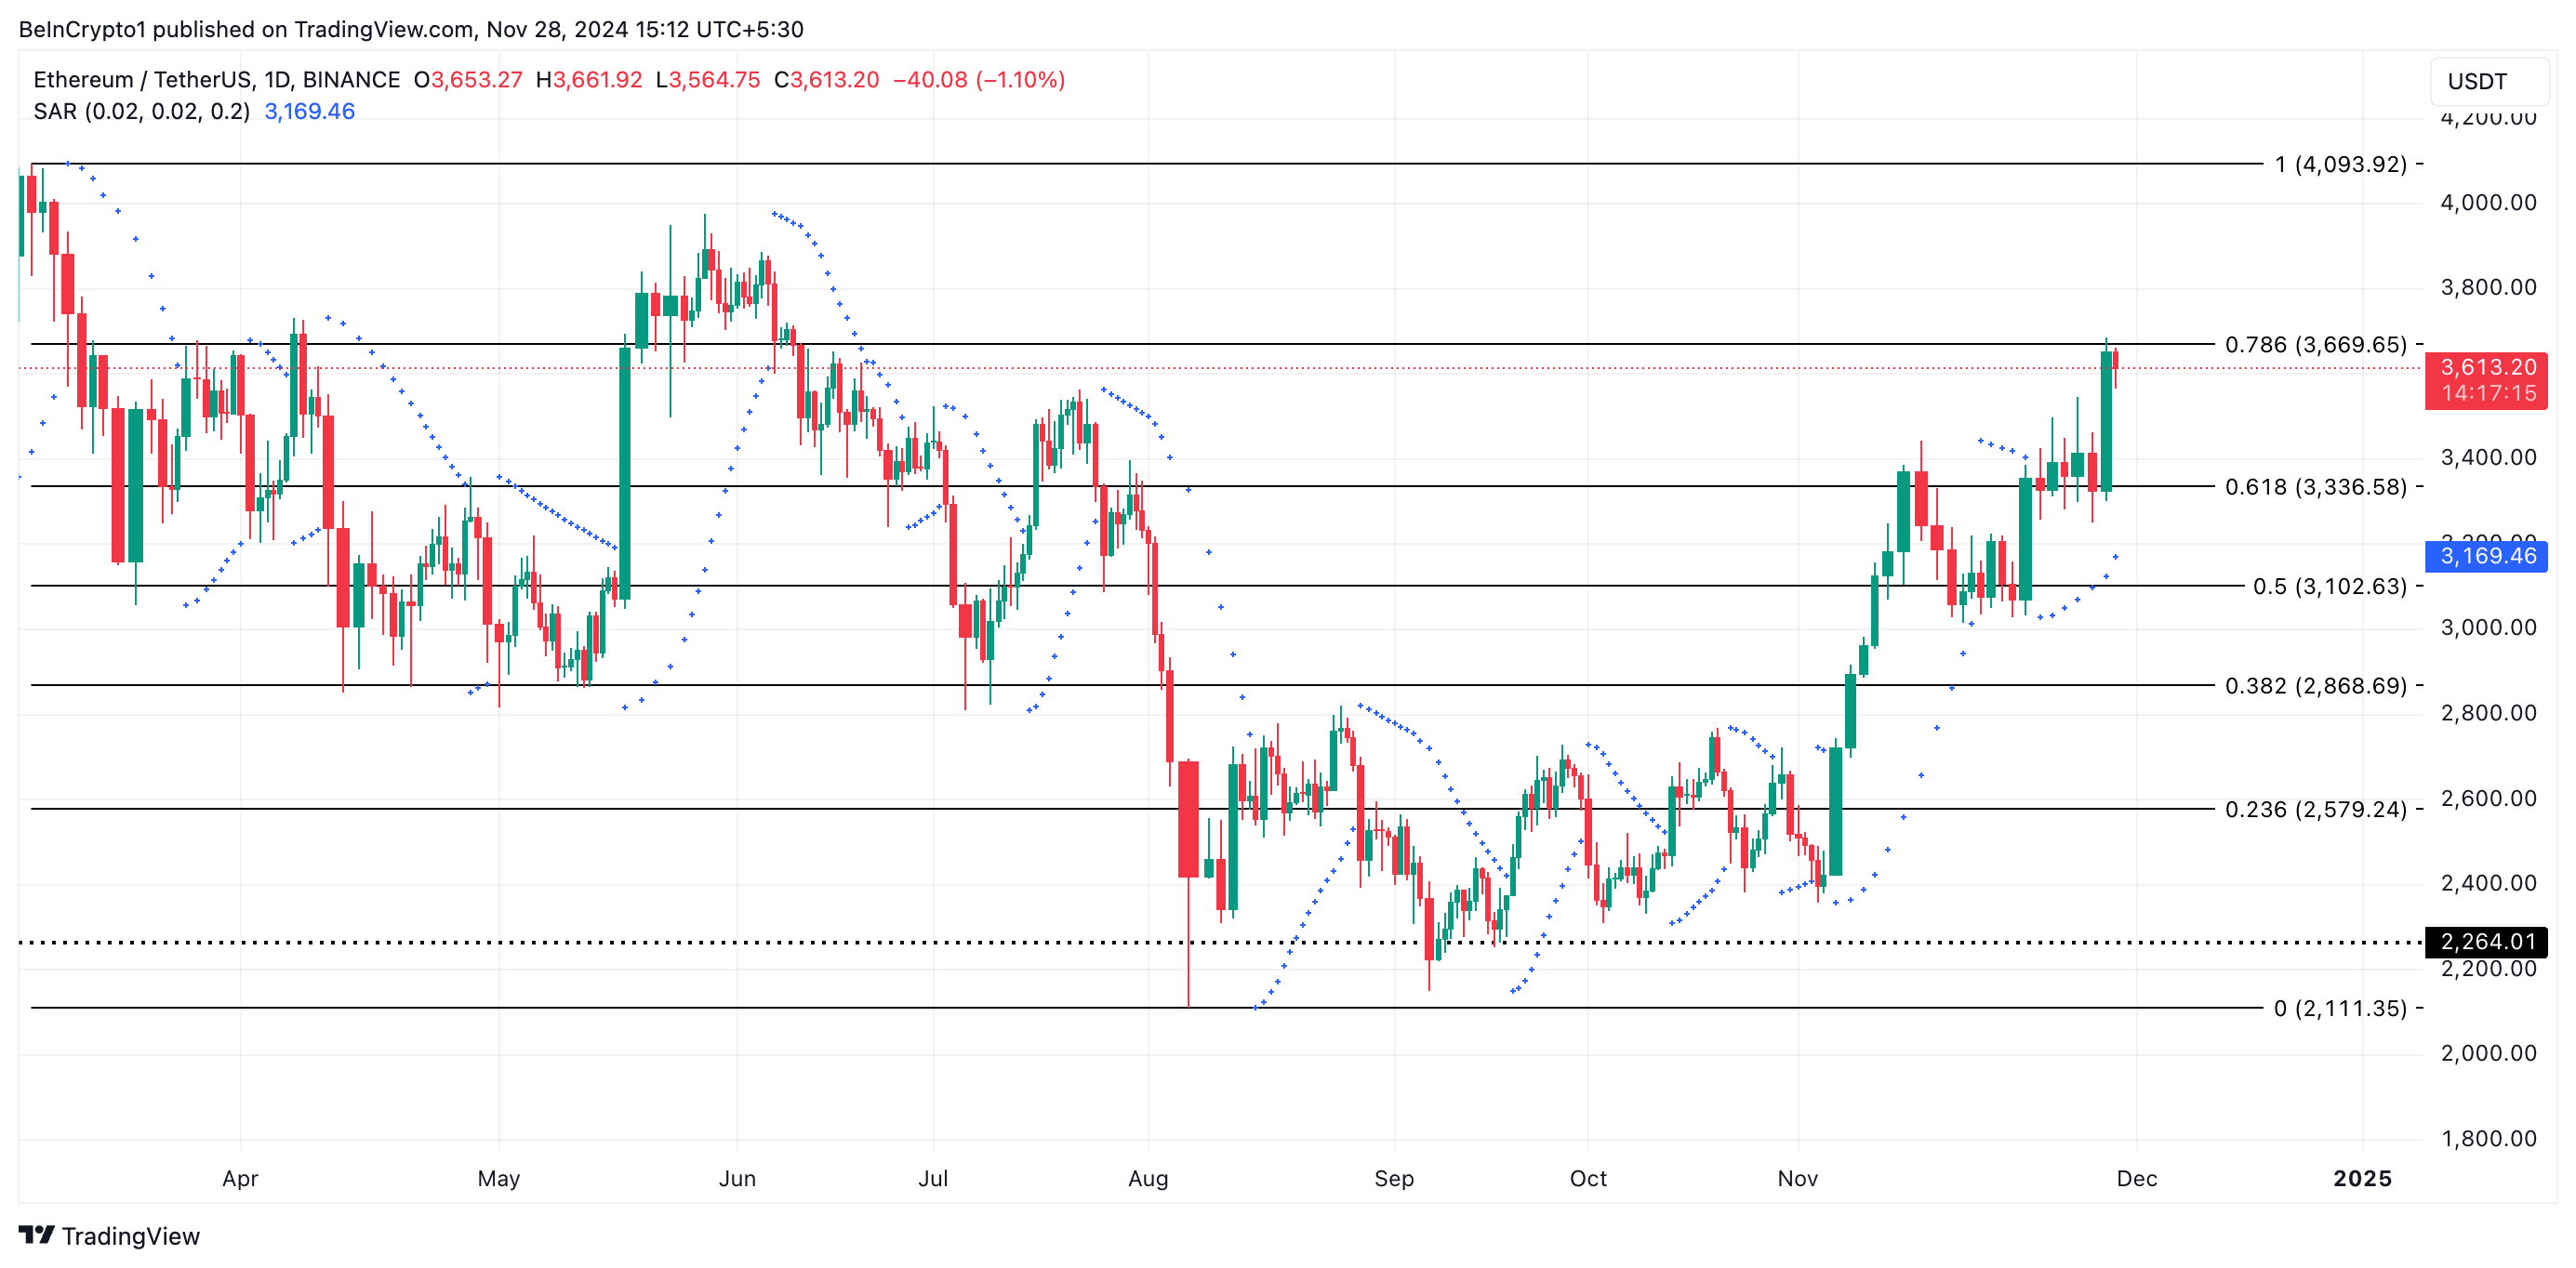
Nevertheless, the overall bullish sentiment in the Ethereum market remains strong, suggesting the uptrend may continue. The Parabolic SAR (Stop and Reverse) indicator plotted on the daily chart confirms this bullish outlook.
This indicator identifies potential trend reversals and provides dynamic support and resistance levels. It places dots above or below the price chart: dots below the price indicate a bullish trend, while dots above indicate a bearish trend.
With the SAR positioned below the ETH price, it signals upward momentum and suggests a bullish trend. If the bullish trend persists, the ETH coin price could break through the $3,669 resistance and rise to the yearly high of $4,093.

However, if the bullish pressure subsides, the ETH coin price could drop to the support level of $3,336.


