The Dogecoin (DOGE) vs. Bitcoin (BTC) chart is showing interesting signals on the monthly timeframe, indicating that the meme coin may be preparing for a price surge. Historical analysis suggests that whenever Bitcoin's price declines relative to DOGE, DOGE tends to rise and set new all-time highs.
At the time of reporting, the price of Dogecoin is $0.44, with 40% left to reach its all-time high. However, based on the current outlook, this cryptocurrency may exceed that level.
Dogecoin Maintains Strength Against Top Coin
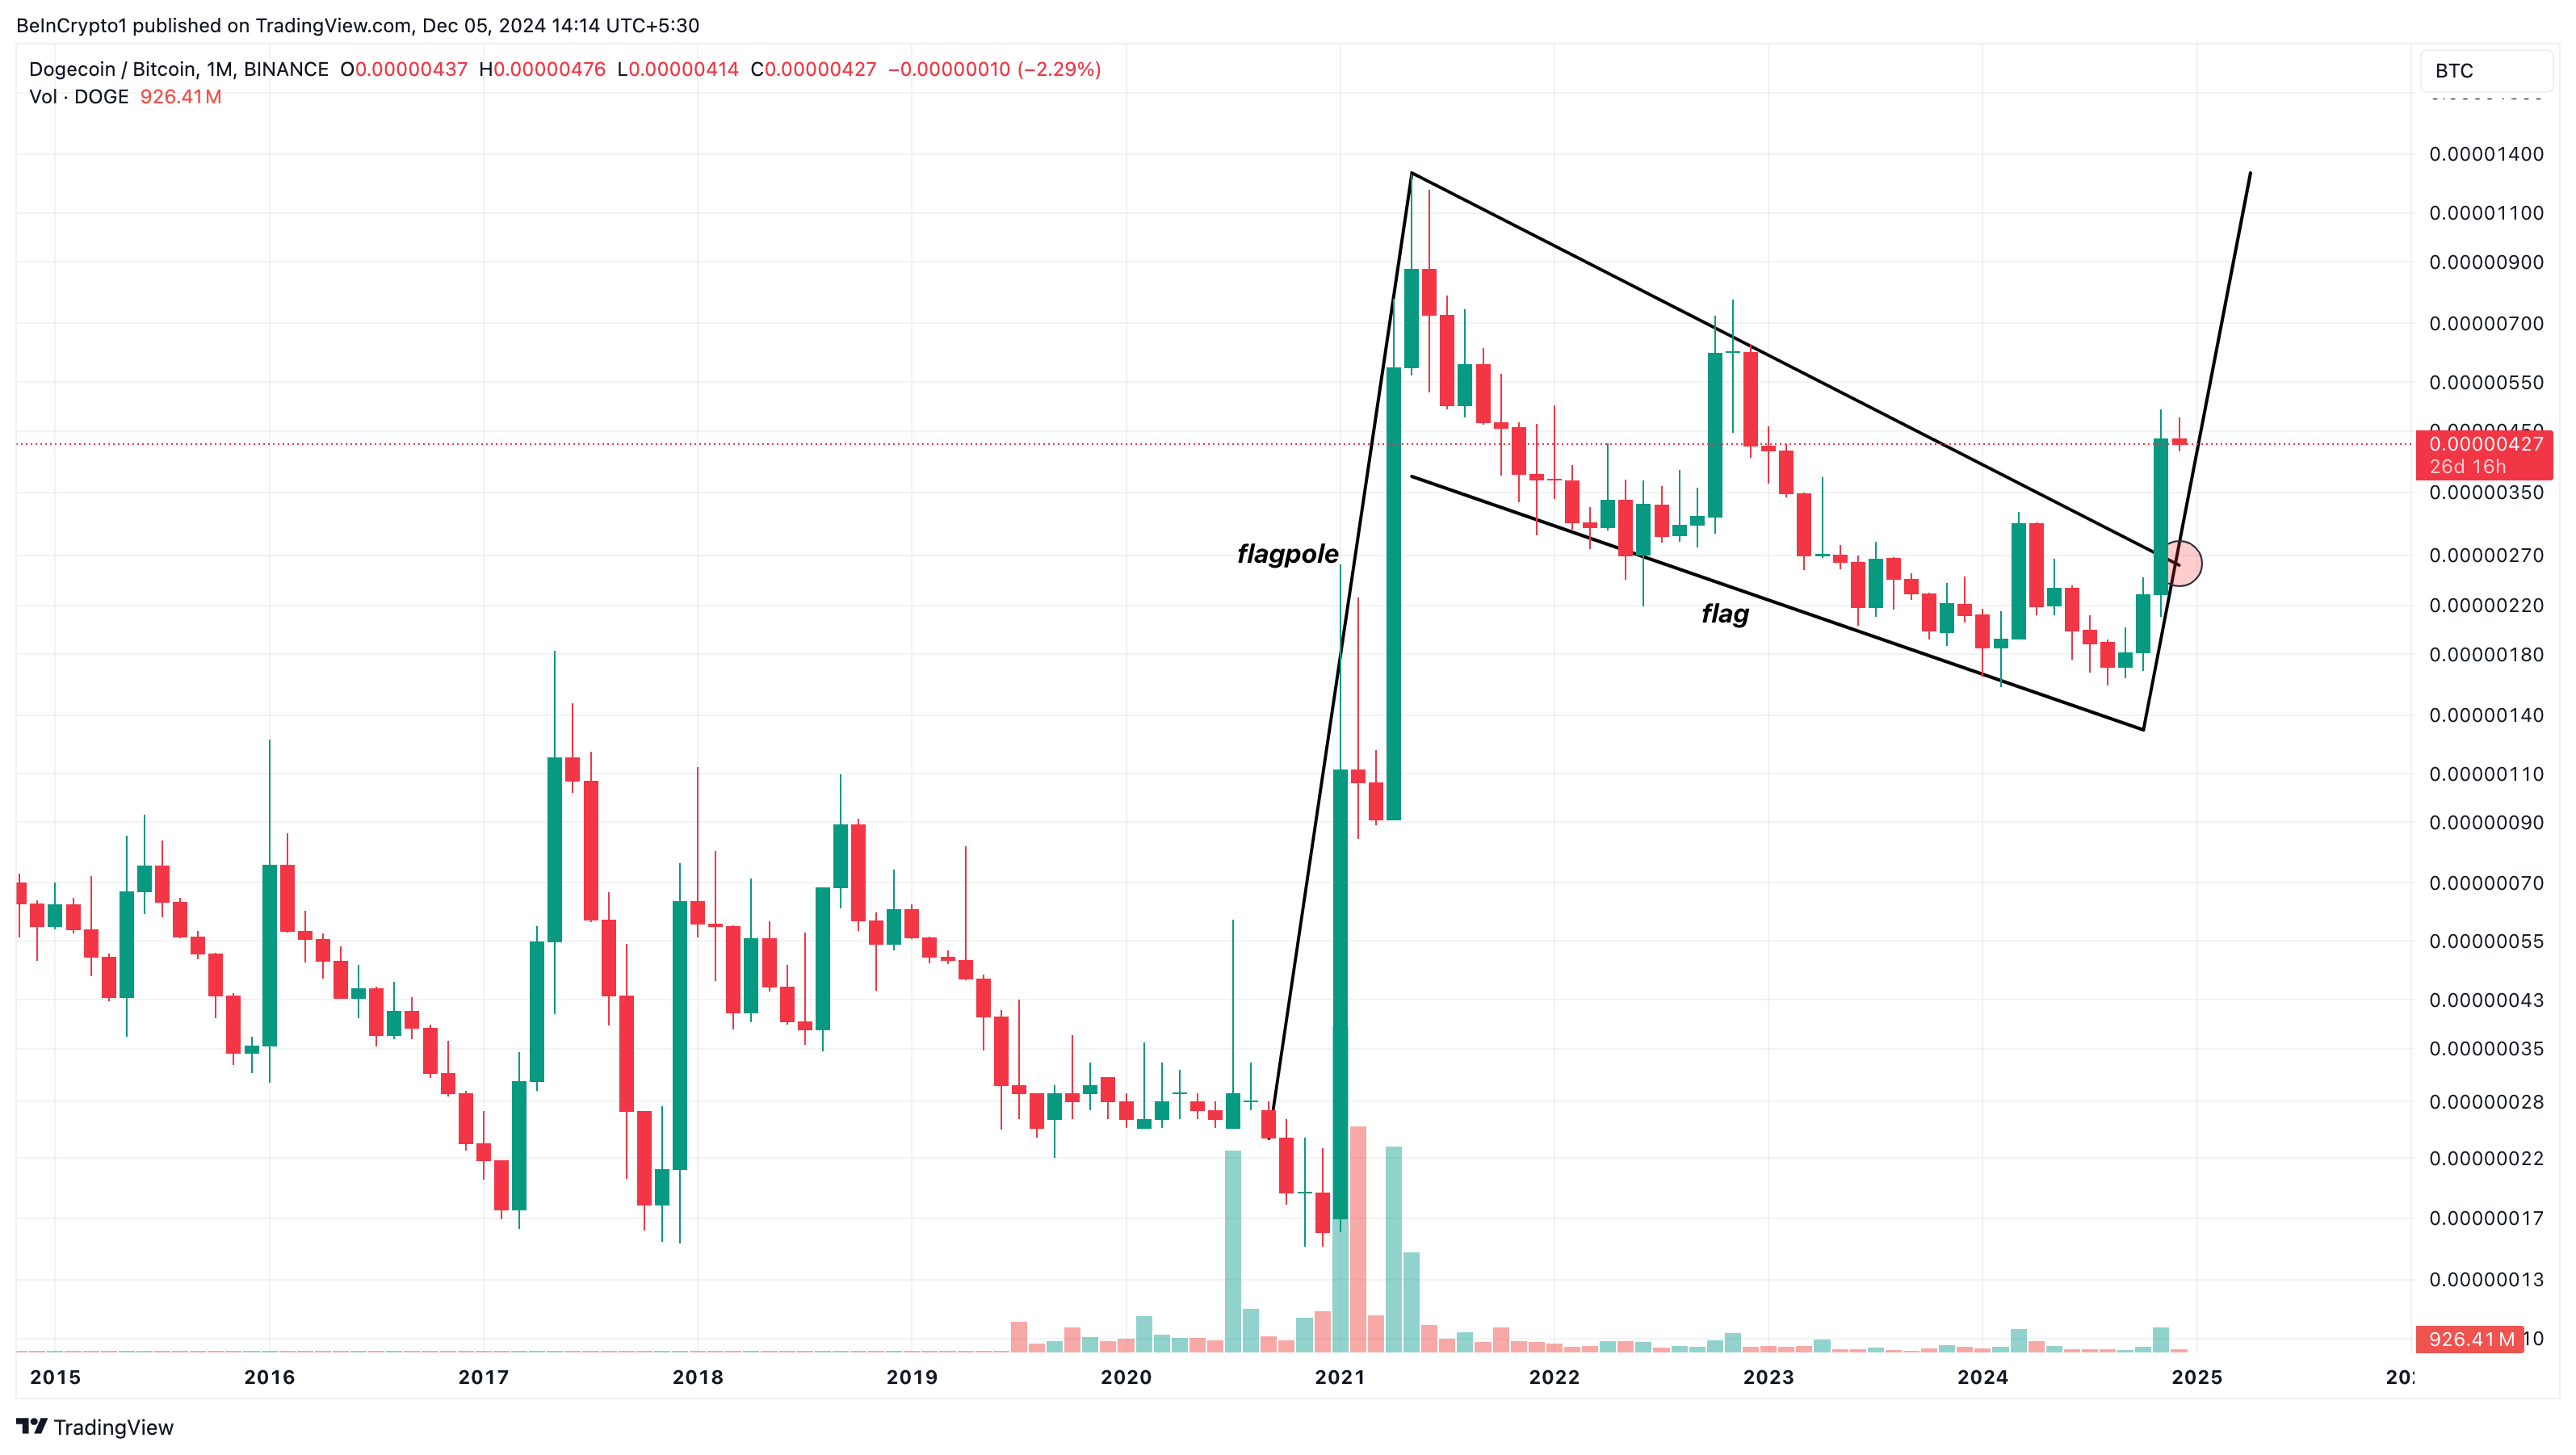
Looking at the DOGE/BTC chart, a bullish flag is forming. A bullish flag is a classic continuation pattern in an uptrend, characterized by a brief corrective pullback followed by a sharp price increase.
On the chart, the bullish flag often takes the shape of a narrowing triangle or a rectangular (flag) pattern, reflecting the decreasing trading volume as market participants secure their positions. As the range narrows, a breakout known as a bullish pennant occurs, pushing the price higher and confirming the continuation of the uptrend.
As seen above, the Dogecoin vs. Bitcoin chart shows that the meme coin has emerged from its consolidation period, and the current pair's value is 0.0000042. If the trend remains at 0, the DOGE/BTC pair can rise to 0.000014 by wiping out a zero.

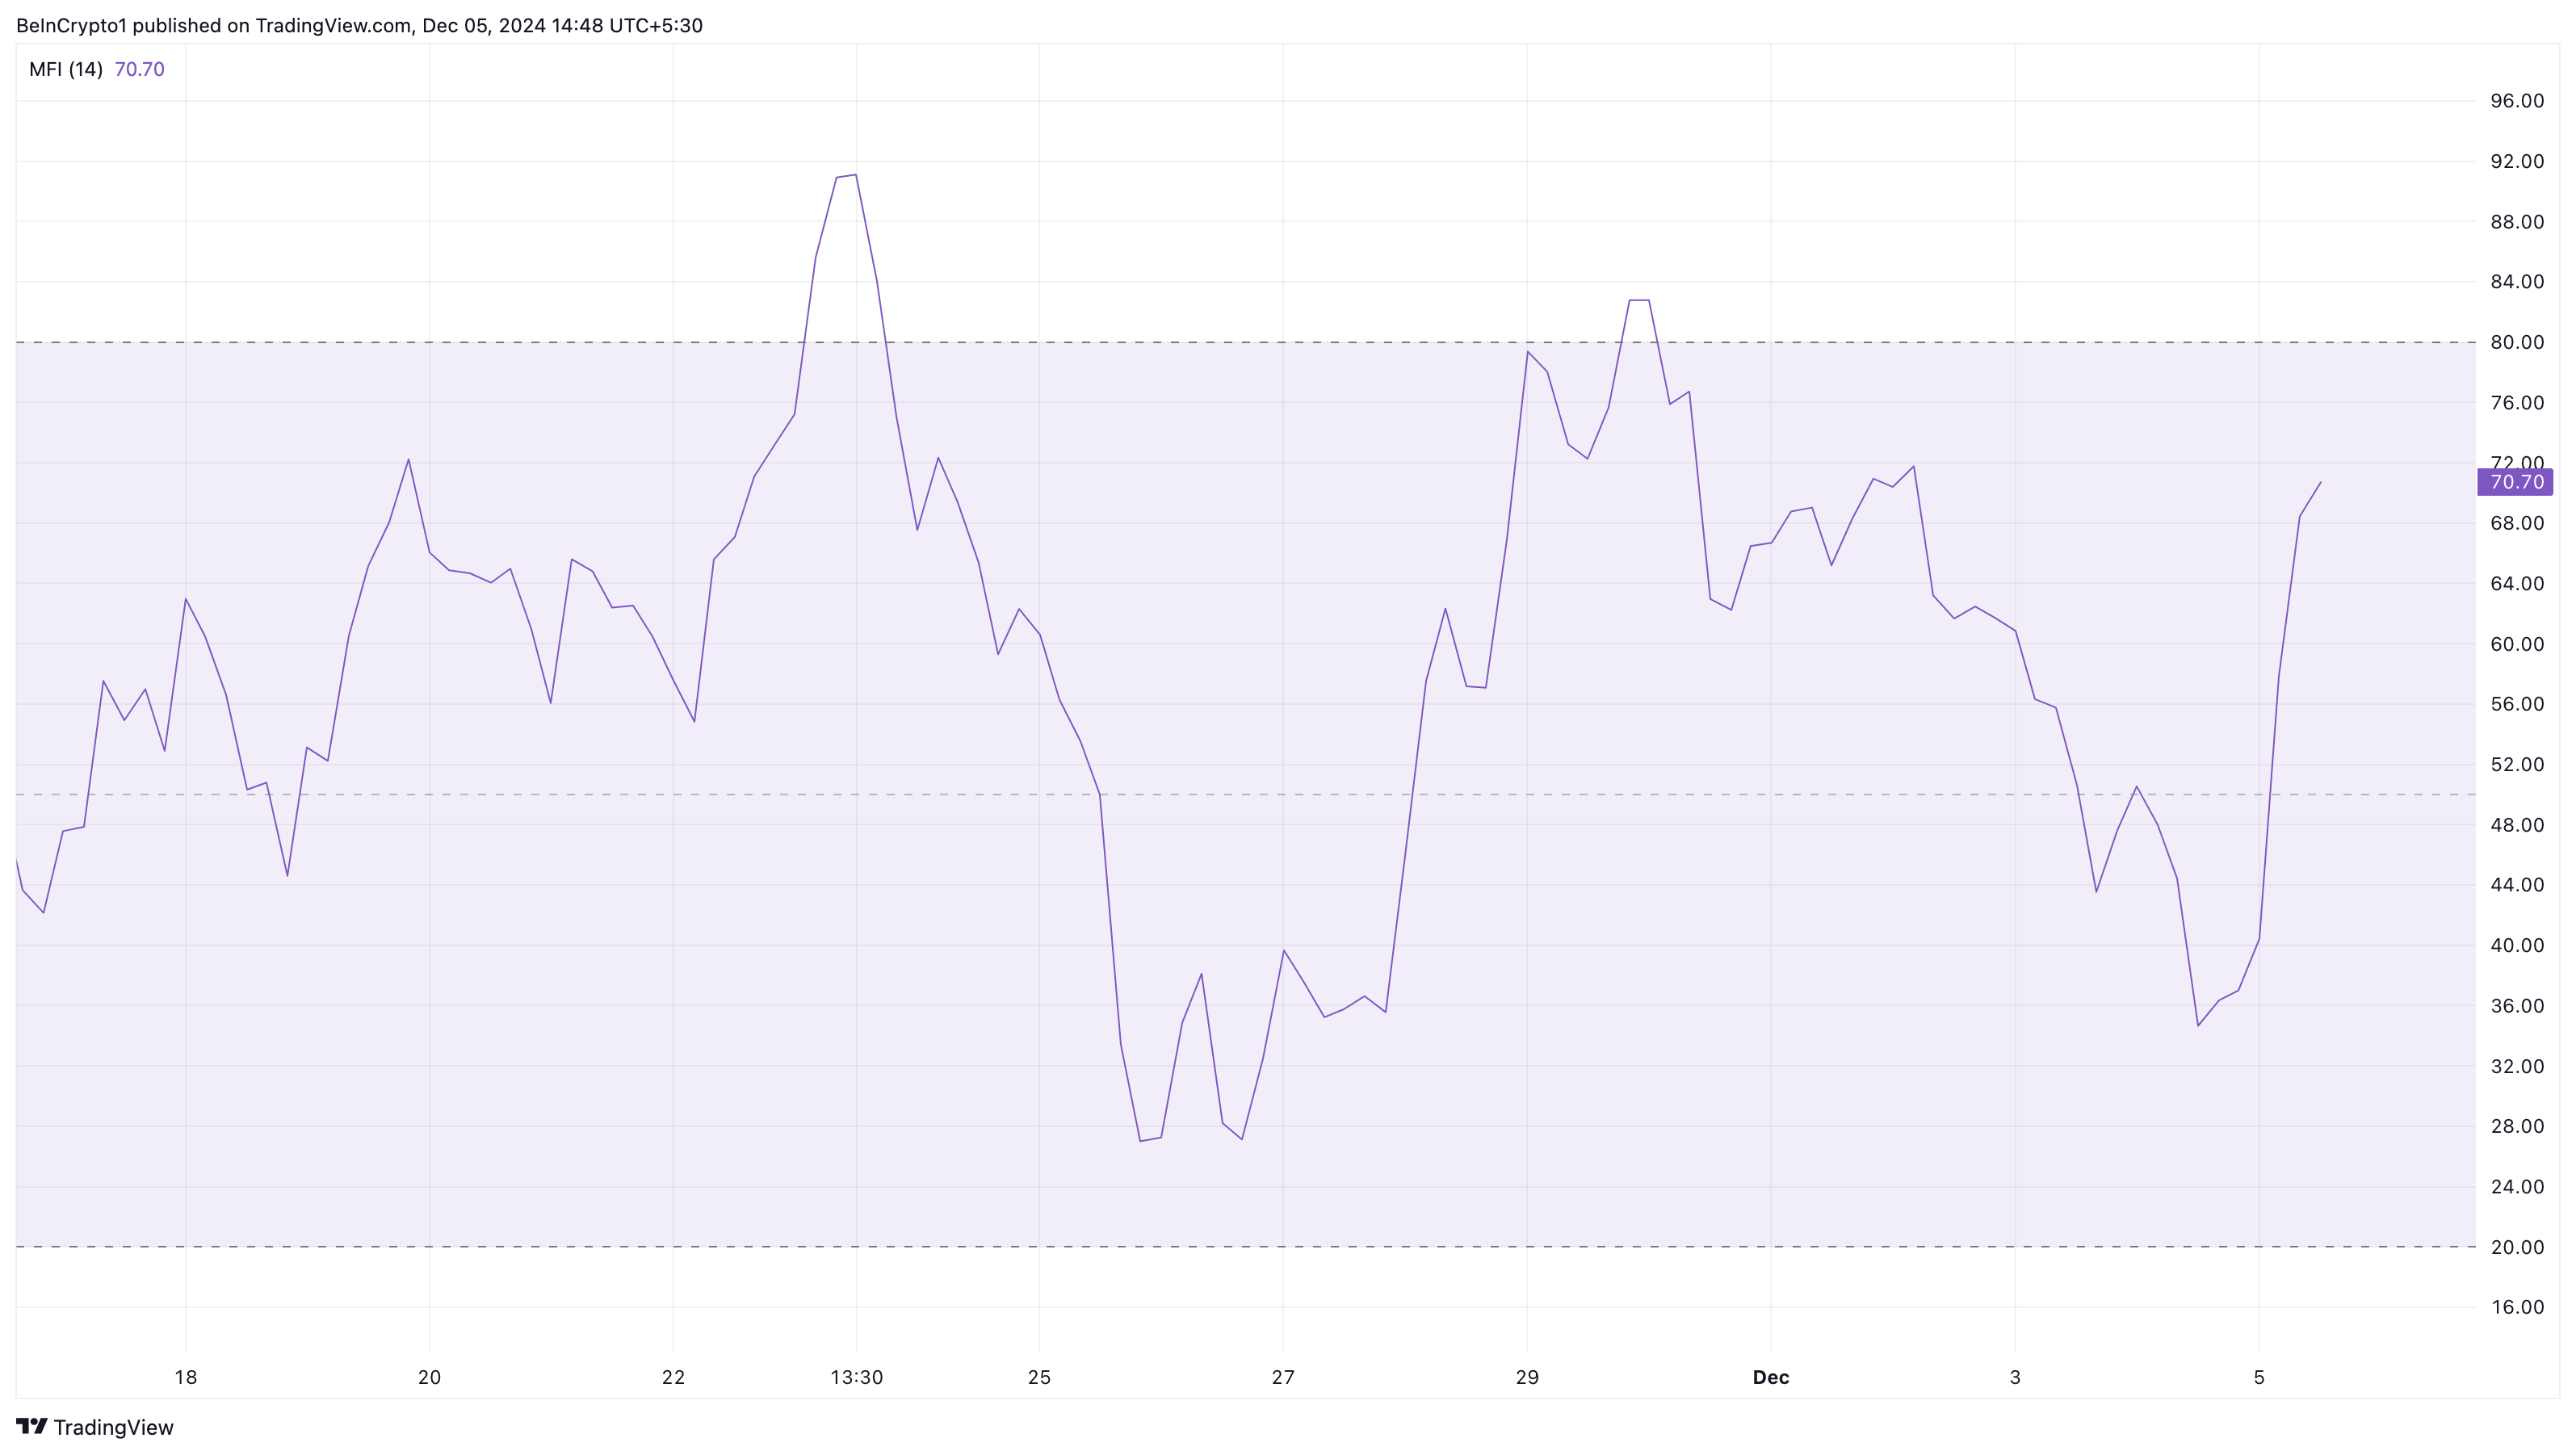
Additionally, the 4-hour DOGE/USD chart is strengthening the bullish outlook, with the Money Flow Index (MFI) rising to 70.70. The MFI measures the flow of capital into the cryptocurrency, providing insights into market momentum.
A rising MFI indicates increasing buying pressure, while a decline suggests selling dominance. The rising MFI of Dogecoin implies increased demand and may fuel predictions towards a $1 target.

Cryptocurrency analyst Rect Capital also supports this bullish outlook, emphasizing Dogecoin's retest of the upper boundary of its ascending triangle. According to the analyst, this technical movement indicates that a significant breakout is imminent.
"Dogecoin has so far followed all of Bitcoin. Now it is retesting the top of the ascending triangle as support. A successful retest here is crucial ahead of a confirmed breakout." – Rect Capital, Cryptocurrency Analyst
DOGE Price Prediction: Bullish Outlook Remains
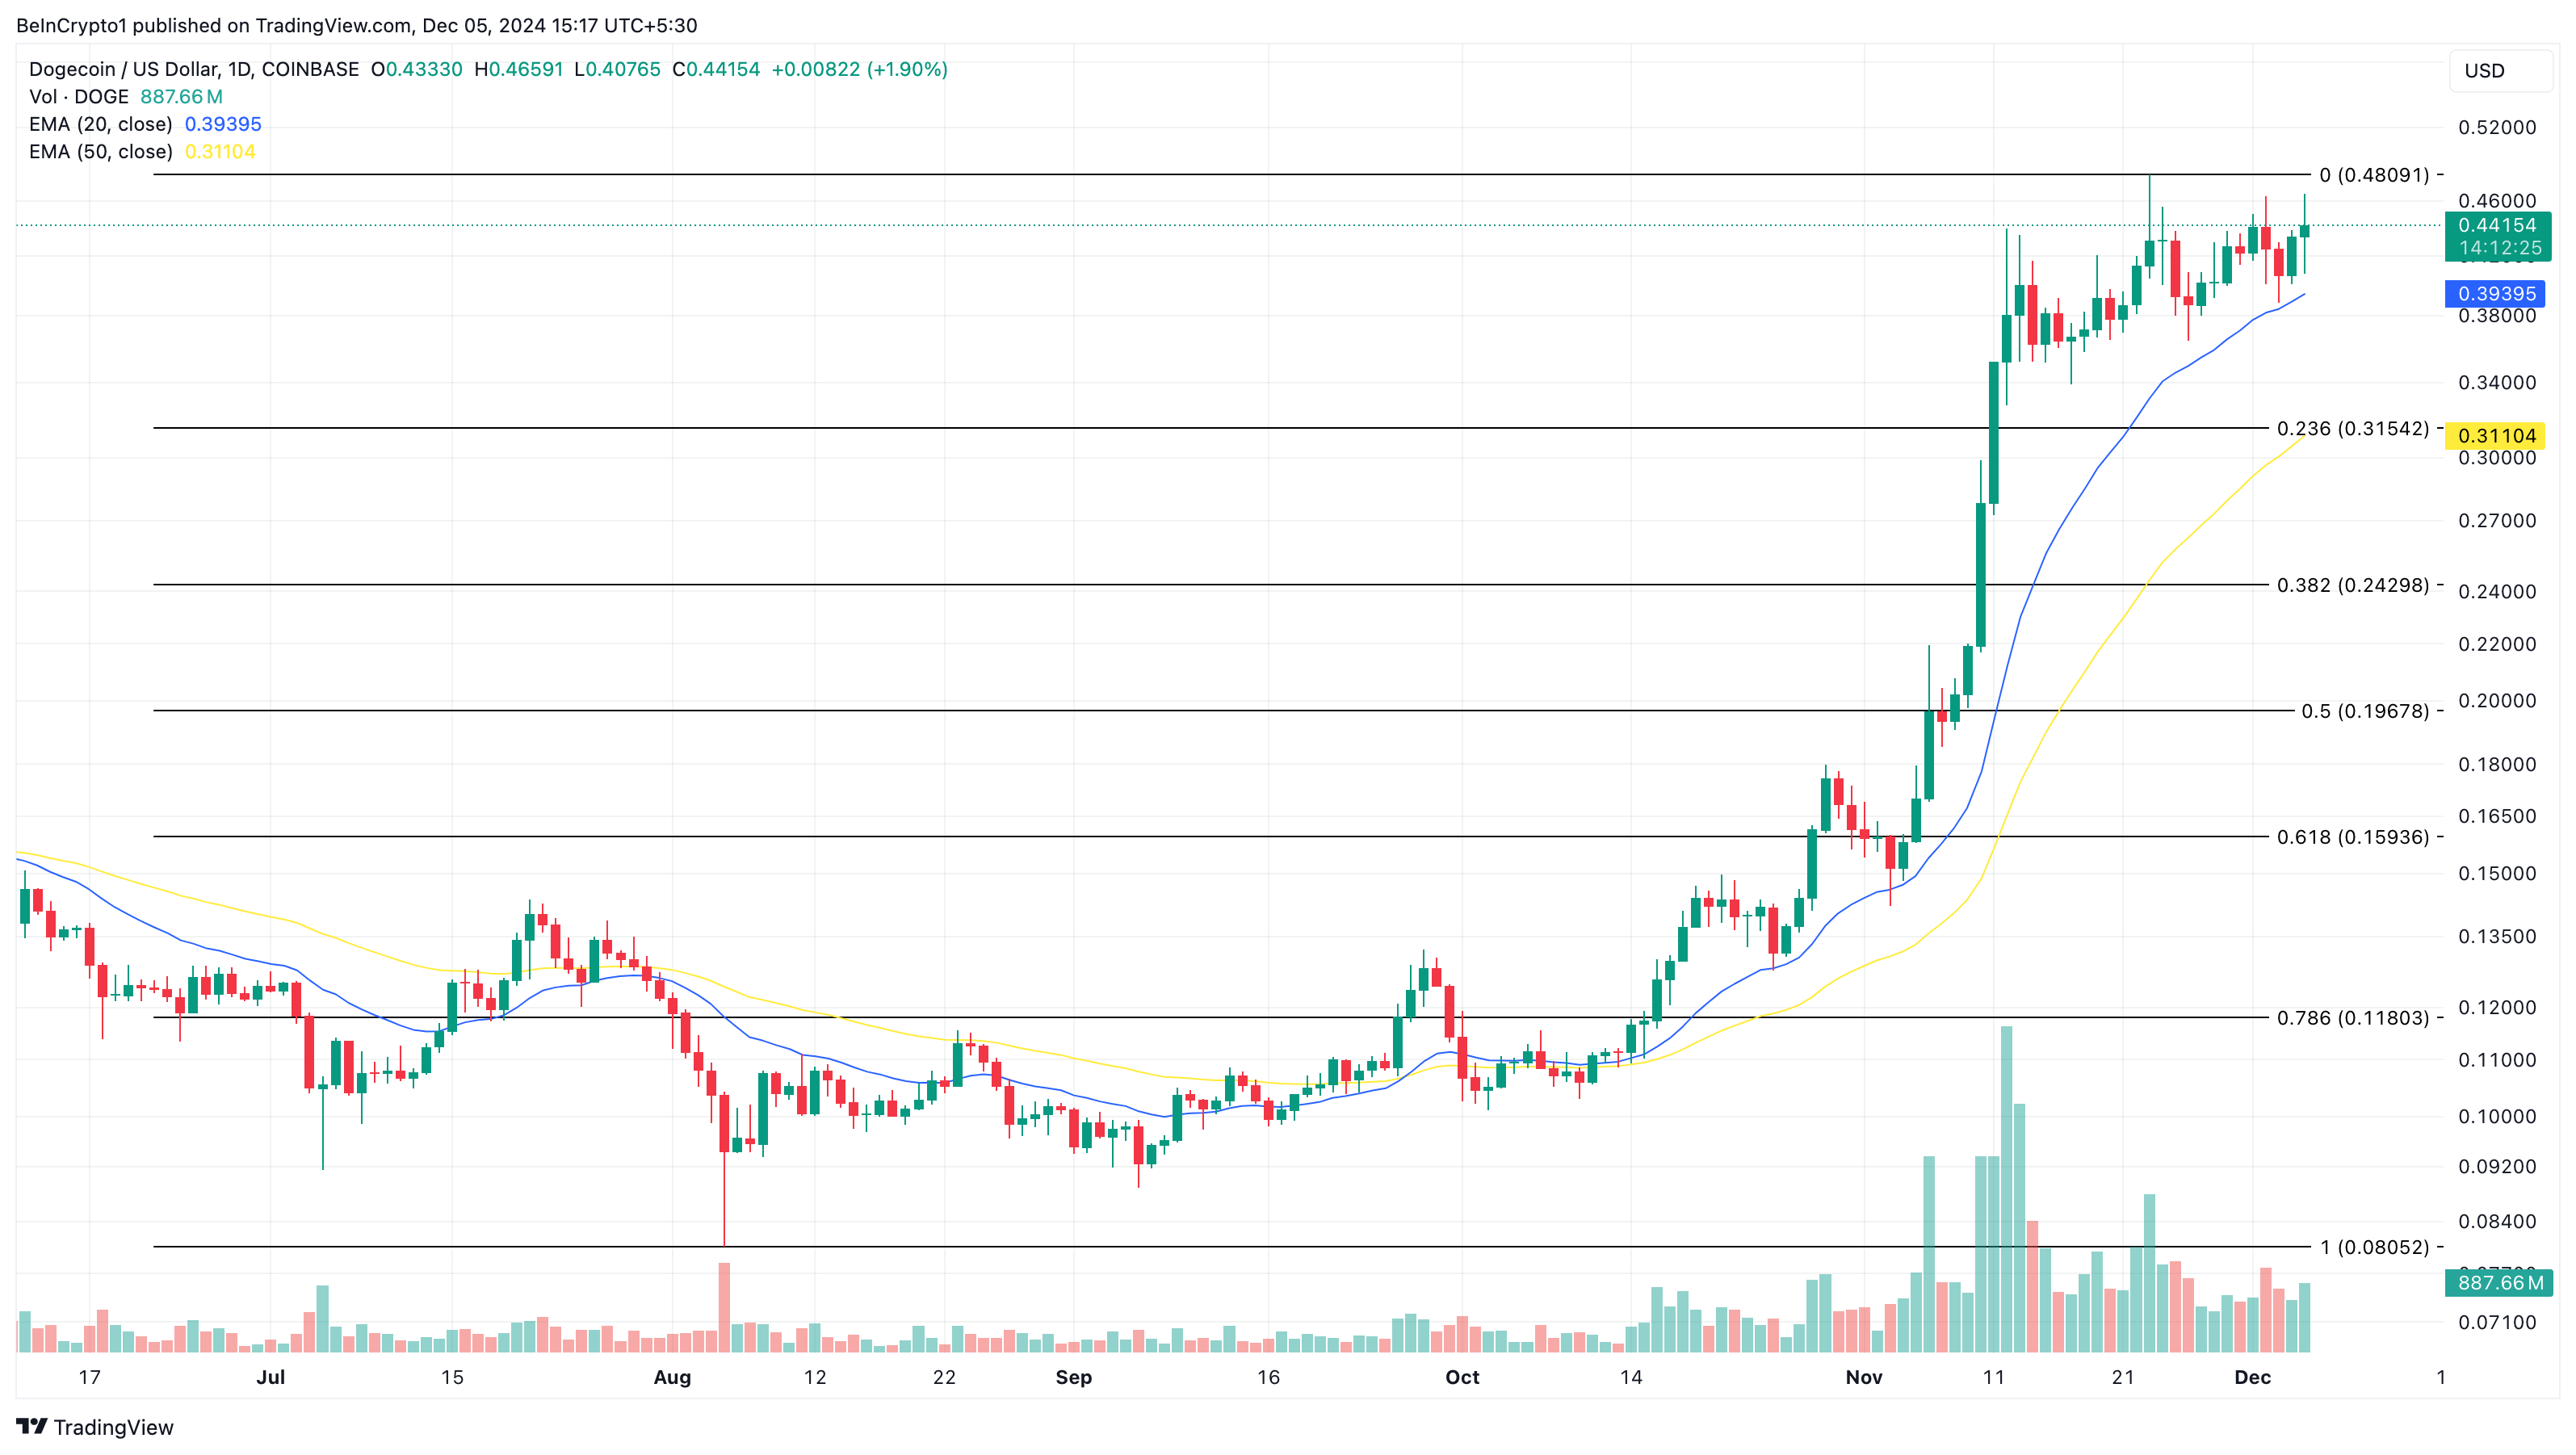
On the daily chart, Dogecoin's price is trading above the 20-period Exponential Moving Average (EMA) and the 50 EMA. EMAs are technical indicators used to measure the trend of a cryptocurrency.
When the price is above the EMAs, the trend is bullish. Conversely, when the price is below the trend, the trend is bearish. Therefore, Dogecoin's price can continue to rise, potentially reaching $0.48 in the short term.

If confirmed, the value of the meme coin can rise to $1 as long as the Dogecoin vs. Bitcoin chart maintains its bullish trajectory. However, if DOGE declines against BTC, this may not occur, and the value of the meme coin could drop to $0.32.


