

Author: Keyrock
Compiled by: Felix, PANews
Key Points:
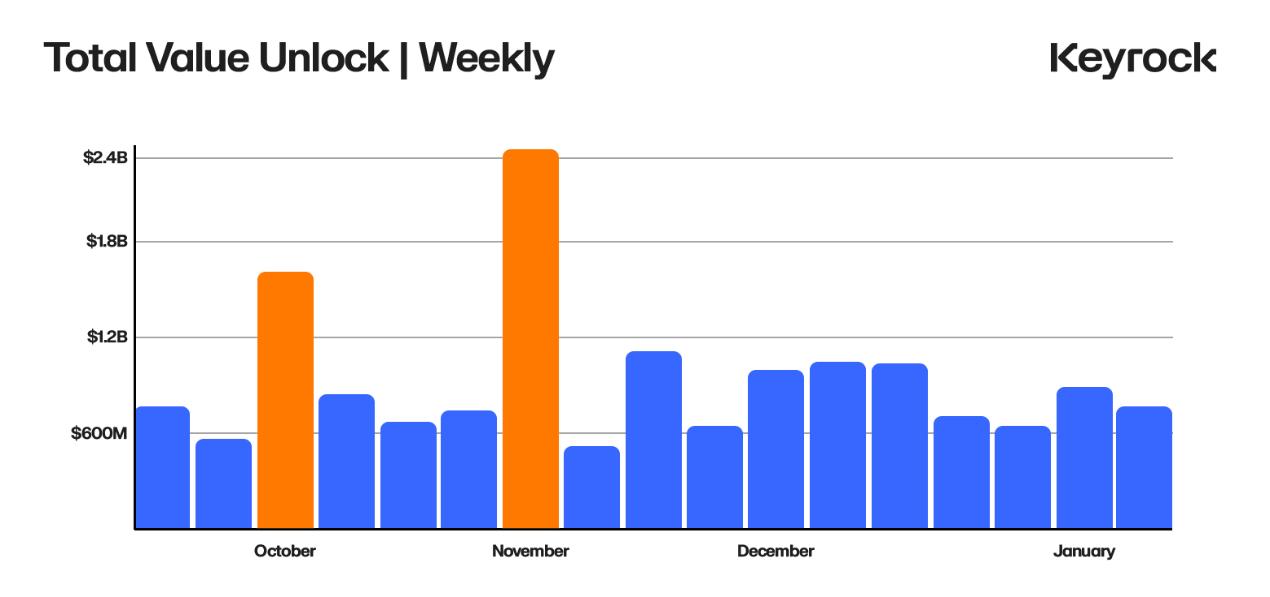
- Over $600 million worth of tokens are unlocked every week
- Regardless of scale or type, 90% of unlocks create negative price pressure
- The impact on token prices typically begins 30 days before the unlock event
- Larger unlocks lead to more significant price drops (2.4x) and increased volatility
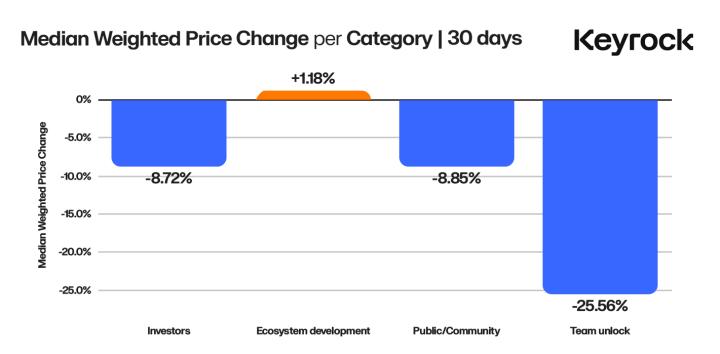
- Team unlocks trigger the most severe crashes (-25%) and irrational sell-offs
- Investor unlocks exhibit more controlled price performance as they adopt wiser strategies, mitigating the market impact of unlocks
- Ecosystem development unlocks are one of the few factors with a positive impact (average +1.18%)
Introduction
Over $600 million worth of locked tokens are unlocked every week (equivalent to the market cap of Curve). These tokens are typically released in predetermined intervals, flowing into the hands of different participants. The scale and cadence of these unlocks, their expected timing and dates, and the recipients of these tokens all impact the value and market dynamics of the tokens.
In the crypto realm, where short-term decision-making and rampant profit-taking behavior dominate, the rhythm and structure of token unlocks are crucial for ensuring long-term value capture and improving holder satisfaction. Unlocks are not a novel concept. In traditional finance, mechanisms like equity vesting have long been used to incentivize employees to stay aligned long-term. However, in blockchain projects, the methods, frequencies, and impacts of token unlocks vary greatly.
In the 16,000 unlock events analyzed in this paper, a striking pattern emerged: Unlocks of all types, scales, and recipients almost universally have a negative impact on prices.
This paper takes a trader-centric approach, examining some of the most prominent token unlocks of the past few years. It analyzes how unlocks of different scales and recipient types impact prices, identifying recurring patterns and key behavioral differences across the entire ecosystem.
Understanding Unlocks
As a trader, you cannot see the overall retail buy or sell decisions, but you can understand the information of another set of holders - those on the vesting schedule. Unlock timelines are the key to unlocking the puzzle, as they not only hint at future supply shocks but also serve as leading indicators of sentiment and volatility.
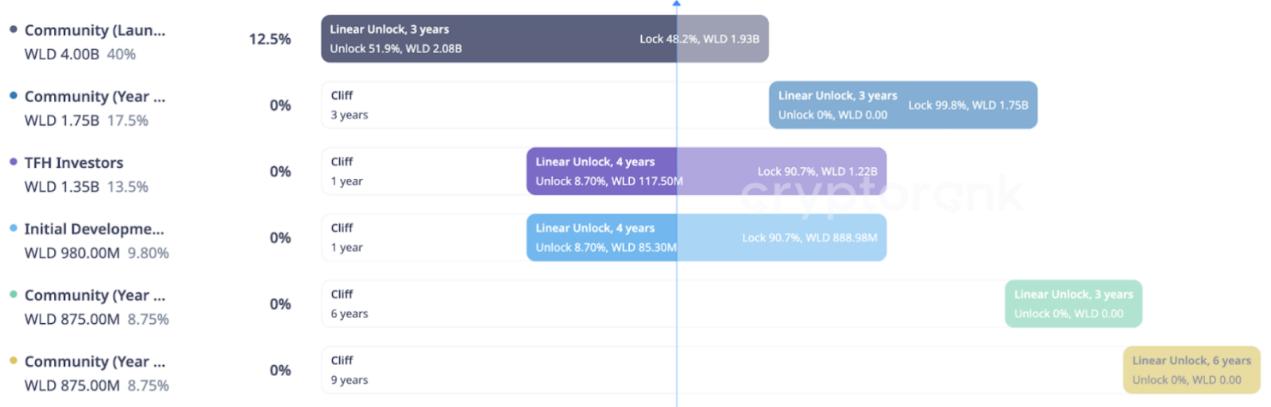
Most vesting schedules look like the table above: a long-term calendar with "Cliffs" and "Linear or Batch Unlock Blocks" in the middle. These blocks are allocated to different recipients - categories like "Seed Investors", "Core Contributors", or "Community".
Designing unlocks is a tricky task for any project. You can't simply pre-gift all the tokens, as recipients may leave and sell them. But you also can't make them wait too long, or they may feel the project is not worth it. Projects must strike a balance: incentivizing recipients to stay in the early stages of the project's development, while also keeping them engaged long-term. The solution is often to gradually distribute tokens over a specified vesting period.
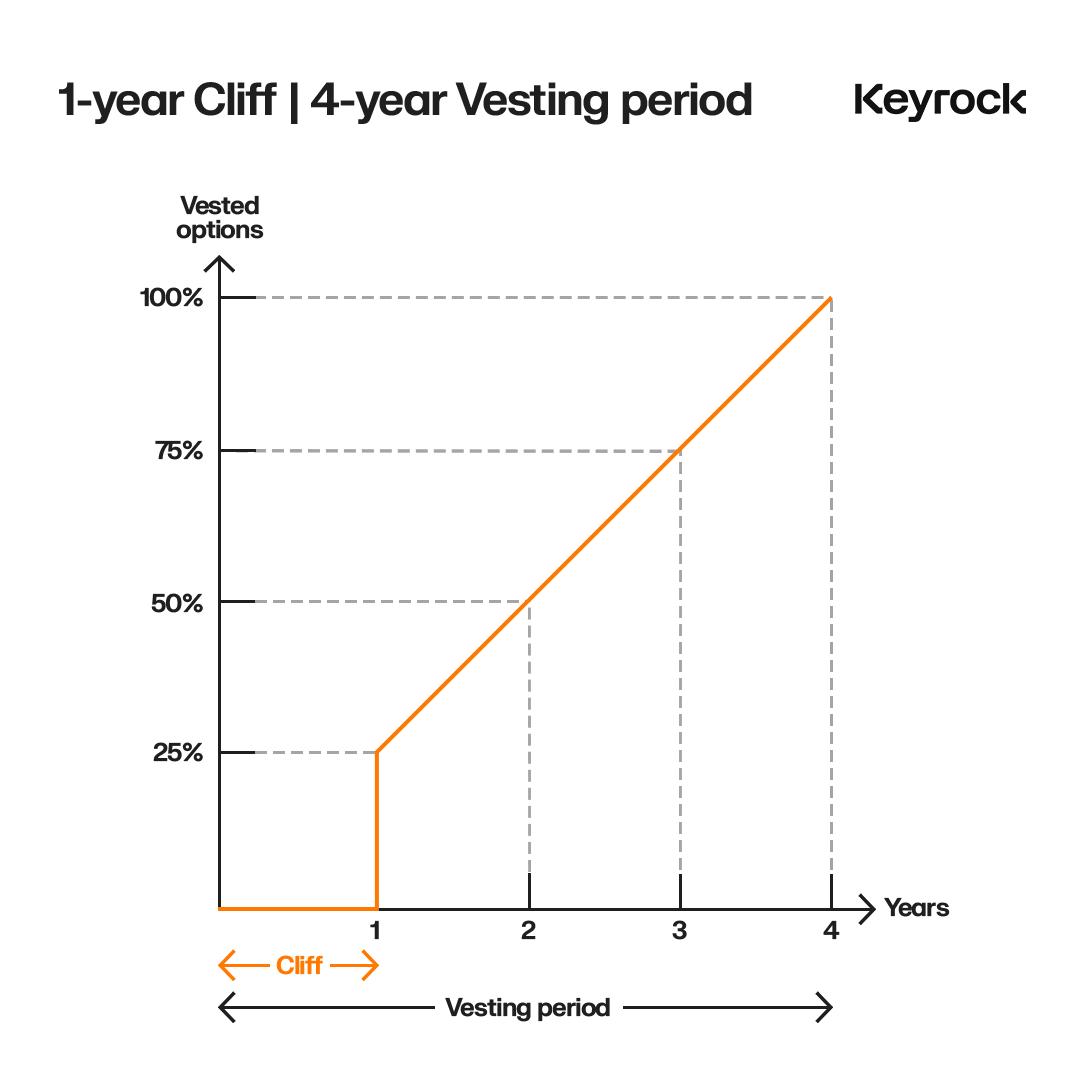
A typical unlock might look like: The vesting period starts with the relationship between the recipient and the organization, and continues until the full distribution. For most crypto projects, these are outlined in the whitepaper early on. In the first ⅓ ± ¼ of the vesting period, there may be no distribution. Then, a large chunk of tokens is released in one go, followed by a linear unlock over the remaining time.
This approach is effective because it ensures recipients make a minimum commitment before receiving rewards. For example, developers are incentivized to continue participating, while investors face an initial lockup period, followed by partial cash-outs, and a gradual unlock to mitigate market pressure.
Not all unlocks follow this structure. Some are referred to as "batch unlocks", where all tokens are released at the end of the Cliffs. Others are purely linear, with no Cliffs, distributing tokens regularly until fully allocated.
Unlock Scale, the Key Factor in Price Dynamics
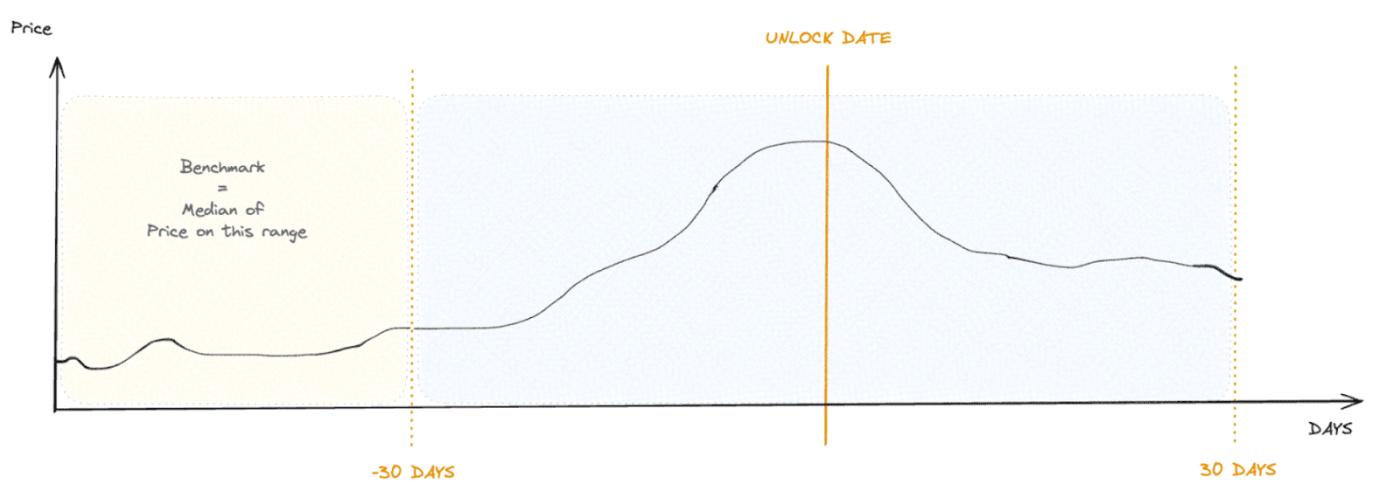
This paper first broke down the vesting periods of 16,000 composite events and categorized each event by size. For each event, it tracked the daily token price for 30 days before and 30 days after the unlock. Additionally, it tracked the "median" price and volatility metrics for the 30 days prior to the 30-day pre-unlock period. This is crucial, as many projects adopt monthly unlock schedules. This approach is not perfect, but it better isolates the smaller-scale unlocks.
Ultimately, no asset can exist independently of the market. This is especially true for Altcoins, which often exhibit extreme beta correlation with their protocol tokens. To address this, the paper standardized the price movements in the data series of each unlock to explain this.

For simplicity, the paper chose ETH as the benchmark, then weighted the prices (before, during, and after the unlock events) in the sample against ETH to derive a more market-independent metric.
Unlock Size Isn't Everything
After breaking down, categorizing, and quantifying the unlock events, plotting the average price impact over different time intervals after the unlock date reveals a messy picture. You might expect a proportional relationship between unlock size and price impact, but beyond 7 days, the correlation weakens.
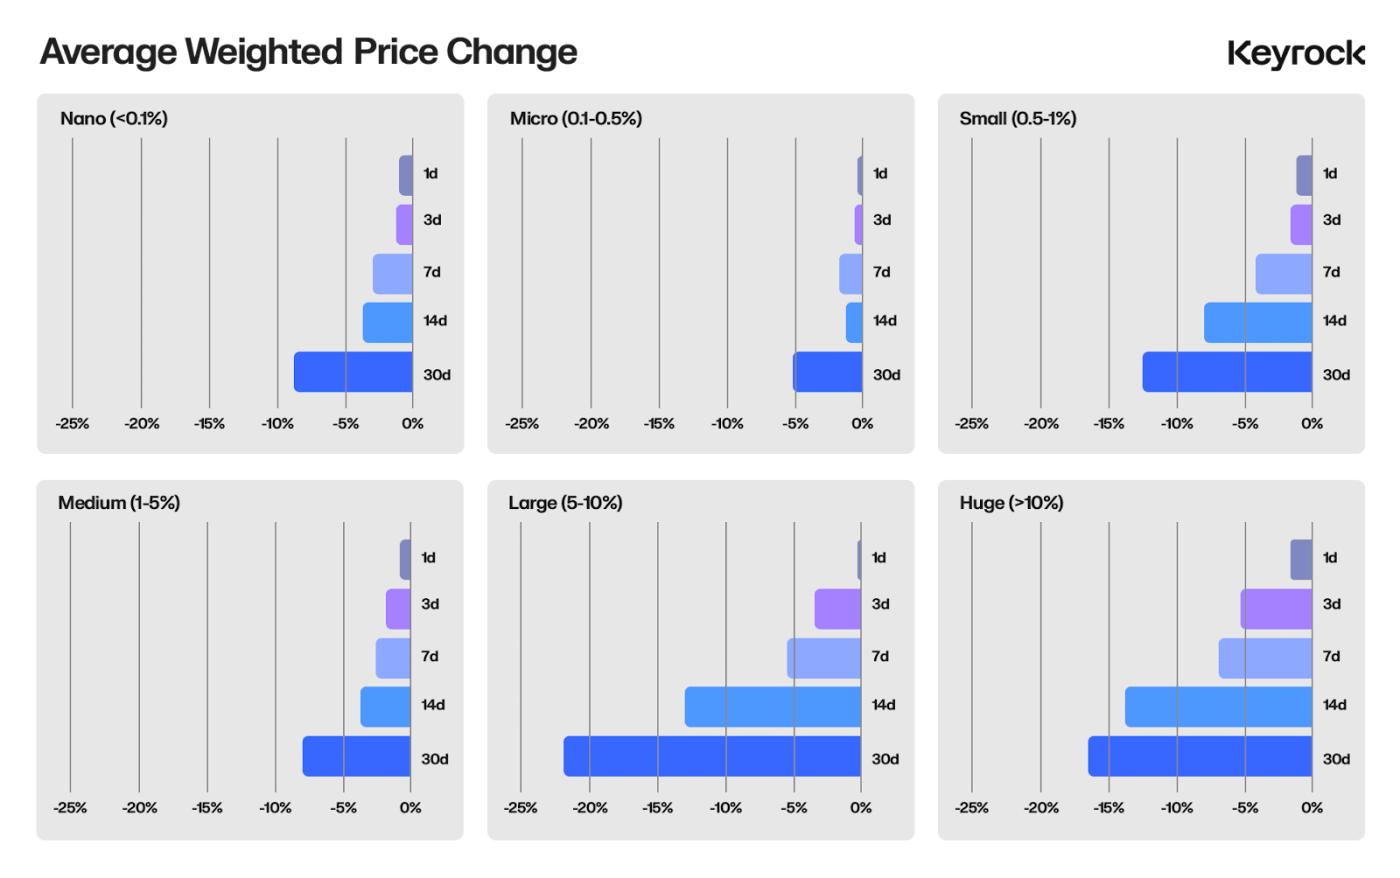
When scaled by relative size, most unlocks appear similar in the degree of price suppression they cause. Instead, frequency emerges as a more explanatory factor. As mentioned earlier, unlocks often occur in a single large batch after the initial Cliff, or continue throughout the vesting period before the end. For any unlock other than large or massive ones, a smaller, steady downward price pressure from the ongoing unlock is also observed. So it's difficult to discern the good or bad of unlock size.
Cliffs and the Linear Divide
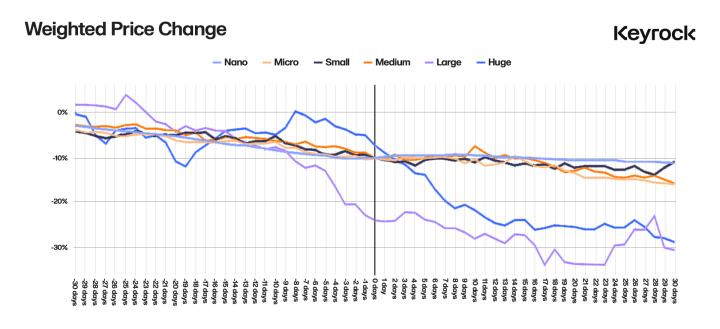
What is clearer in the data is the behavioral pattern around larger-scale unlocks before the event. In the 30 days leading up to the event, there is typically a sustained price decline, accelerating in the final week. After the unlock, prices tend to stabilize within about 14 days, reverting to a neutral level.
This price behavior can be attributed to two main phenomena:
- Sophisticated Hedging: Large unlocks are often allocated to market makers using hedging strategies. By locking in prices or leveraging volatility before the unlock, these entities can effectively reduce token pressure and mitigate the direct impact of the unlock. Most companies start hedging 1-2 weeks or even a month in advance, based on the scale. If executed well, this strategy can significantly minimize the market impact of the unlock.
- Retail Anticipation: The sharp decline in the final week is likely due to retail investors selling in advance to avoid dilution, as they are usually unaware that the unlock recipients may have already completed their sell-offs through hedging.
This behavioral pattern is also evident in the weighted trading volumes across different categories, typically peaking 28 or 14 days before the unlock.
Here is the English translation:Interestingly, the data shows that the performance of massive unlocks (> 10% of the supply) is as good or even better than that of large unlocks (5%–10%). This may be because the scale of the unlocks is too large to be fully hedged, and they cannot be sold or unwound within 30 days. As a result, their market impact tends to be more gradual and persistent.
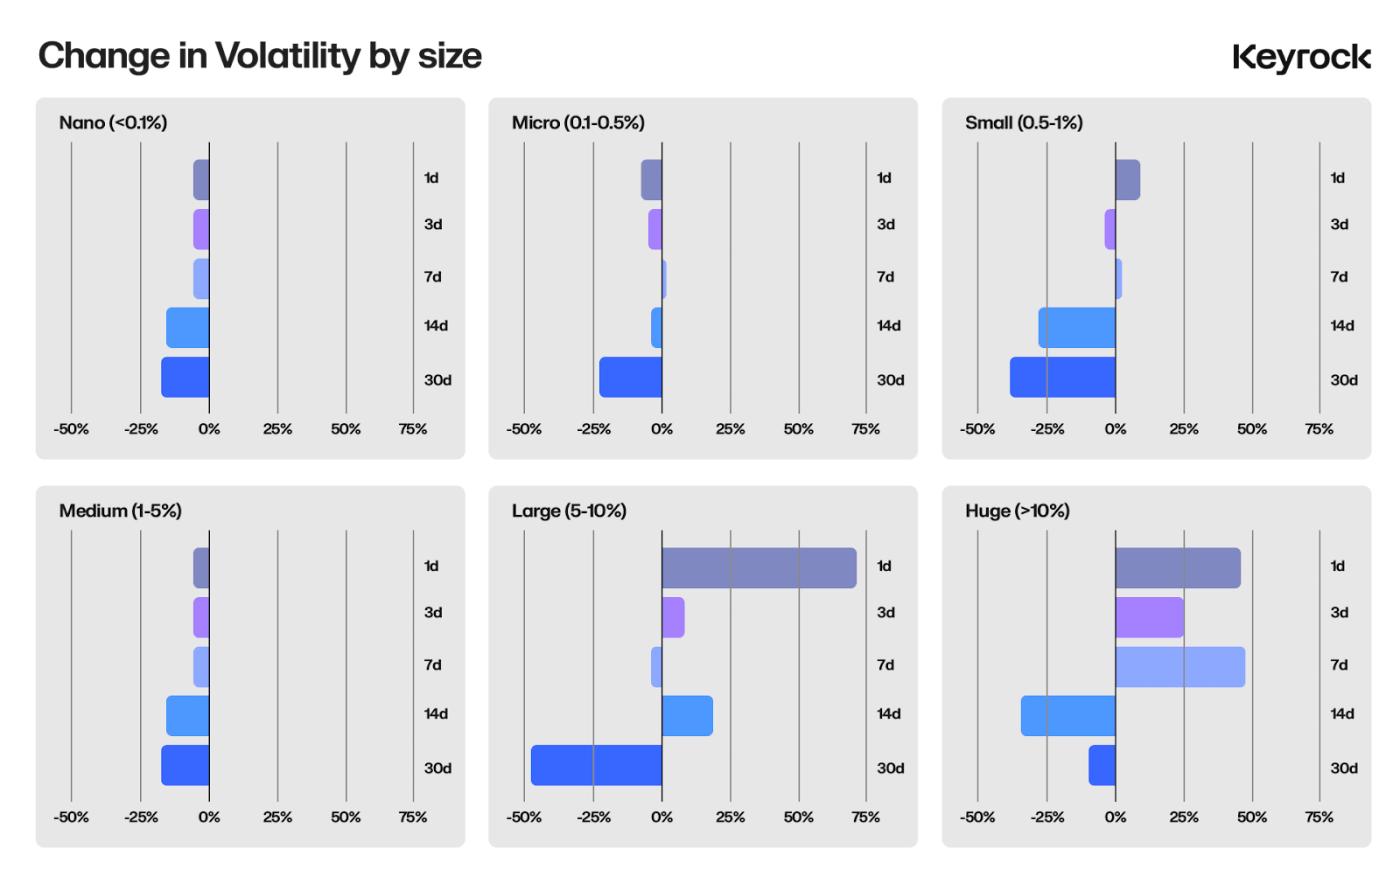
The last chart highlights the changes in volatility. Massive unlocks cause significant volatility on the first day. However, this volatility essentially dissipates within 14 days.
How to Trade?
In most cases, the key is to focus on the super-large and large unlocks on the calendar. These are often the starting Cliffs for the transition to linear unlocks. For any given unlock, the proportion granted by the Cliffs can vary greatly, from 10% to 50%. What really matters is the unlock relative to the total supply.
The data shows that the best time to enter after a major unlock is 14 days later, when volatility has stabilized, and hedging may have been unwound. For exit, the best time is 30 days before a major unlock, when hedging or market pre-reaction often begins.
For smaller-scale unlocks, it is usually best to wait until they are completed.
Recipient Type, Key Predictors of Price Impact
The second and most important factor in analyzing unlocks is the recipient type. Who are the recipients of the tokens, and what does that mean for price behavior? The recipients can vary greatly, but they typically fall into five main categories:
- Investor Unlocks: Tokens allocated to early investors as compensation for funding the project
- Team Unlocks: Tokens reserved to reward the core team, whether through a one-time payment or as salary
- Ecosystem Development Unlocks: Tokens injected into the ecosystem to fund activities like liquidity, network security, or grants
- Public/Community Unlocks: Tokens distributed to the public through airdrops, user rewards, or staking incentives
- Burn Unlocks: Tokens used solely for burning, reducing the supply. These are rare and not included in this analysis
There is no consensus on which recipient type has the greatest downstream price impact. Some argue that community airdrops are largely captured by Sybil attackers, flooding the market with sell pressure. Others believe that injecting millions of tokens into the ecosystem dilutes value. And some think VCs and investors are the fastest to sell, realizing their gains.
After analyzing thousands of unlock events, the data shows:
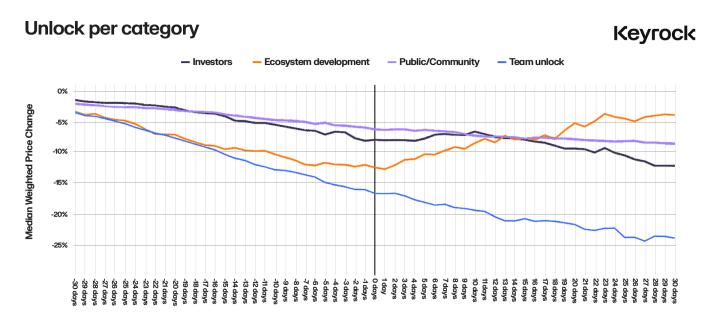
- Nearly all categories exhibit negative price impacts, but with subtle differences
- Ecosystem development unlocks have the least destructive impact, while team unlocks consistently lead to the largest price declines
- Investor and public/community unlocks have a moderate impact on prices
However, as with unlock size, these numbers alone do not tell the whole story. When you plot price trends around unlock events by recipient type, within the 30-day window, different behaviors emerge.
What Drives Recipient Behavior?
At first glance, team unlocks appear the most destructive, while ecosystem unlocks pose almost no threat. But these are surface-level insights. Why the differences? What drives the behavior of the recipients? What lessons can protocols learn from this data?
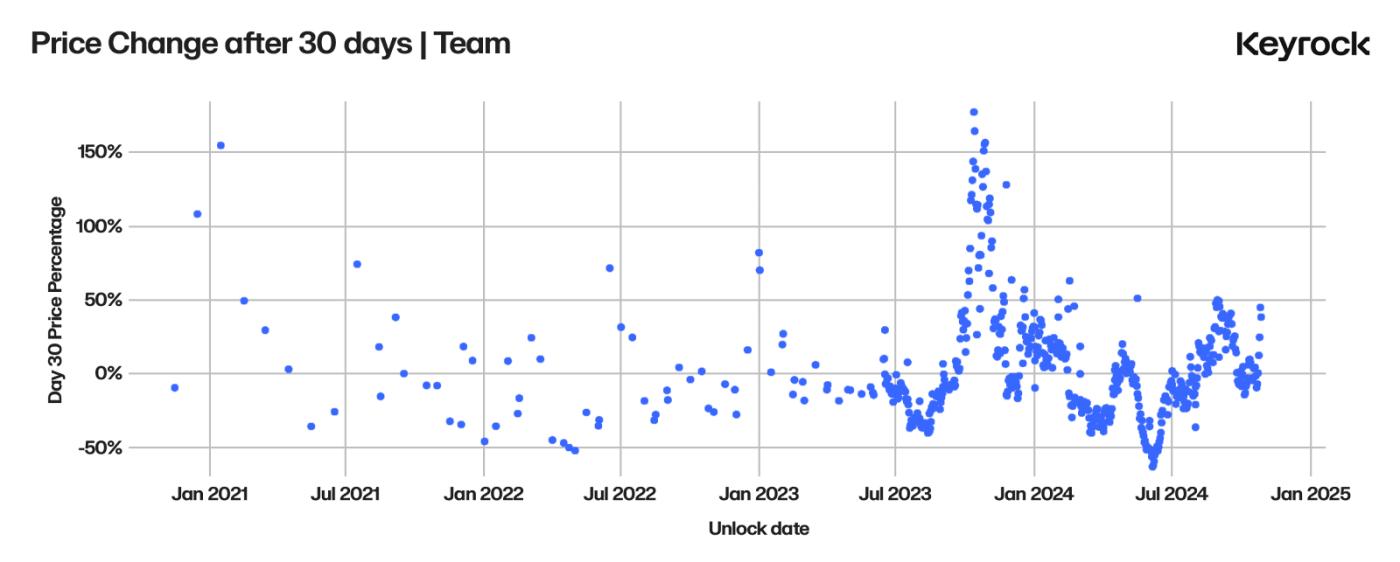
Team Unlocks
Team unlocks are among the least price-stable categories. You should be cautious when teams are approaching Cliffs or in the middle of their allocations.
When charting, the impact on token prices follows a roughly linear downward trend, starting 30 days before the unlock date and continuing at a severe angle. Team unlocks tend to have two characteristics that make them more impactful on prices than other recipient classes.
Uncoordinated selling by team members:
- Teams are typically composed of multiple participants with different financial goals, and they lack a coordinated method to liquidate their tokens
- Many team members view their tokens as compensation for long-term (sometimes years-long) labor, only receiving proper remuneration when these tokens unlock. When these tokens unlock, especially near Cliffs, the incentive to realize gains is high, and understandably so
- Even with linear unlocks, these tokens are often part of their income stream, necessitating sales
Lack of hedging or mitigation strategies:
- Unlike large investors or institutions, teams rarely employ sophisticated techniques to reduce market impact when selling
- Experienced entities often recruit market makers to strategically manage large token distributions
- Additionally, pre-hedging strategies can reduce the direct pressure on the market over time as unlocks occur
So this explains the severe negativity, but why the price decline even 30 days prior? This is likely a combination of the severe price impact and overlapping linear unlocks. Why try to control the median price beforehand, as many unlocks are consecutive, and the data still shows suppression. In this regard, if you try your best, not only skip batch Cliff unlocks, but also delay purchases during the linear period of the unlocks.
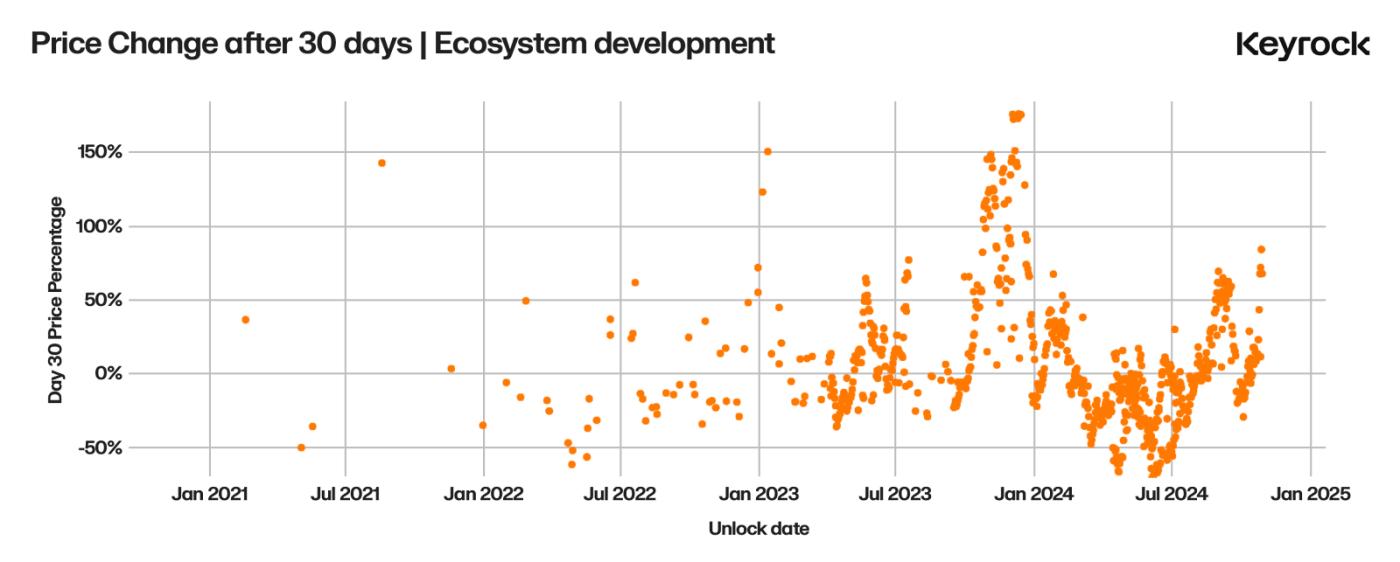
Ecosystem Development Unlocks
On the ecosystem development side, a unique trend emerges: a slight price decline in the 30 days prior to the unlock, followed by an immediate positive price impact after the unlock. Unlike other unlock types, ecosystem development unlocks typically channel tokens into initiatives that create long-term value and strengthen the protocol.
Why the price rebounds (and often increases) after the unlock:
- Liquidity Provision: Tokens are often allocated to lending platforms or liquidity pools, increasing market depth, reducing slippage, and enhancing overall token availability. By boosting "market availability," these unlocks can not only stabilize trading conditions but also bolster participant confidence
- Participation Incentives: Ecosystem funds often drive user engagement through incentive programs. These initiatives (e.g., liquidity mining or staking rewards) create a flywheel effect of participation, driving network activity. As participants recognize the potential for sustained growth, they are less likely to sell immediately and instead choose to further invest in the ecosystem
- Grants and Infrastructure Funding: Developer grants and infrastructure project funding support the creation of dApps and the scalability of the network. While the returns on these investments typically take 6-12 months to materialize, they signal a long-term commitment to ecosystem growth, mitigating short-term sell pressure
How to explain the pre-unlock price decline then? There are two drivers behind this behavior.
- Anticipated Selling: As mentioned earlier, many investors sell in advance of the unlock, believing the increase in token supply will dilute value, regardless of the unlock's purpose. This is particularly common among retail participants, whose misunderstanding of unlock types drives short-term decision-making.
- Liquidity Preparation: Large recipients of grants or allocations often need to prepare liquidity in advance. For example, to establish liquidity pools on a DEX, recipients may sell existing assets to ensure stable coin or other pairing assets. This preparatory selling can create downward price pressure even before the tokens are deployed.
Investor Unlocks
Token unlock is one of the most predictable events in the token market. Unlike other categories, these unlocks typically exhibit controlled price performance, with data from 106 unlock events showing a consistent trend: a slow, minimal price decline. This stability is no accident. Early investors (whether angel or Series C) often have a VC background and possess the professional expertise to manage their positions.
These investors are not merely transferring risk; they actively avoid potential market disruptions while optimizing returns. By understanding the sophisticated strategies they employ, traders can anticipate how these events will unfold and adjust their positions accordingly.

OTC Desk: Investors often hire liquidity providers or OTC desks to directly sell large amounts of tokens to interested buyers. This method completely bypasses the public order book, avoiding immediate selling pressure and signals to the market.
TWAP and Hedging: Time-Weighted Average Price (TWAP) execution or Volume-Weighted Average Price (VWAP) strategies help to distribute token sales over time, reducing price impact. Many investors also use futures to pre-hedge their positions, effectively "locking in" the price before the unlock event. They then gradually unwind these positions after the unlock, further reducing volatility.
"Locking" or "hedging" essentially involves taking a short position in derivatives before the unlock date, helping to secure the price when unwinding the short position as the tokens are sold.
Since 2021, the use of advanced options strategies has expanded beyond just investors, with more and more project teams adopting them to generate recurring revenue or manage funds more effectively. For traders, this evolution reflects the increasing complexity of the crypto market, unlocking opportunities to anticipate and align with the strategies of key participants. Options, whether privately sold or used as loan collateral, play a crucial role in shaping market dynamics, providing informed traders with a clearer perspective to interpret token activity.
Community and Public Unlocks
Community and public unlocks, such as airdrops and rewards-based programs, reflect investor unlock behavior in their gradual price declines before and after the event. This dynamic is shaped by two distinct behaviors among the recipients:
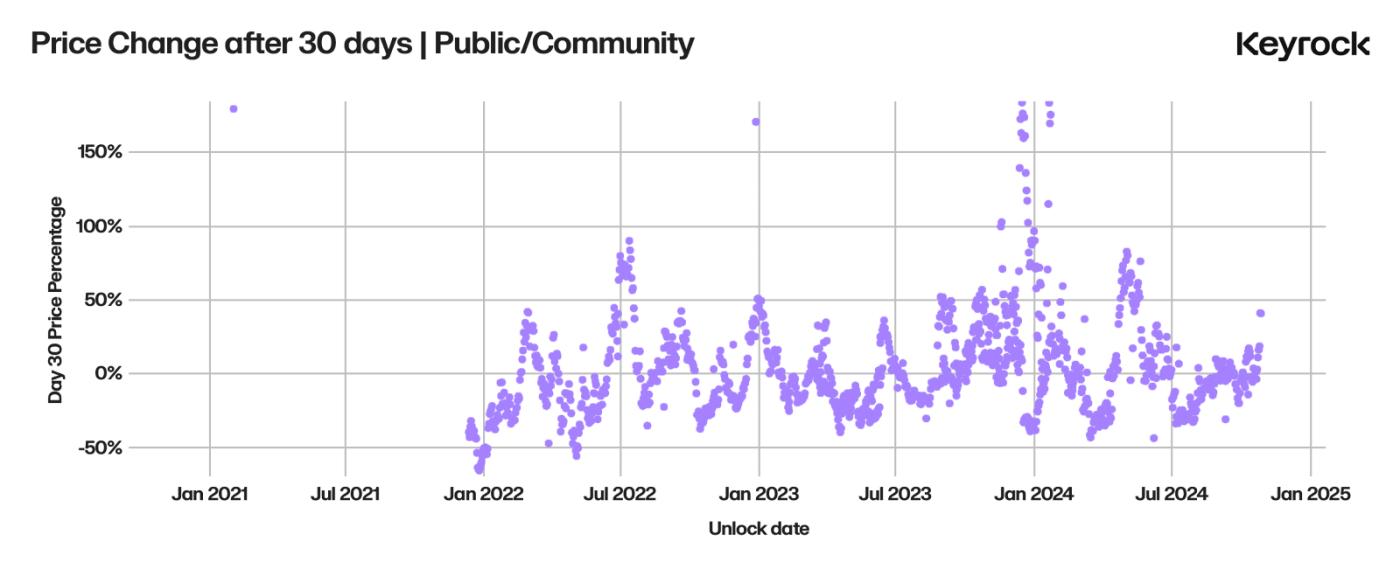
- Immediate Selling: Many retail participants liquidate their rewards immediately, prioritizing liquidity.
- Long-Term Holding: Most public airdrops are held rather than sold, reflecting a cohort of participating users or less active traders.
While the overall price impact is relatively minor, these outcomes highlight the importance of carefully designed reward programs. Thoughtful design can prevent unnecessary market disruption while achieving the intended goals of community development and engagement.
Conclusion
Token unlocks are an essential mechanism in the crypto ecosystem, used to fund development, incentivize participation, and reward contributors. However, their timing, scale, and recipient categories are key factors determining their price impact. Understanding what these impacts are and why they occur helps to make better trades and assists protocols in better structuring their unlocks.
The analysis of over 16,000 unlock events across 40 tokens highlights key trends:
- Linear unlocks are less disruptive to prices in the short term than initial Cliffs, although larger Cliffs typically recover better after 30 days.
- The most significant price movements often come not from token recipients, but from retail reactions to narratives and broader sentiment.
Recipient Category Dynamics
- Ecosystem Unlocks: Consistently positive outcomes, driving growth through liquidity provision, user incentives, and infrastructure financing.
- Investor Unlocks: Minimal disruption due to complex strategies like OTC sales, TWAP/VWAP execution, and options hedging.
- Team Unlocks: The most disruptive category, with poor coordination and immature sell-off methods leading to significant price drops. Teams can mitigate the impact by collaborating with market makers.
- Community Unlocks: Limited long-term impact, as many recipients hold the tokens, but short-term "miners" often sell to realize immediate gains.
Conclusion
Before making long-term trades, be sure to check unlock calendars using tools like CryptoRank, Tokonomist, or CoinGecko. Unlock events are often misunderstood, but they play a crucial role in token performance.
Contrary to popular belief, VC and investor unlocks are not the primary drivers of price declines. These participants are typically aligned with the long-term goals of the protocol, employing strategies that limit market disruption and maximize returns. Instead, team unlocks require closer attention, as mismanaged distributions often lead to downward pressure on token prices. Ecosystem unlocks present a unique opportunity, often serving as catalysts for adoption and liquidity when aligned with clear growth objectives, making them favorable entry points.
Related Reading: How to Break the Token Unlock Selling Pressure Dilemma? Hack VC Proposes Two Potential Solutions


