Bitcoin (BTC) has seen a noticeable decrease in buying pressure in recent days. The cryptocurrency price continues to fluctuate between $98,000 and $100,000. This reduction in upward momentum suggests that BTC has not yet prepared for the next rally.
Instead, it indicates that the price may continue to trade without much variation.
Decrease in Bitcoin Accumulation
One of the indicators showing the decrease in Bitcoin buying pressure is the Stablecoin Supply Ratio (SSR). SSR measures the ratio of the cryptocurrency's market capitalization to the total market capitalization of all circulating stablecoins.
A low SSR indicates high buying power in stablecoins. This suggests that there is ample stablecoin liquidity, which could drive price appreciation if converted to cryptocurrencies. Conversely, a high SSR reflects low stablecoin liquidity relative to the cryptocurrency's market capitalization, indicating weak BTC buying power or limited demand.
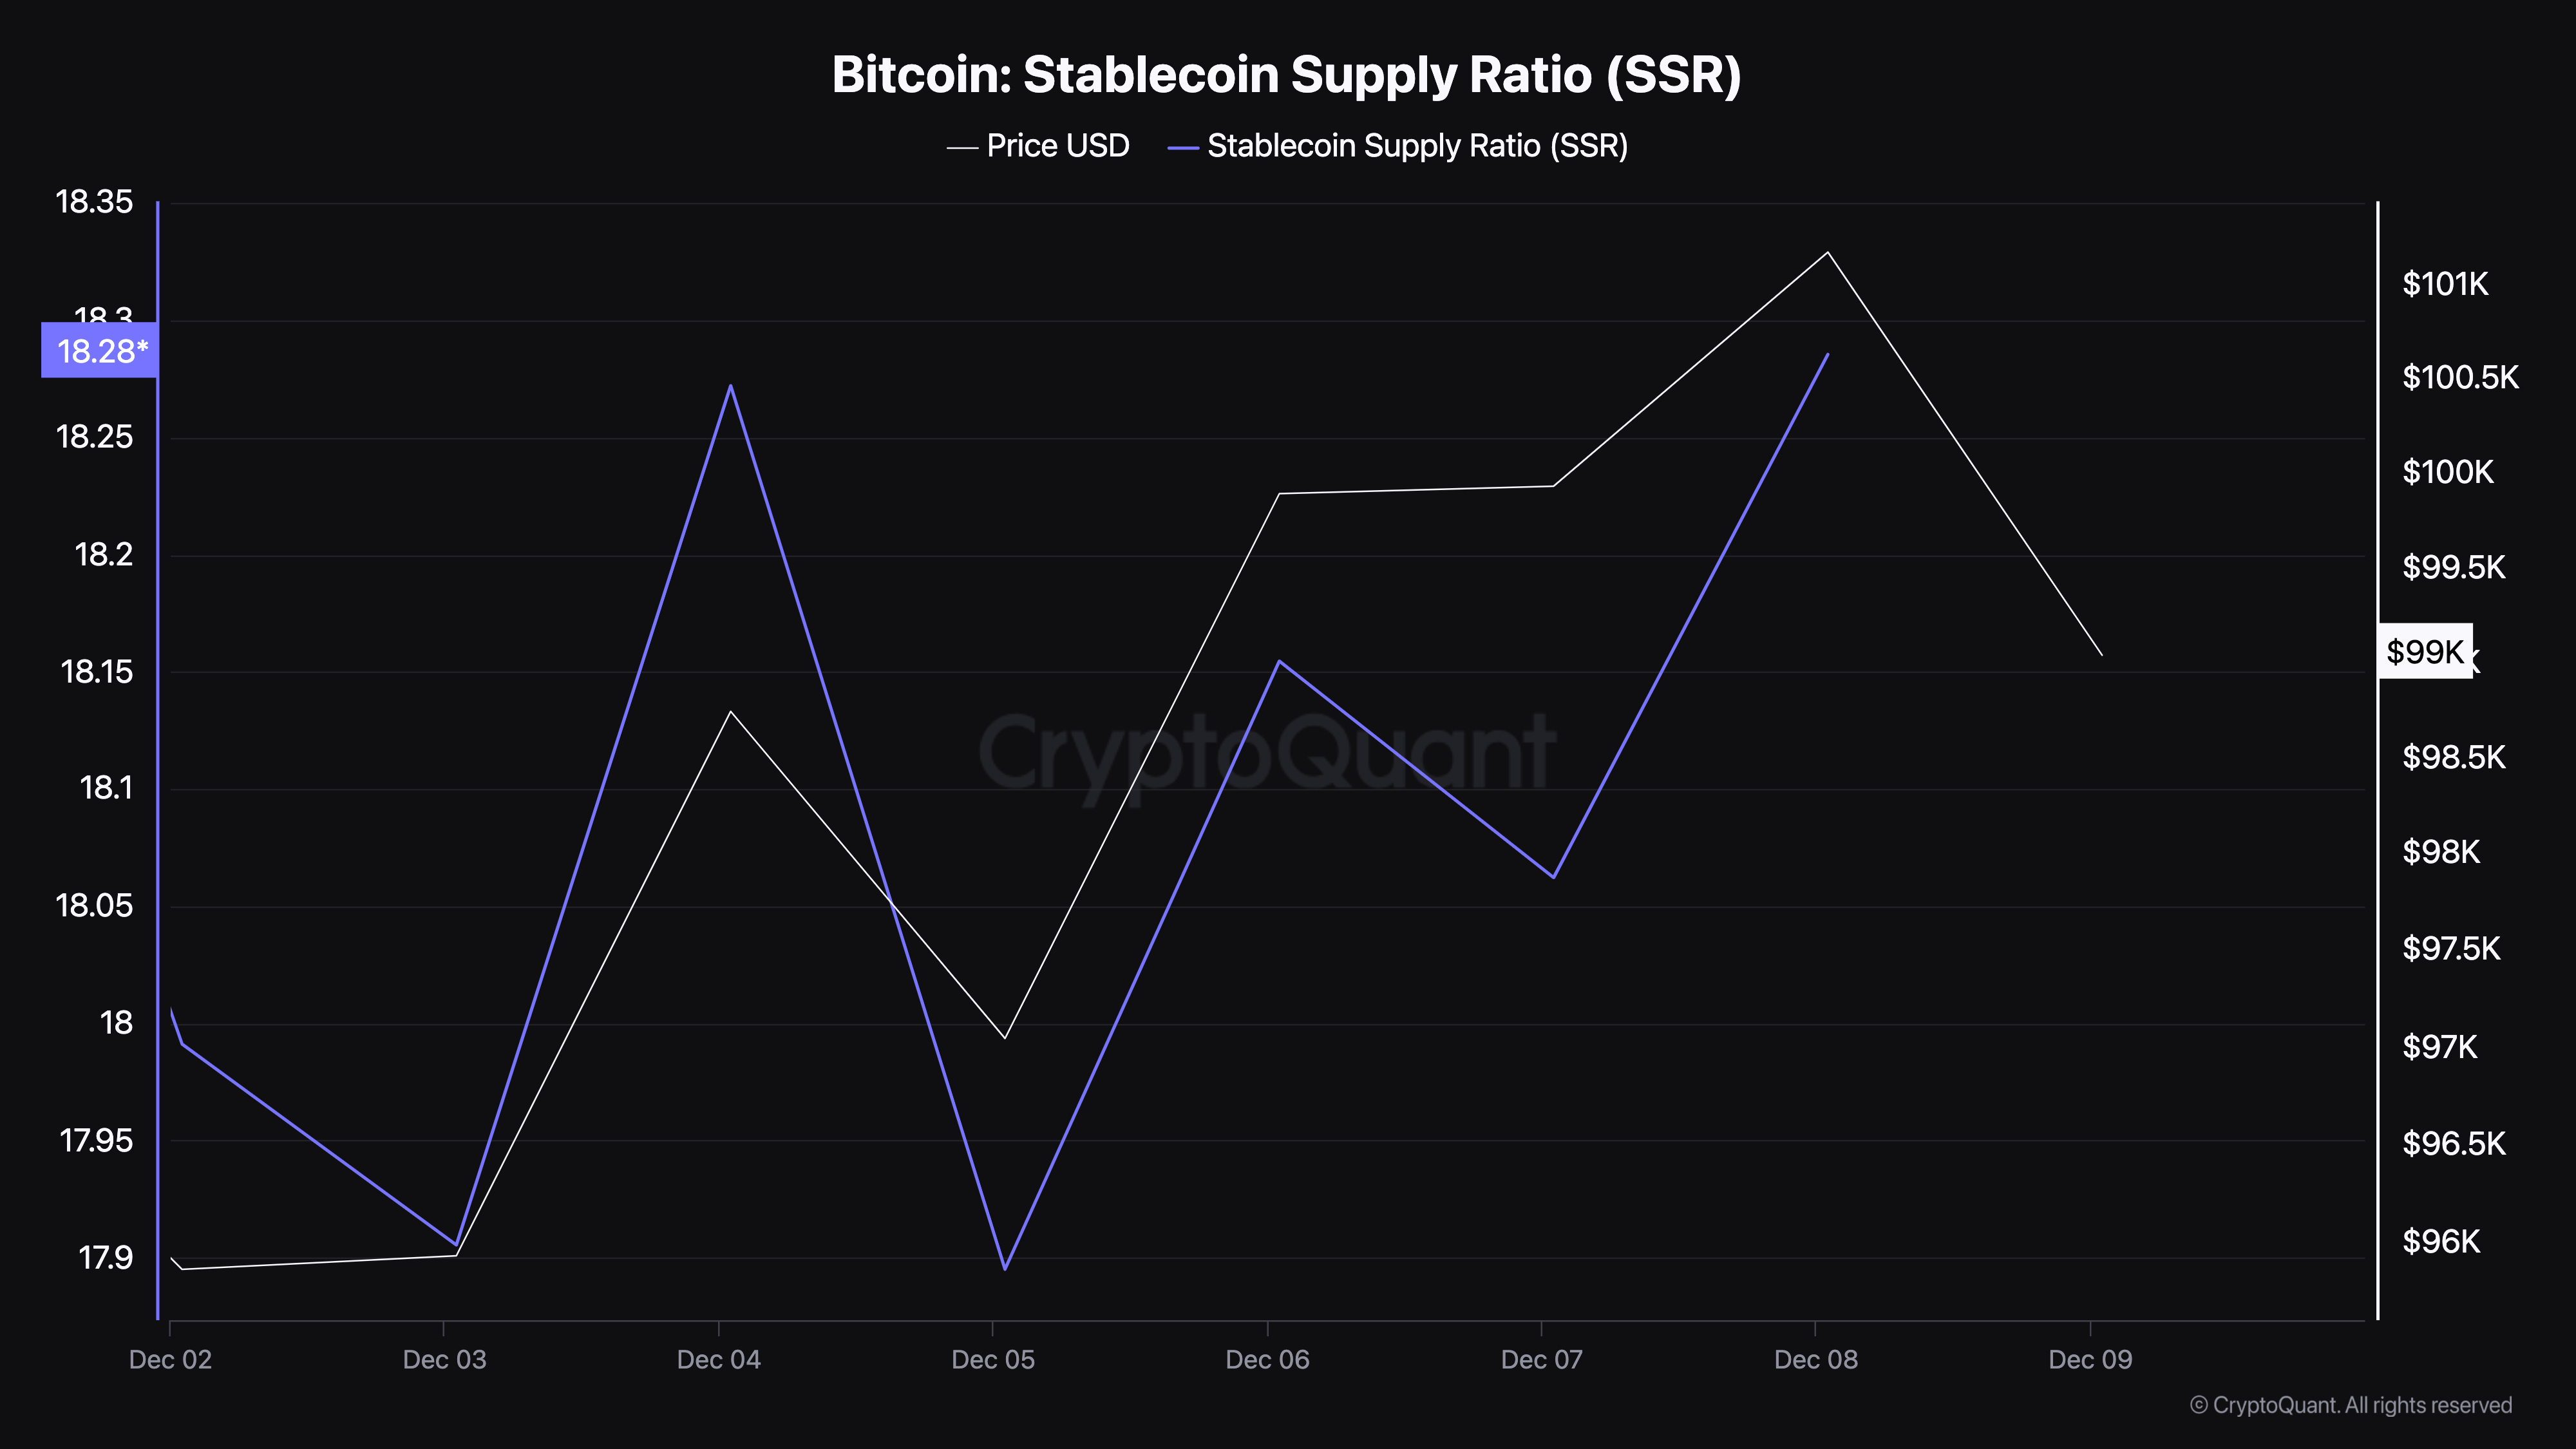
According to the on-chain analytics platform CryptoQuant, the Bitcoin SSR has surged to 18.29. The above condition suggests that buying power is no longer strong. Therefore, Bitcoin prices may continue to trade below the all-time high of $103,900.

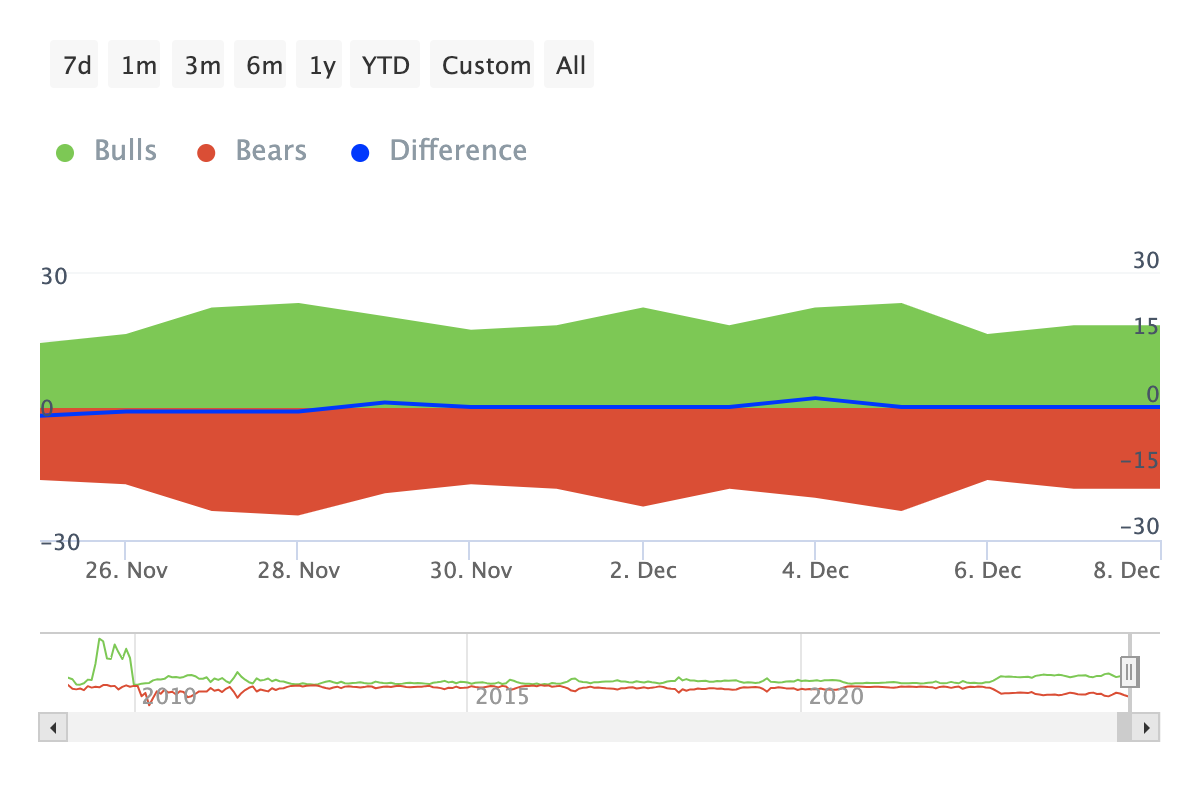
Another indicator suggesting the same is the Bulls and Bears metric. For context, Bulls are addresses that have purchased at least 1% of the total trading volume over a specific period, while Bears are those who have sold a similar amount.
If the Bulls outnumber the Bears, it increases the likelihood of BTC price appreciation. However, if the Bears dominate, the opposite occurs. According to data from the on-chain data platform IntoTheBlock, the number of Bulls and Bears has remained the same over the past 7 days.
This indicates that Bitcoin Bulls have not been purchasing more coins to drive the price higher. If this trend continues, BTC prices may continue to consolidate.

BTC Price Prediction: Potential for Correction in the Near Term
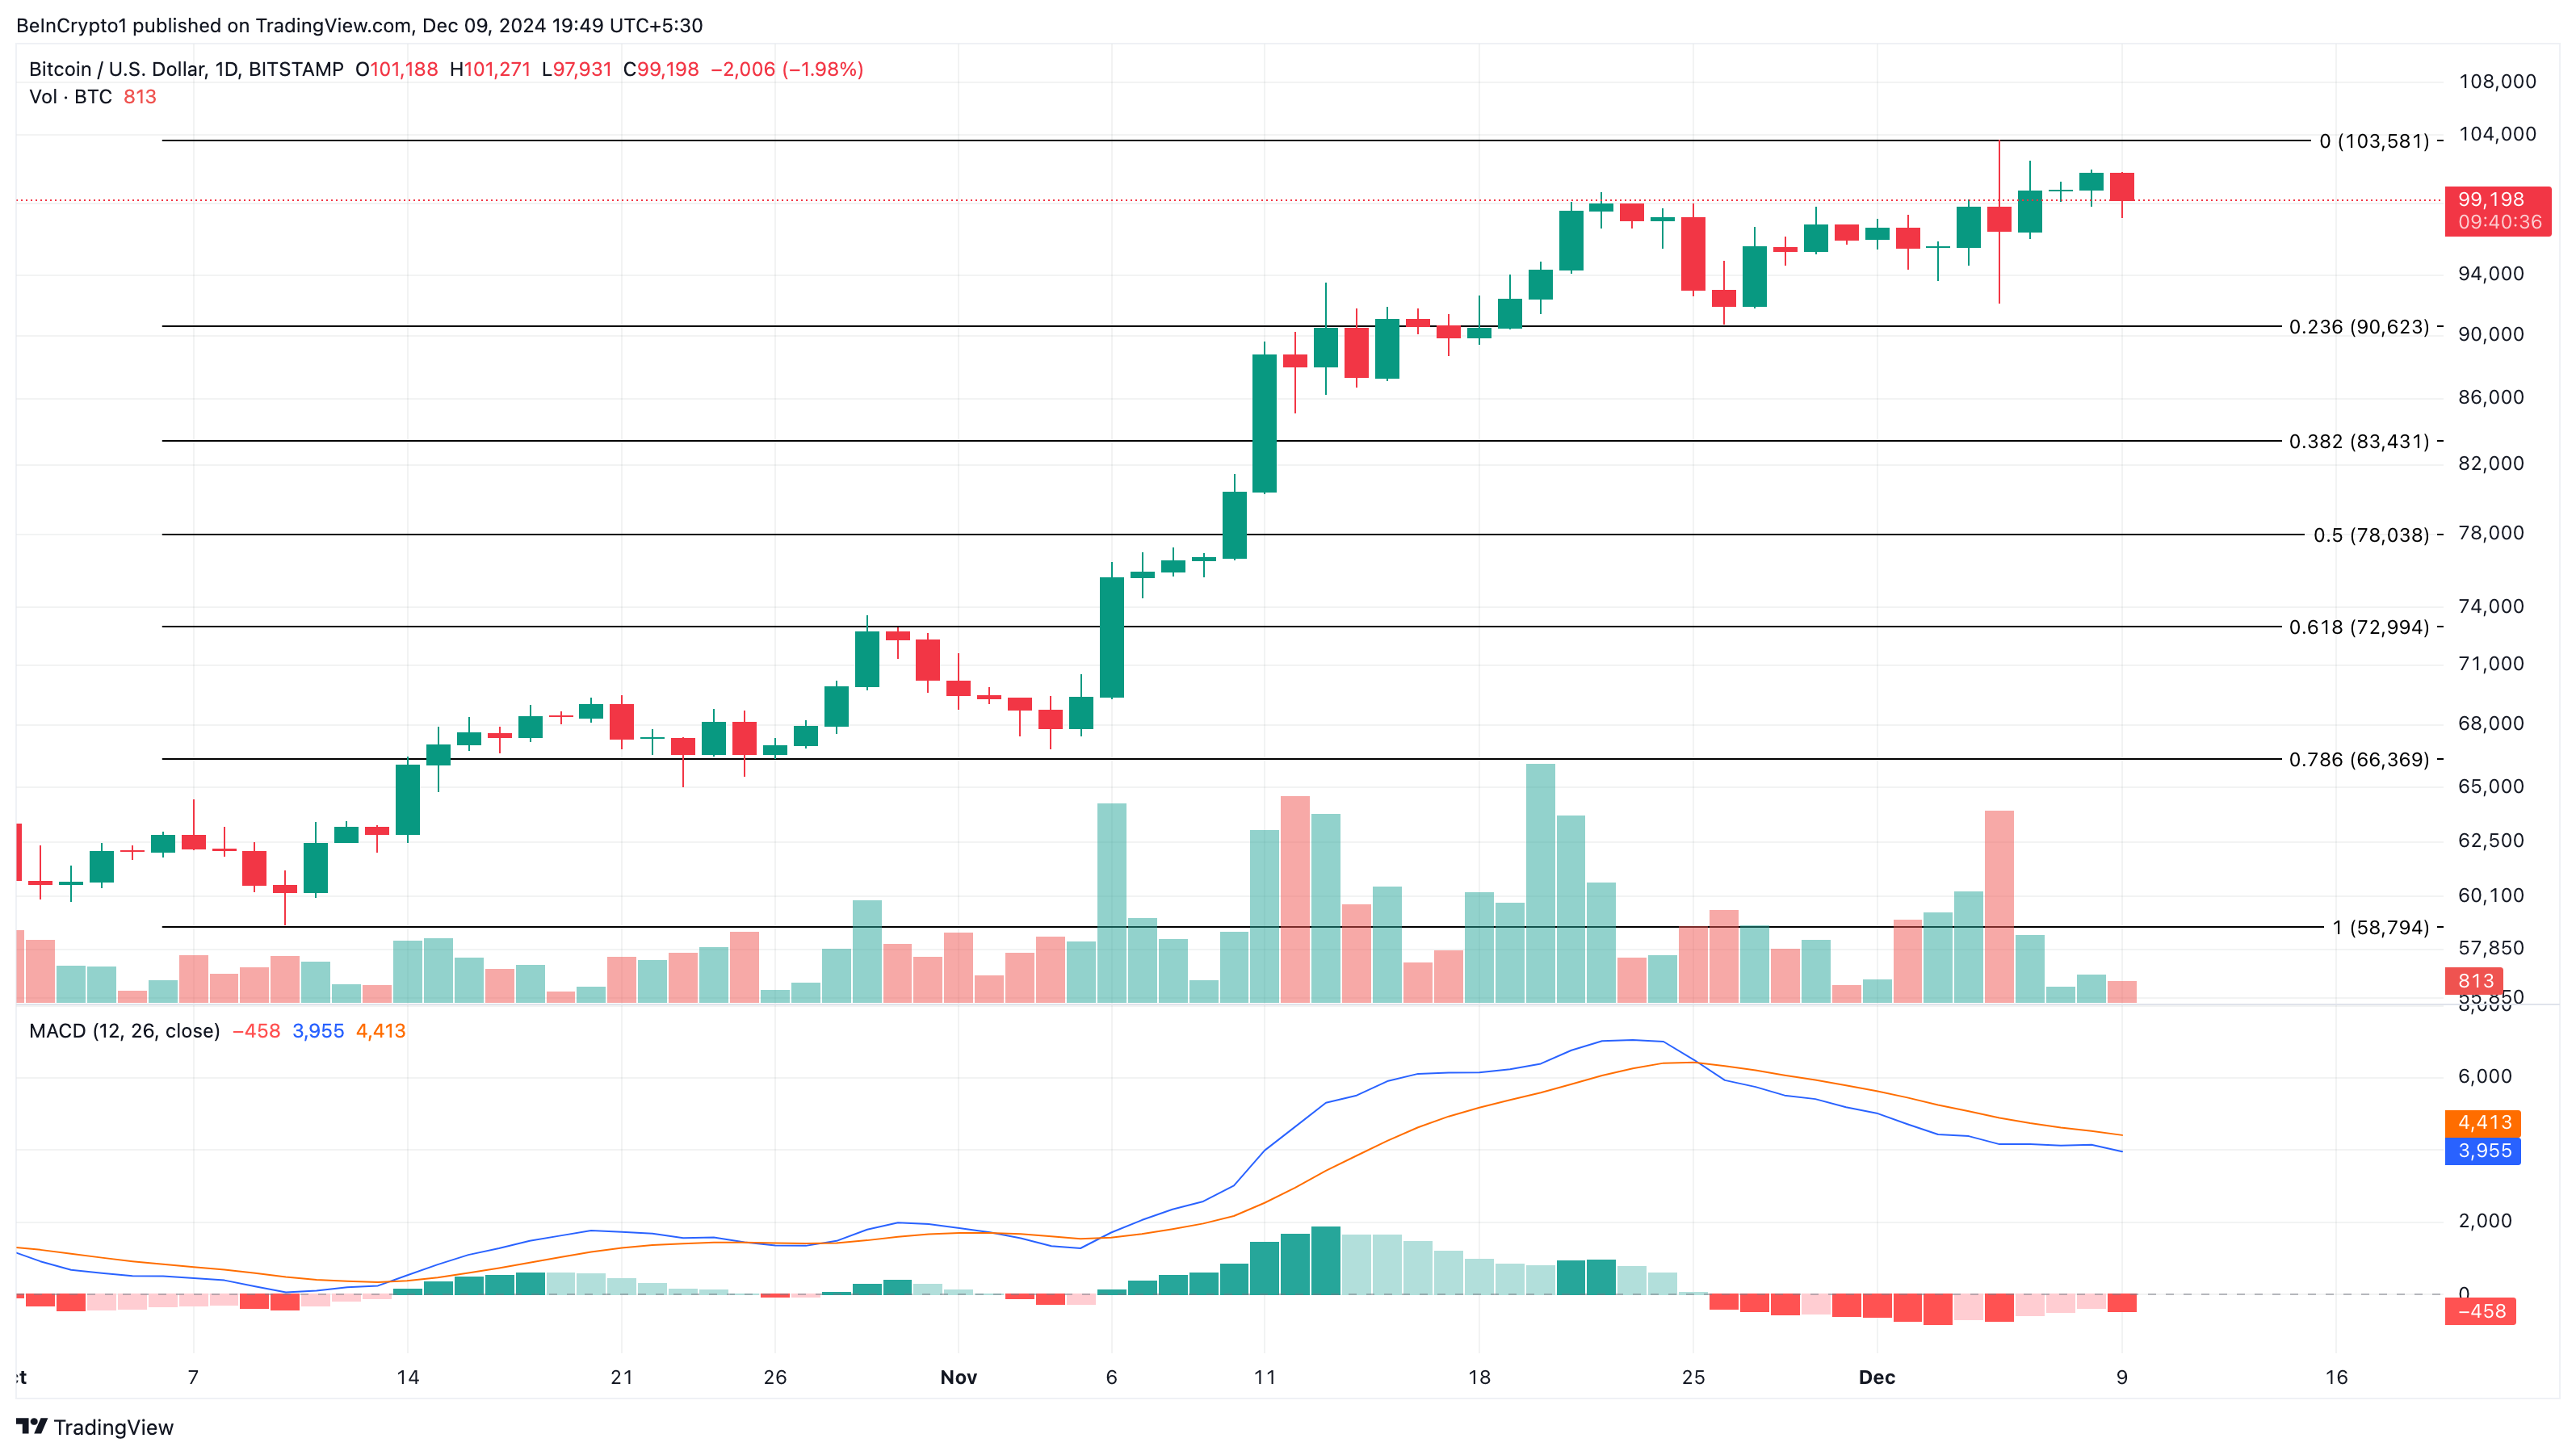
On the daily chart, the Moving Average Convergence Divergence (MACD) has dipped into the negative territory. MACD measures the momentum of the cryptocurrency.
When MACD is positive, the momentum is bullish. However, in this case, the momentum is bearish, suggesting that BTC prices may not experience a significant upward surge in the short term. The position of the indicator reflects the decrease in Bitcoin buying pressure.

If this condition persists, Bitcoin prices have a high likelihood of dropping to $90,623. However, if buying pressure increases and Bulls make large purchases, the coin price could rise to $103,581.


