Bit(BTC) fell 5% last week. At the time of writing this, the major coins are trading at $96,905, and it still seems difficult to recapture the important milestone of $100,000.
Interestingly, the recent decline did not trigger a wave of selling. This suggests that the bullish sentiment remains strong, and market participants expect the price of the coin to surpass $100,000 again in the near future.
Decreased Bit(BTC) Selling
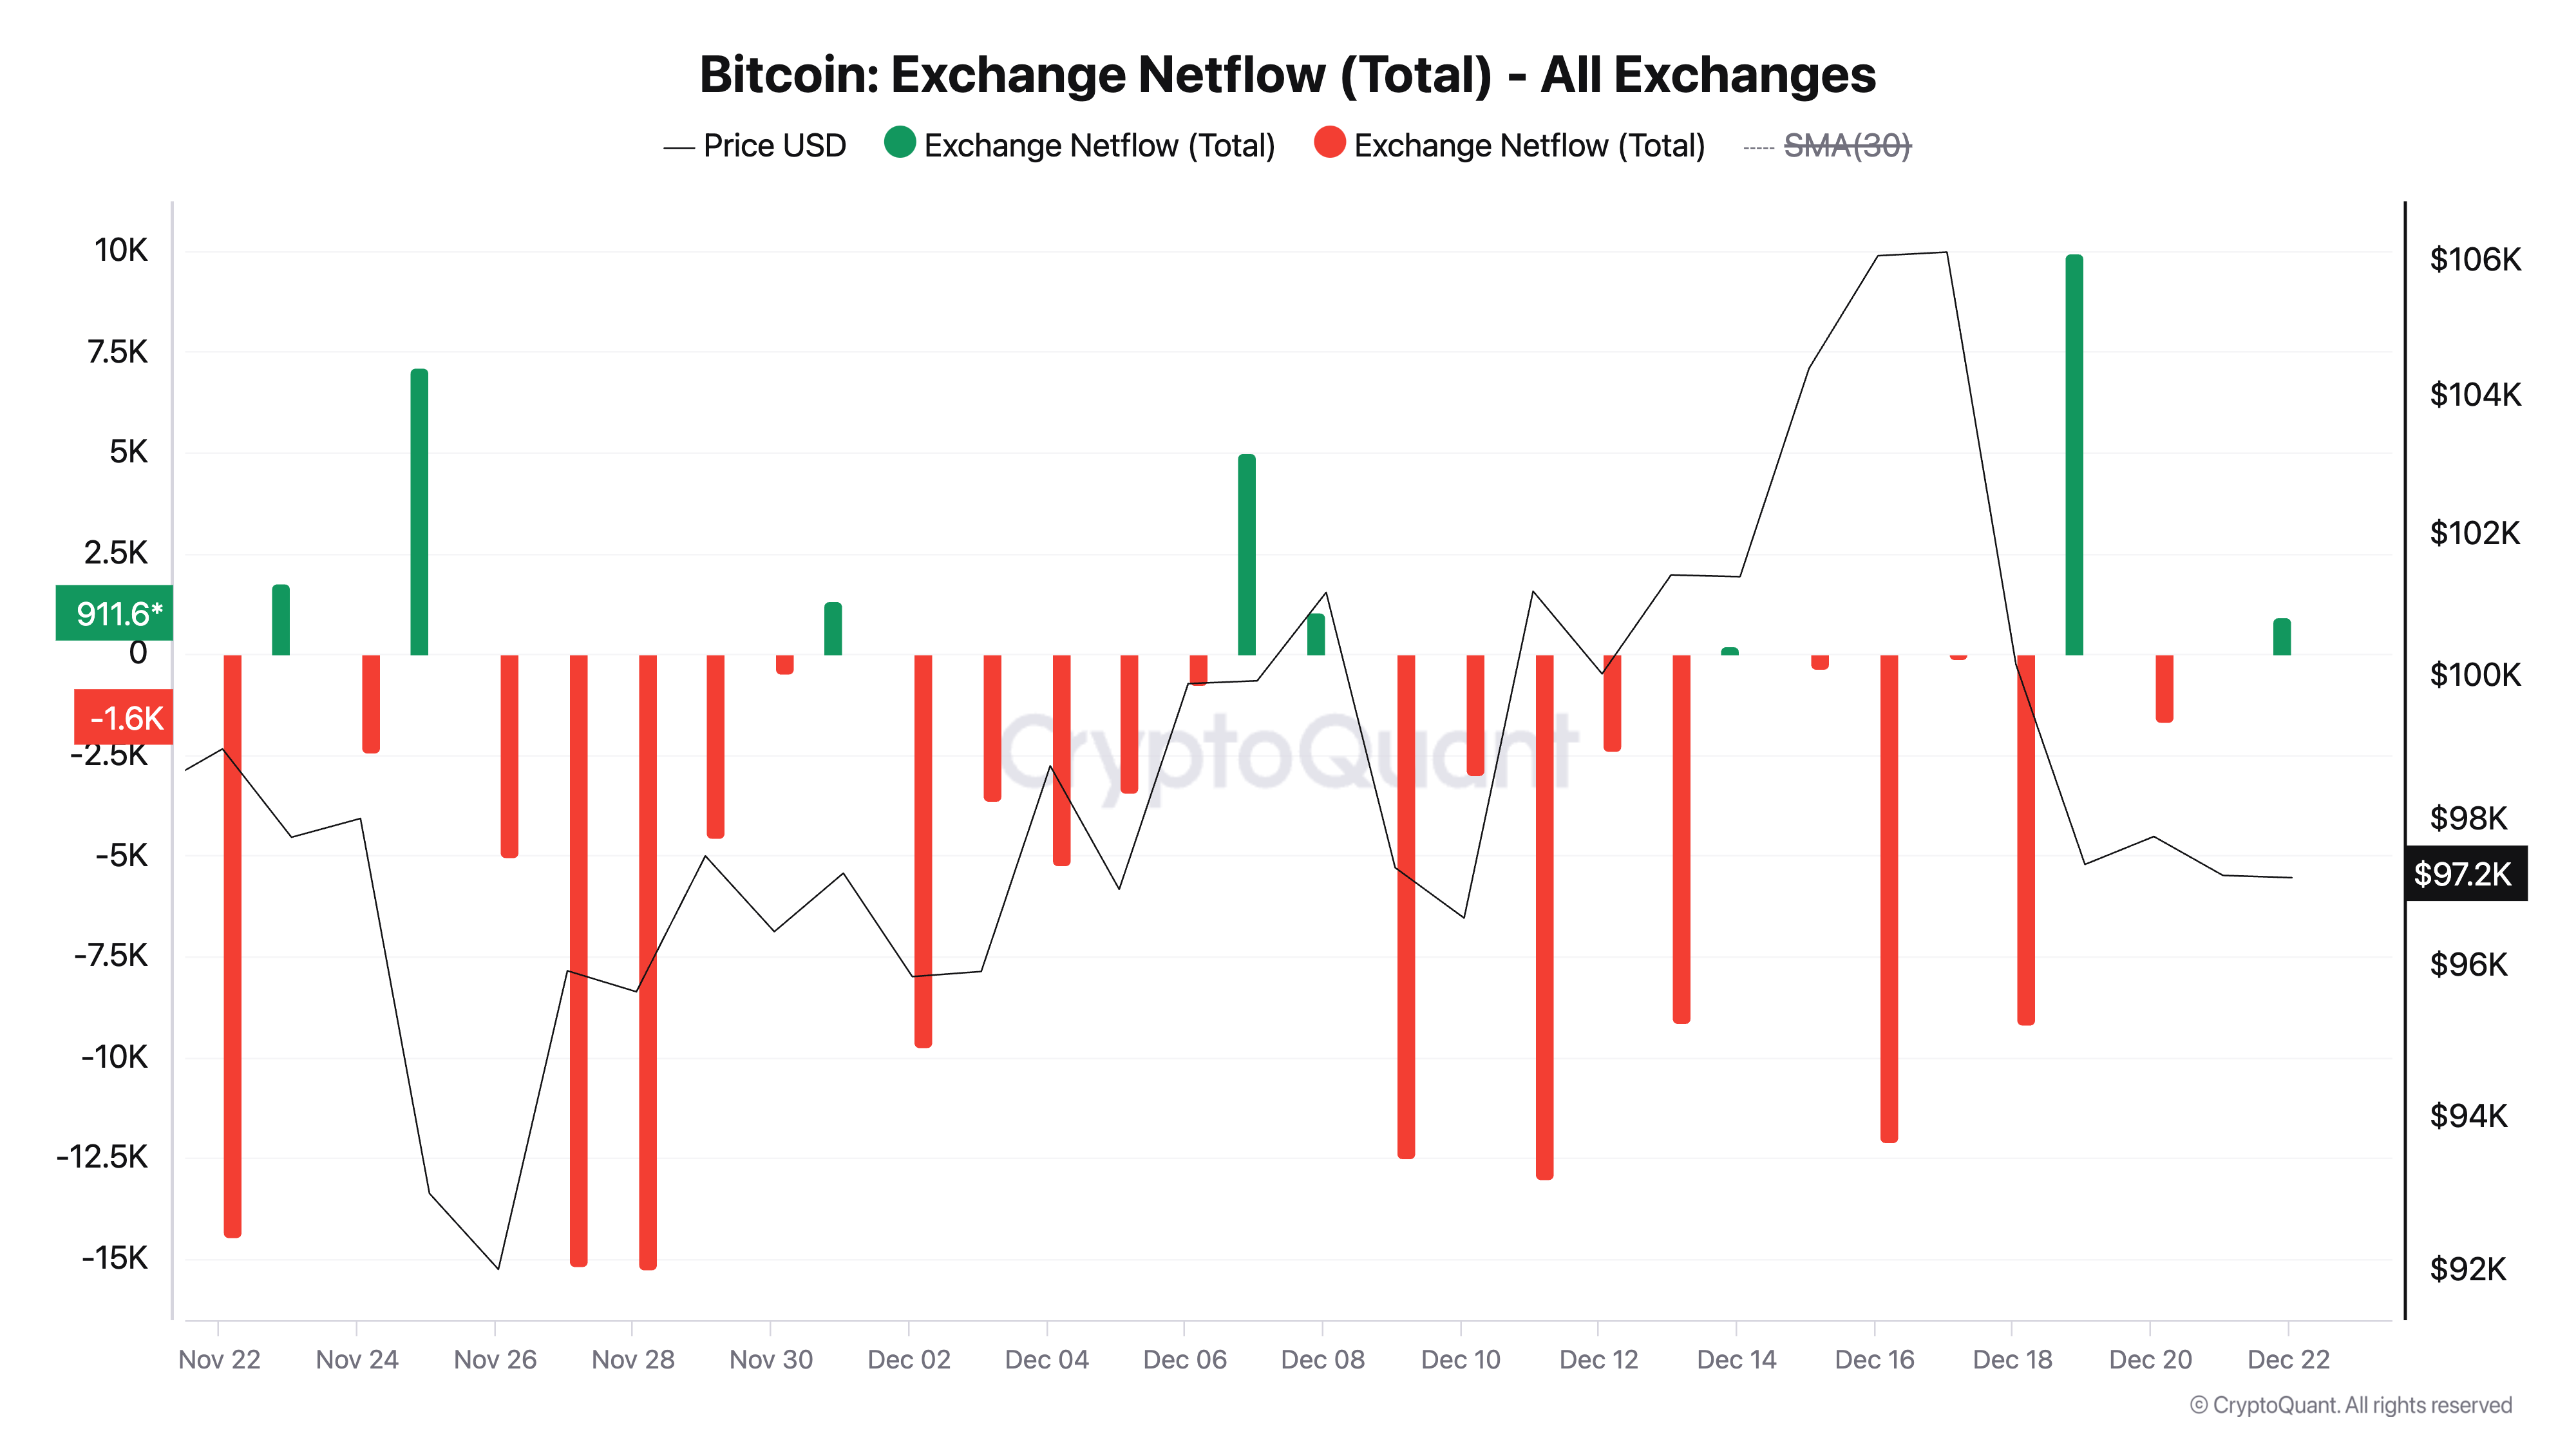
According to data from the on-chain cryptocurrency platform Crypto.com(CryptoQuant), last week the net outflow of Bit(BTC) from cryptocurrency exchanges exceeded $2.5 billion. Net outflow from exchanges tracks the amount of coins or tokens withdrawn from exchange wallets.
A surge in asset outflows from exchanges indicates a movement to hold the assets in personal wallets rather than trade or sell them. This often signals bullish sentiment, and investors may expect price appreciation.

Regarding the impact on Bit(BTC), the anonymous Crypto.com(CryptoQuant) analyst KriptoBaykusV2 recently stated:
"If the trend of Bit(BTC) outflows continues, it could reduce the selling pressure in the market. As the available Bit(BTC) on exchanges decreases and demand remains the same or increases, the price could gain upward momentum."
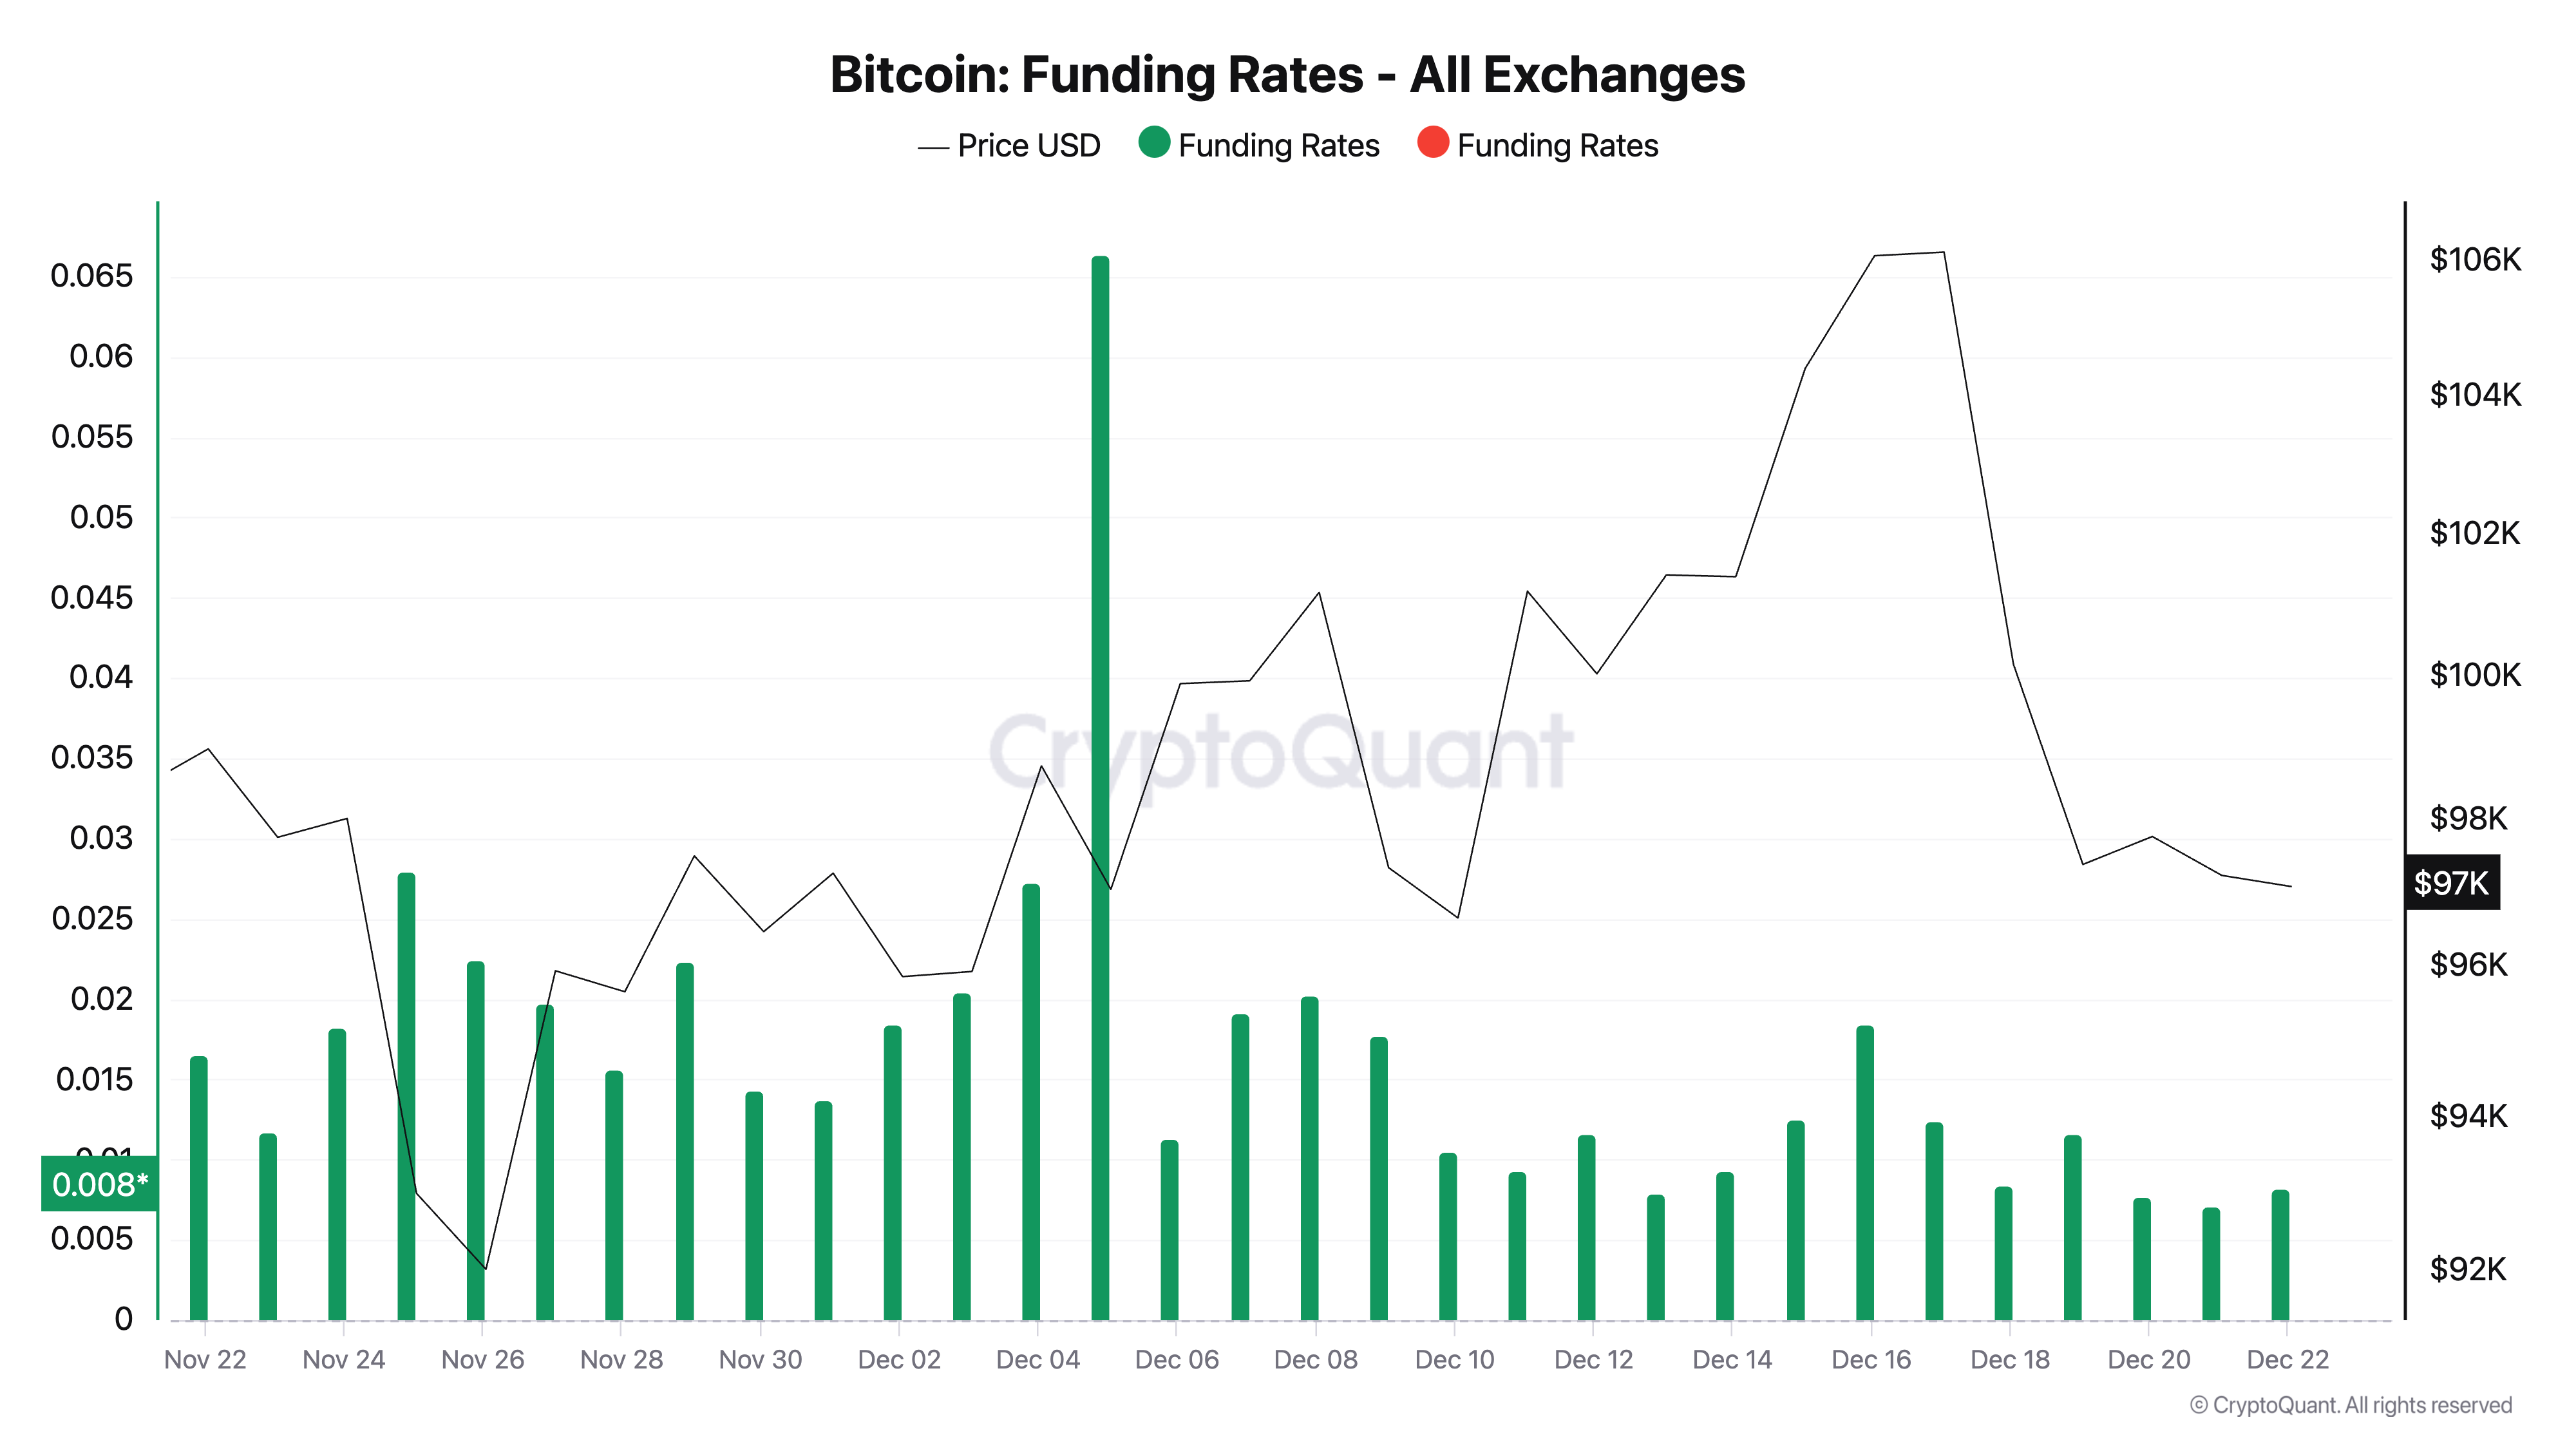
Additionally, the positive funding rates of the coins support this bullish outlook in the short term. The current funding rate in the perpetual futures market is 0.0081.

When an asset's funding rate is positive, it means that long positions are paying a cost to short positions. This indicates bullish market sentiment, as traders expect the price to rise.
Bit(BTC) Price Prediction: Will it Break the $100,000 Resistance?
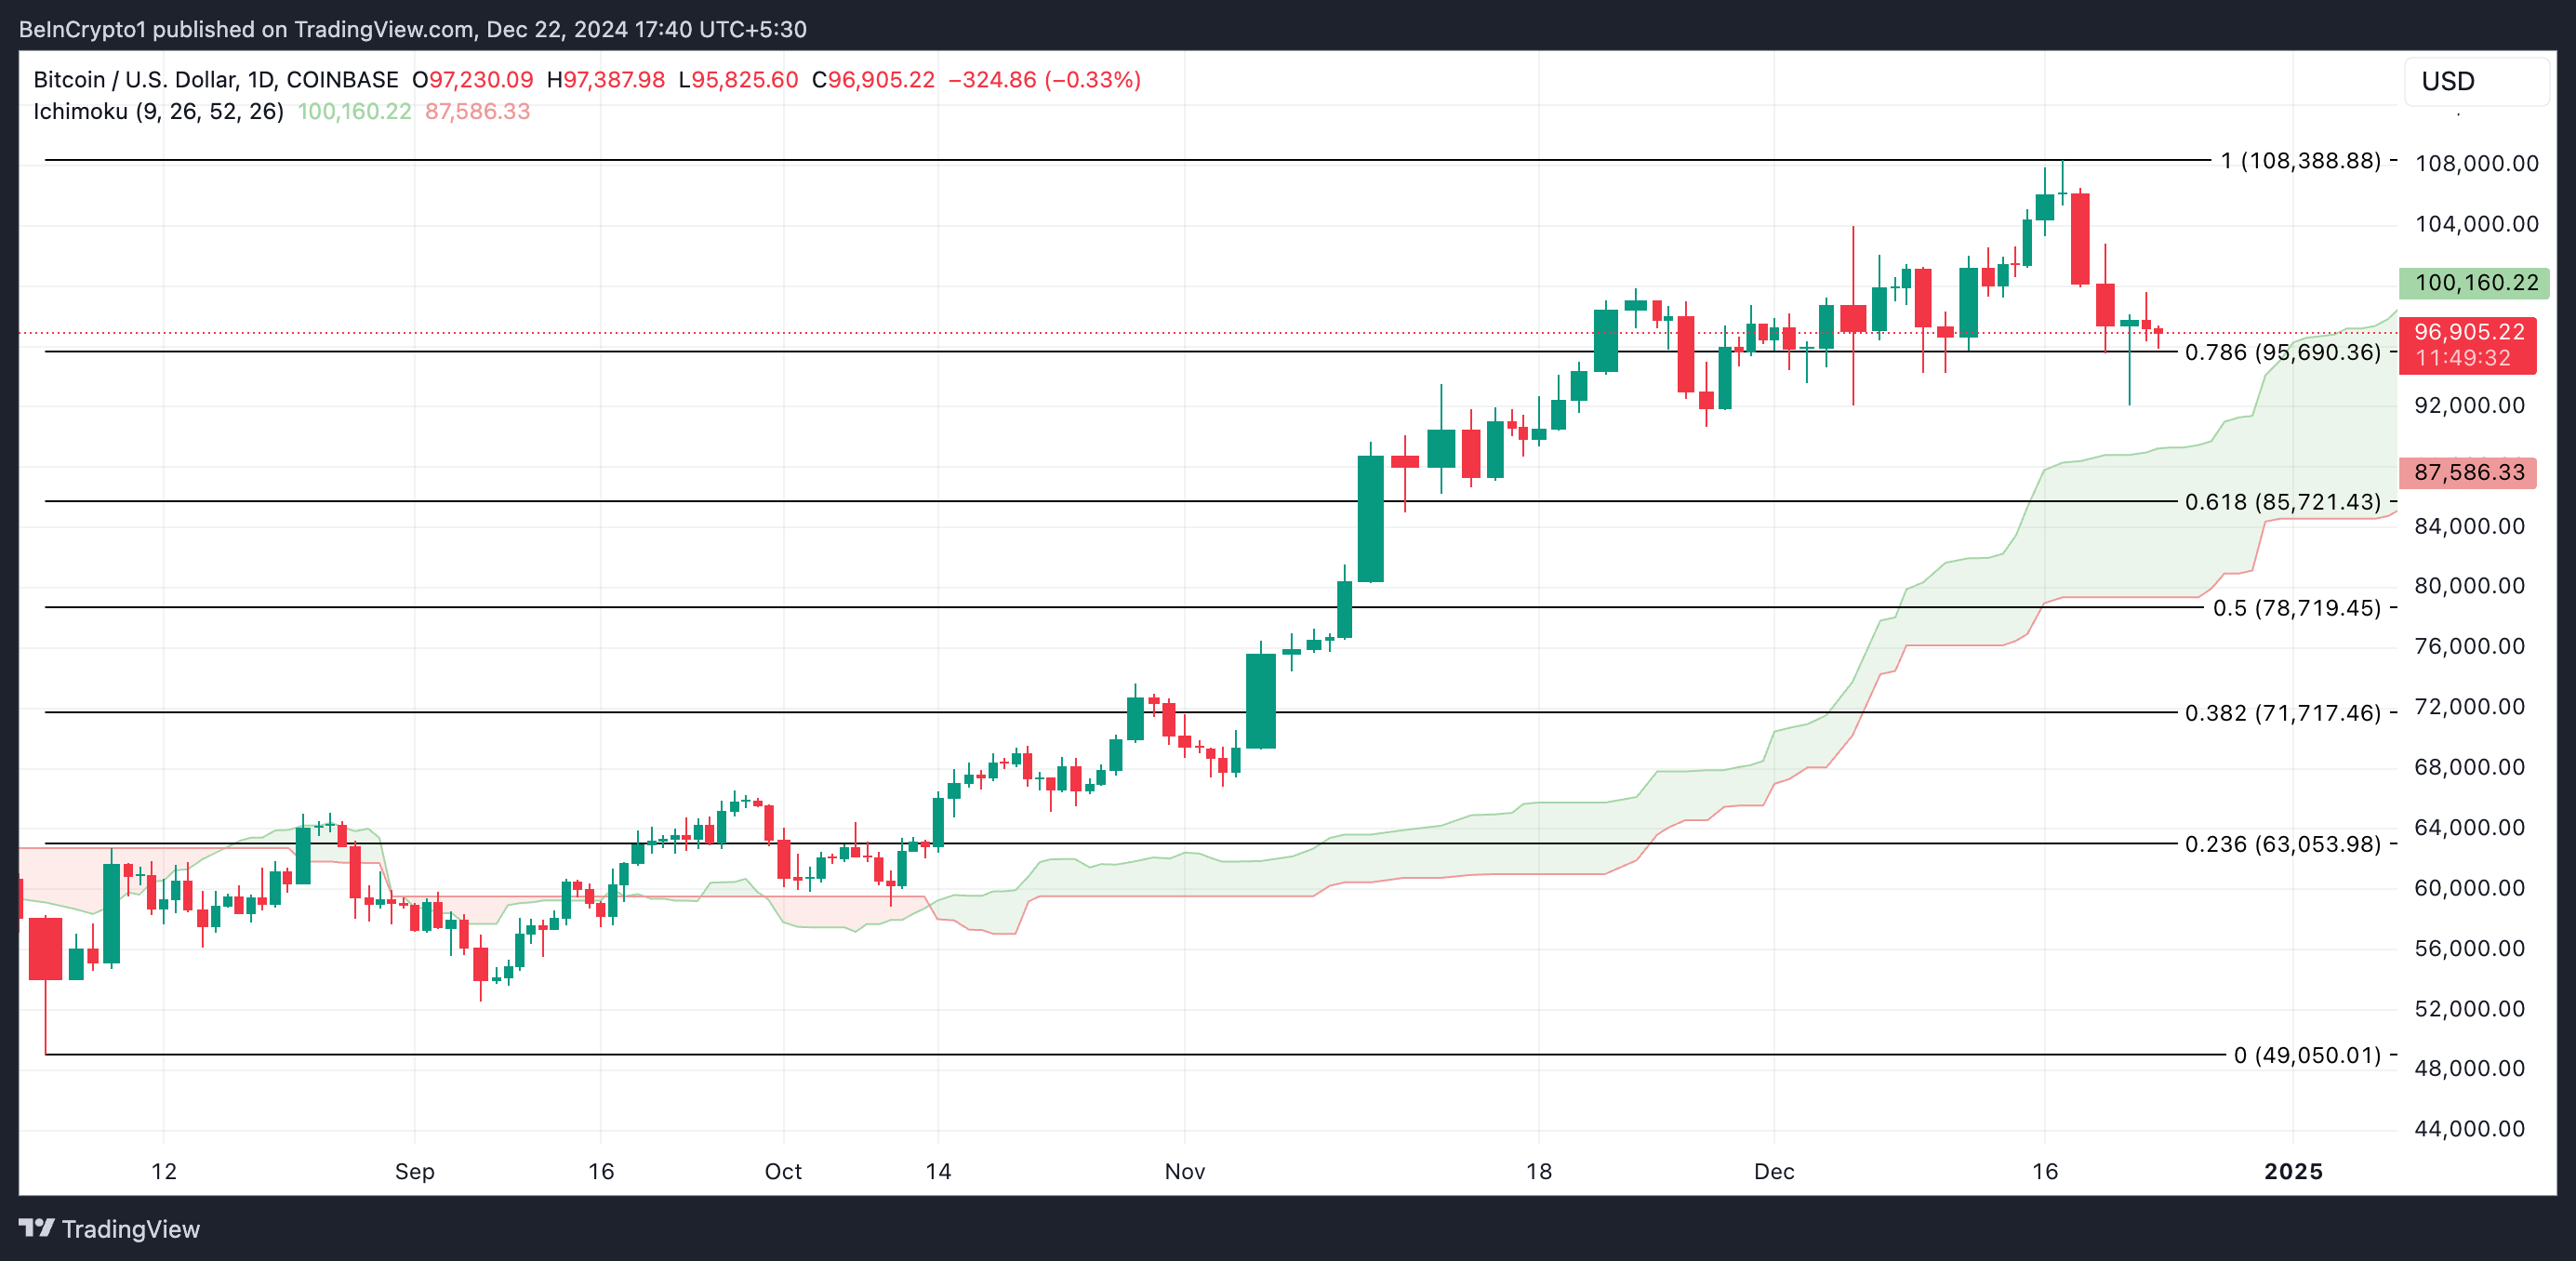
The broader market decline has pushed the price of Bit(BTC) below the Ichimoku Cloud's leading span A, which forms a dynamic resistance at $100,160. This indicator tracks the momentum of an asset's market trend and identifies potential support/resistance levels.
When an asset's price trades below the Ichimoku Cloud's leading span A, it signals a bearish trend with strong selling pressure and difficulty for buyers to push the price higher. This scenario often suggests the potential for further downside unless the price can reclaim the cloud.

If Bit(BTC)'s price successfully breaks above this level, it will target the all-time high of $108,388. However, if the attempt to break this resistance fails, Bit(BTC)'s price could drop to $95,690.


