Author: The DeFi Investor Translator: Shan Eoba, Jinse Finance
Over the past few months, the crypto market has undergone many changes. Now is a good time to review some key indicators and understand the market trends and current status.
Here are 7 key charts to help you understand the overall market:
1. The total market cap of AI agents is only about $1 billion
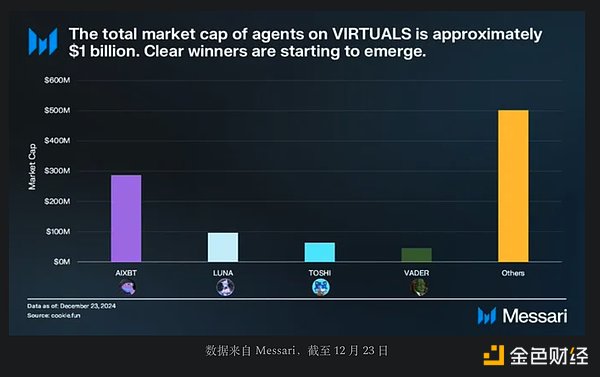
AI agents have been one of the hottest narratives in the past few months.
However, as the largest AI agent launch platform, the market cap of Virtuals' token has reached $4 billion, while the total market cap of AI agents is still relatively low.
I believe the AI agent narrative will continue to heat up in the coming months.
2. DEX trading volume is rapidly catching up to CEX
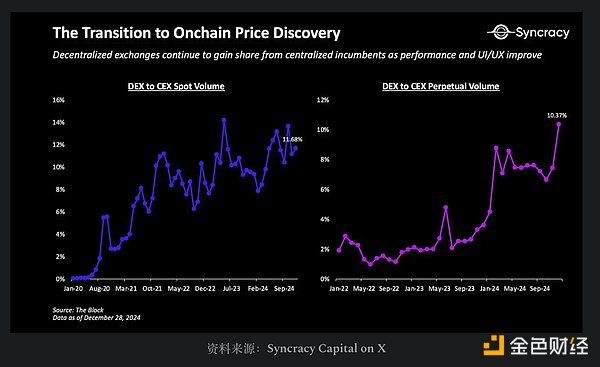
Particularly, decentralized exchanges (DEXs) for perpetual contracts have recently become very popular.
Notably, more and more projects have reached multi-billion dollar valuations without listing on a CEX (centralized exchange).
This trend indicates that DeFi is gradually realizing its goal of driving decentralization and attracting as many people as possible to on-chain trading.
3. Interest in Decentralized Science (DeSci) has skyrocketed
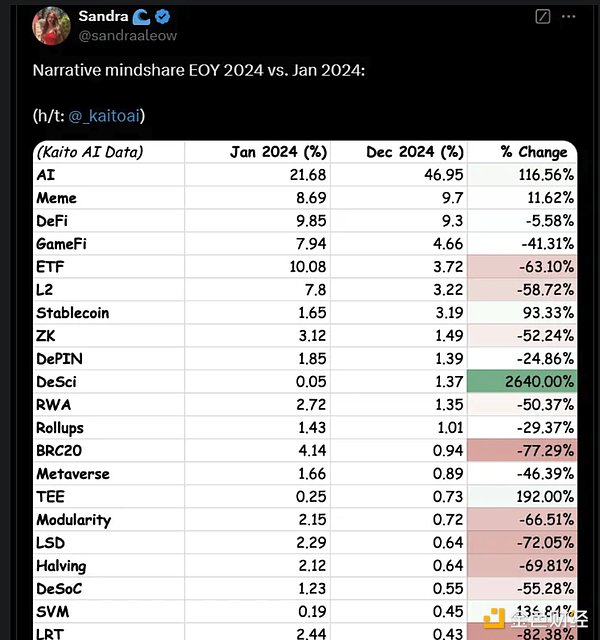
I haven't paid much attention to DeSci in the past, but perhaps I should delve into it now.
Over the past 12 months, the attention on narratives such as Liquid Restaking, BRC-20, Modularity and L2 has declined significantly.
Surprisingly, even though many real-world asset (RWA) tokens have performed well, the attention on the RWA narrative has also seen a significant decline. However, I expect it to make a comeback in 2025.
4. Bitcoin exchange supply continues to decline
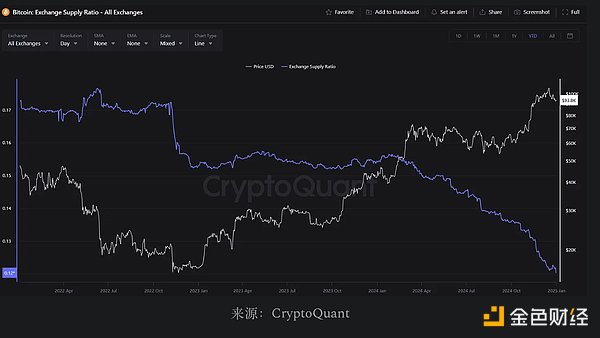
This is a positive signal, indicating that whales are still continuously buying. The less Bitcoin supply on exchanges, the easier it is for the Bitcoin price to rise.
Interestingly, the supply of Ethereum (ETH) on exchanges is also declining, but this trend has not yet been reflected in the price of ETH.
5. Stablecoin supply reaches a new high of $200 billion
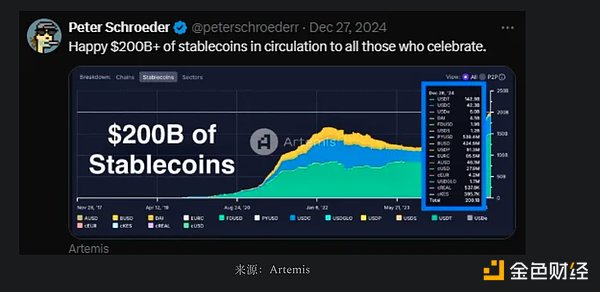
At the beginning of 2024, the circulating stablecoin supply was around $125 billion, and over the past 12 months, the supply has increased by about $75 billion!
I have emphasized many times that the stablecoin market will become a trillion-dollar opportunity.
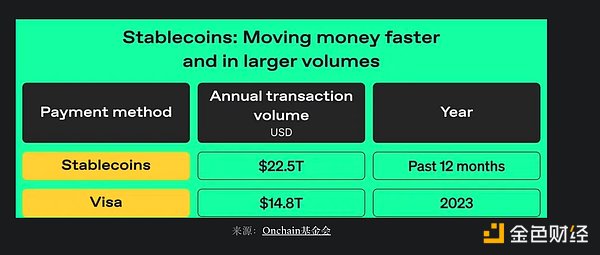
The annual trading volume of stablecoins has already surpassed Visa, and I expect them to set new records this year.
6. Monthly crypto financing starts to rebound
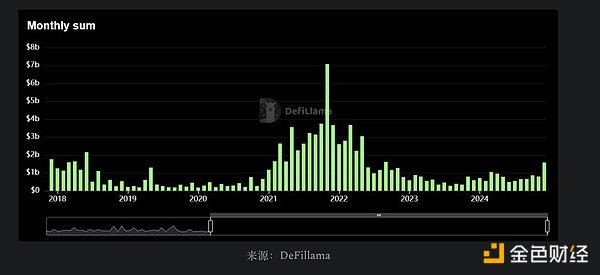
Financing levels are still far below 2021 levels, but the recent slight increase indicates that private investors are putting more capital into the market.
Historically, when crypto financing reaches an all-time high, it usually marks the top of the market cycle. This also means that we have not yet reached the peak of market euphoria.
7. Solana is almost on par with Ethereum in all metrics
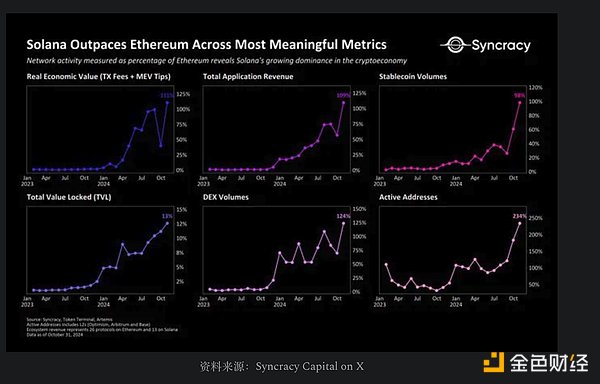
This is one of the main reasons why I am bullish on Solana.
I believe the future will be one of multi-chain coexistence, where Ethereum and Solana may coexist. But the sustained growth of Solana's activity indicates that it has become an undeniable force in the crypto market.
Interestingly, at one point in December, Solana's daily transaction fee revenue reached $431 million, surpassing the total of all other L1 blockchains.
In late 2025, Solana will see the Firedancer upgrade, a major scaling effort that will further drive network activity growth.
Conclusion
These are the charts I wanted to share today. 2024 will be an epic year, and I hope you can achieve your goals in 2025.
Wishing you a successful and fruitful 2025.


