The price of Ethena (ENA) has risen by more than 11% in the last 24 hours, bringing its market capitalization to $3.5 billion.
This upward trend is supported by strong technical indicators, with the Golden Cross and the Chaikin Money Flow (CMF) recently surging to 0.36, indicating increased buying pressure.
ENA CMF at Highest Level Since November
The Chaikin Money Flow (CMF) of Ethena is currently at 0.36, a significant increase from nearly 0 just two days ago. This surge reflects a substantial improvement in capital inflow, indicating that short-term buying pressure has intensified.
CMF is a momentum indicator that measures the flow of funds into an asset based on price and volume. A value above 0 indicates net buying pressure, while a value below 0 indicates net selling pressure.

With a CMF of 0.36, ENA is displaying strong positive momentum, suggesting that investors are actively accumulating the token. This may indicate growing confidence in Ethena as capital inflow increases, increasing the potential for price appreciation.
If the CMF maintains its upward trajectory, ENA's price may continue to experience sustained growth in the short term, as buying pressure continues to outpace selling activity. However, if the CMF declines, it could signal a loss of momentum, leading to a correction or pullback.
Ethena DMI Showing Strong Uptrend
The Ethena DMI chart shows that the ADX has surged to 25.6, a significant increase from just 9.9 two days ago, indicating a strong rise in trend strength. The ADX, or Average Directional Index, is a scale from 0 to 100 that measures the strength of a trend.
Values above 25 indicate a strong trend, while values below 20 indicate weak or absent momentum. With the ADX now firmly above the 25 threshold, it confirms that ENA's price is experiencing a strong trend, consistent with the current upward movement.

The directional indicators further emphasize the dominance of bullish momentum. The +DI has surged to 42.1, reflecting strong buying pressure, while the -DI remains much lower at 9.9, indicating minimal selling activity. This configuration suggests that buyers are firmly in control, driving the price higher with significant force.
In the short term, these DMI readings suggest that ENA's uptrend is likely to continue. However, sustained gains will depend on the ADX maintaining its upward trajectory and the +DI maintaining its dominance over the -DI.
ENA Price Forecast: Will Ethena Price Rise 13.7%?
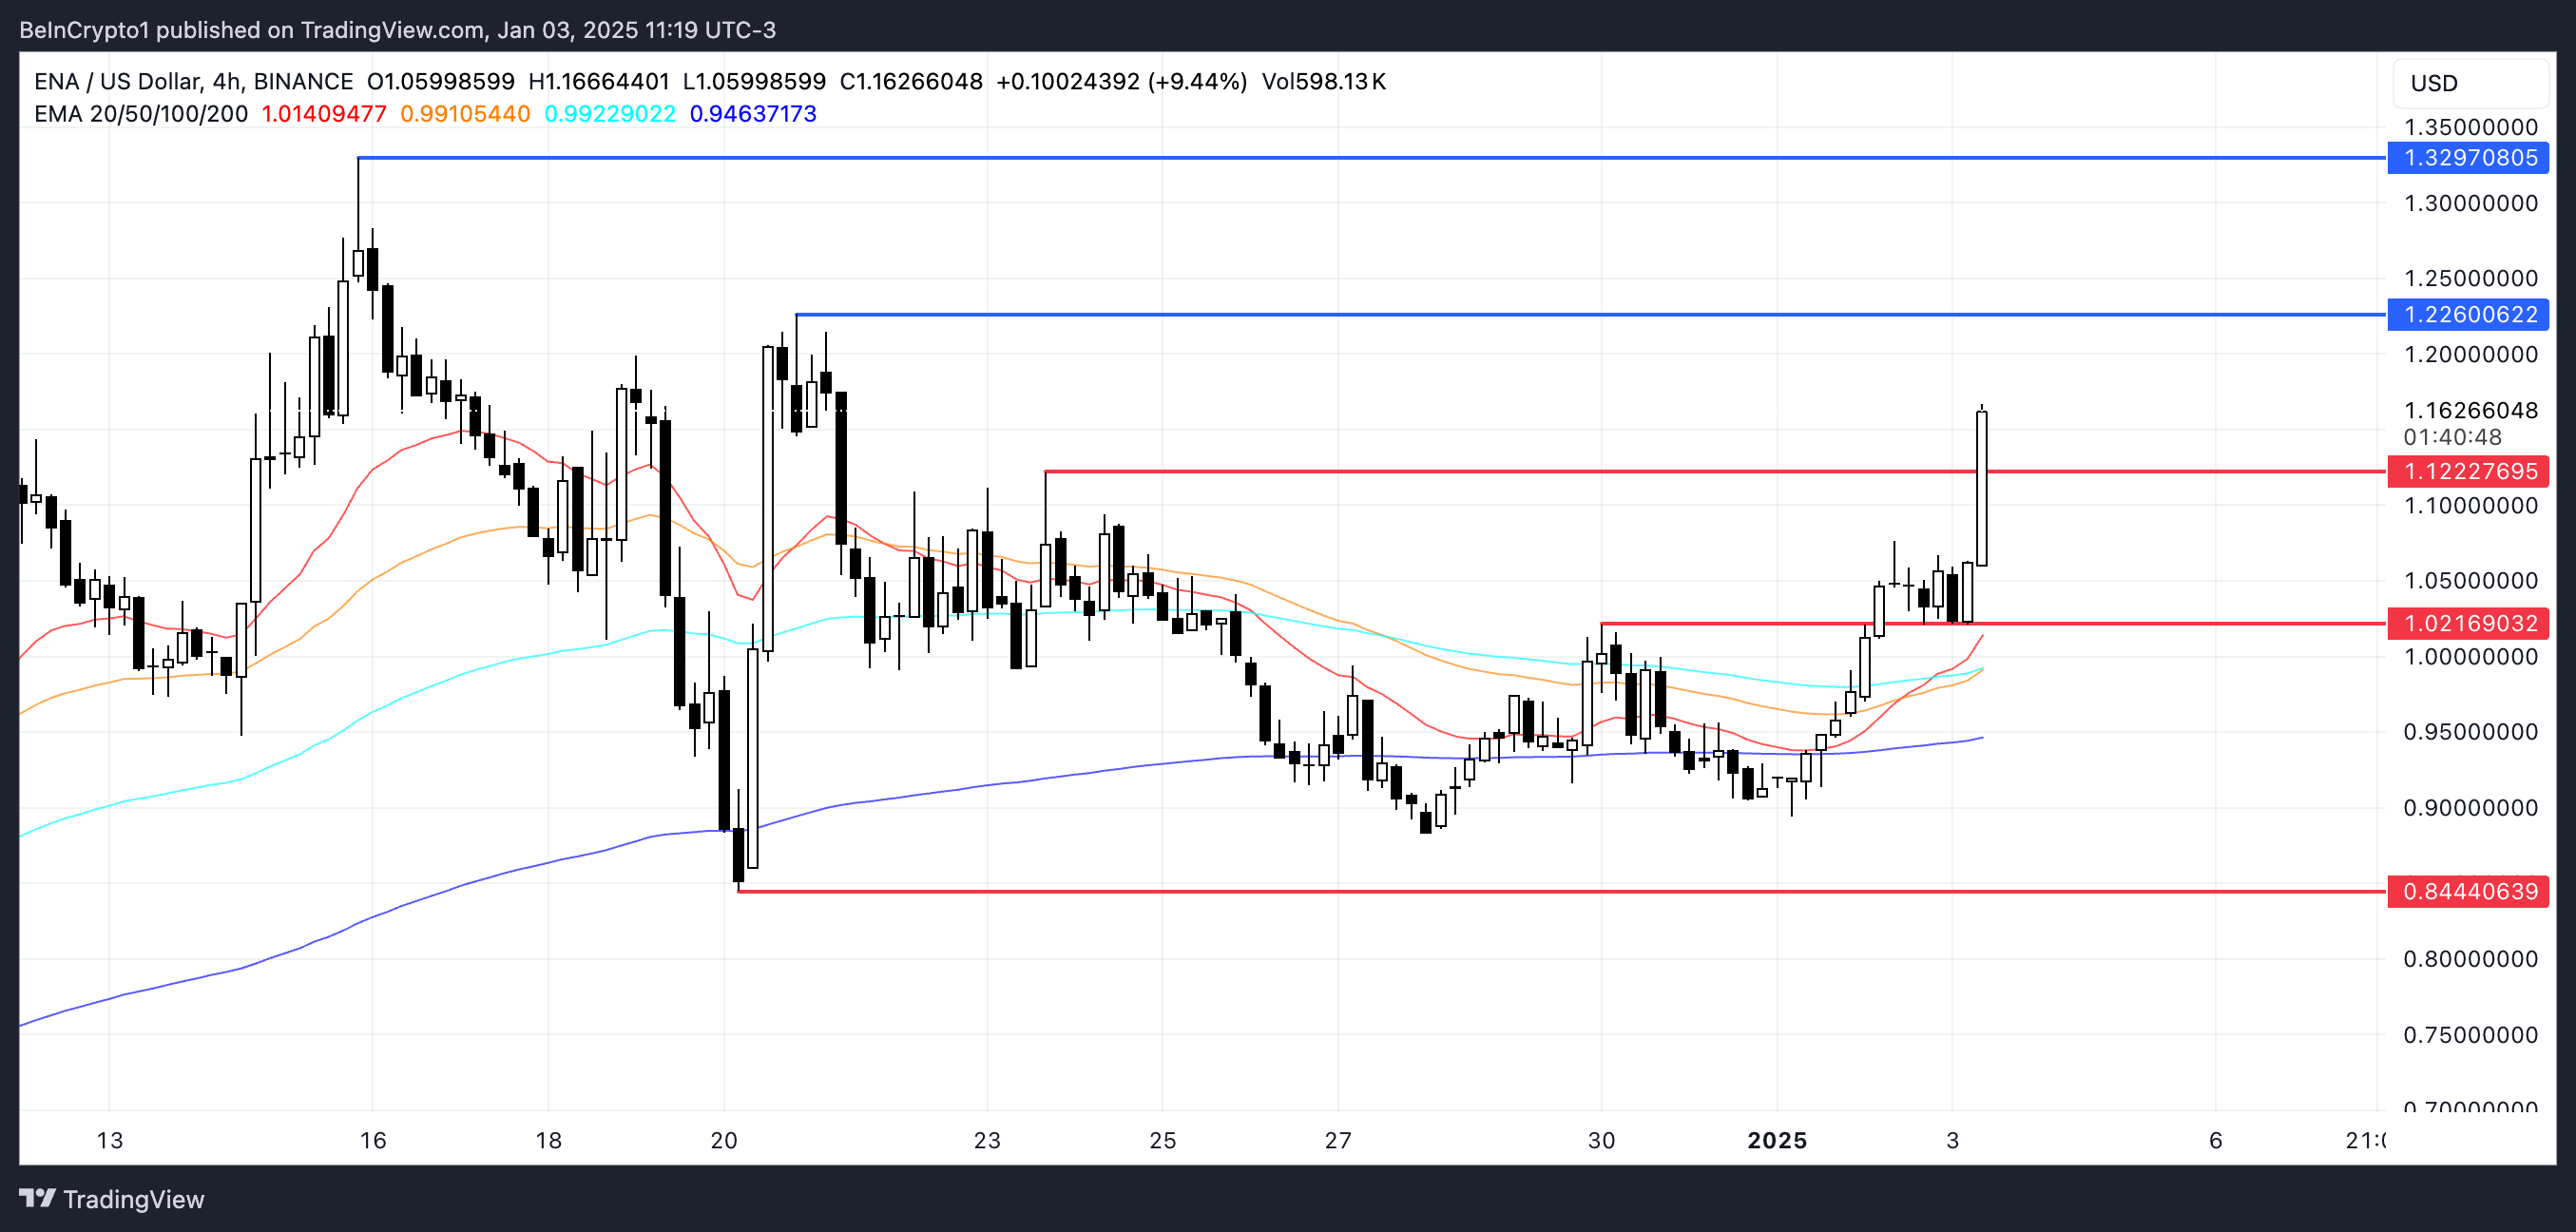
ENA's EMA lines have recently formed a Golden Cross, a bullish signal that occurs when the short-term moving average crosses above the long-term moving average. This development indicates the potential for a momentum shift towards a sustained upward price movement.
If the current uptrend persists, ENA's price may test the resistance at $1.22. If this level is breached, the price could rise to $1.32, representing a potential 13.7% increase.

However, if the uptrend falters and bearish momentum becomes dominant, the $1.12 support level will be crucial in preventing further downside. A break below this level could trigger additional selling pressure, potentially pushing ENA's price down to $1.02. If the $1.00 level fails to provide sufficient support, the price could further decline to $0.84, indicating a significant correction.


