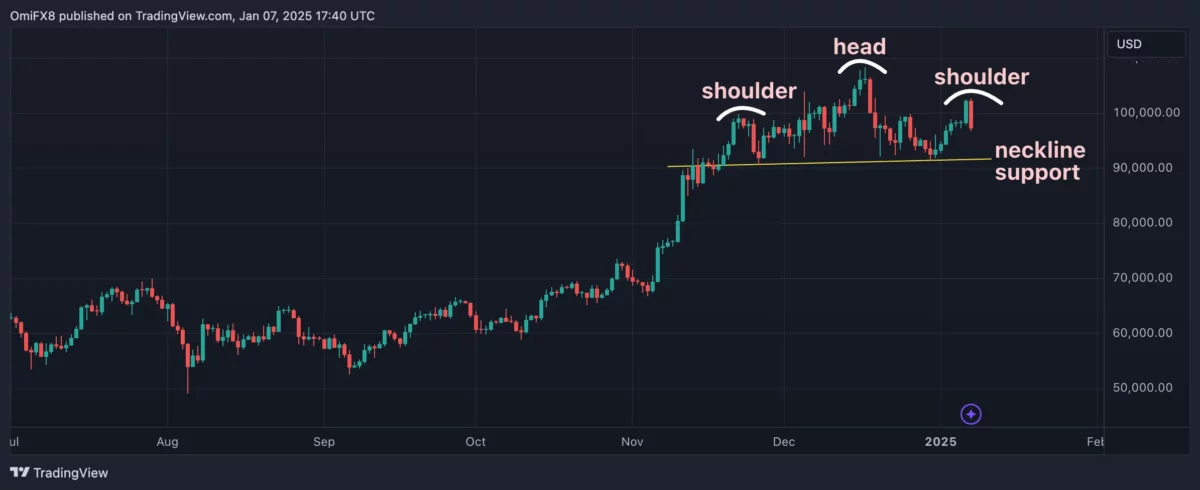
Since the end of November, the price trend of Bit has evolved into the so-called "Head and Shoulders (H&S)" pattern, which suggests that the market may be turning from a bull market to a bear market.
In early November, it failed to successfully break through the $100,000 mark for the first time, marking the formation of the left shoulder. Subsequently, the head stage appeared, and Bit quickly fell from the historical high of over $108,000 in the second half of December to $92,000. At the same time, the current 5% decline driven by economic data has caused the price to fall to around $97,000, implying the formation of the right shoulder.

If the selling pressure continues, causing the price to break through the neckline (the horizontal trend line connecting the two shoulder lows), then this head and shoulders reversal pattern will be confirmed. As of now, the so-called neckline support is around $91,500.
According to the Measured Move Method, a break below this level could lead to a price drop to around $75,000. This method measures the vertical distance from the "head" high point to the "neckline" and then subtracts the same distance from the "neckline" price point to obtain the potential downside target.


