

In 2024, Memecoin has become the biggest hot spot in the Crypto world. Rapidly soaring from a market capitalization of $20 billion in 2023 to over $100 billion in 2024, Memecoin not only consolidated its position in the crypto market, but its performance also far exceeded the benchmark indices of mainstream cryptocurrencies such as Bitcoin and Ethereum, becoming the most dazzling asset class of the year.
In this trading frenzy, a large number of "whales" have emerged. They paid huge transaction fees in Memecoin trading, directly driving the prosperous development of public chains such as Solana, and also allowing Memecoin infrastructure platforms such as Raydium, Jito, and Pump.fun to earn handsomely.
Recently, ChainCatcher, together with the Memecoin smart trading platform Tesa and the Memecoin project Evan the Hobo, jointly released the "2024 Memecoin Annual Consumption Report". The report deeply analyzed the consumption data of Memecoin players with transaction amounts exceeding $1,000 among the approximately 4 million user addresses on the Solana chain in 2024, starting from the distribution of transaction fees, and comprehensively presented the consumption behavior of Memecoin users and the benefits of each platform in that year.
If you need to check your personal Solana consumption report for 2024, please check the link: https://report.tesa.top/
Core Data Overview
1. Total Memecoin transaction fees on the Solana chain: Over $3.093 billion.
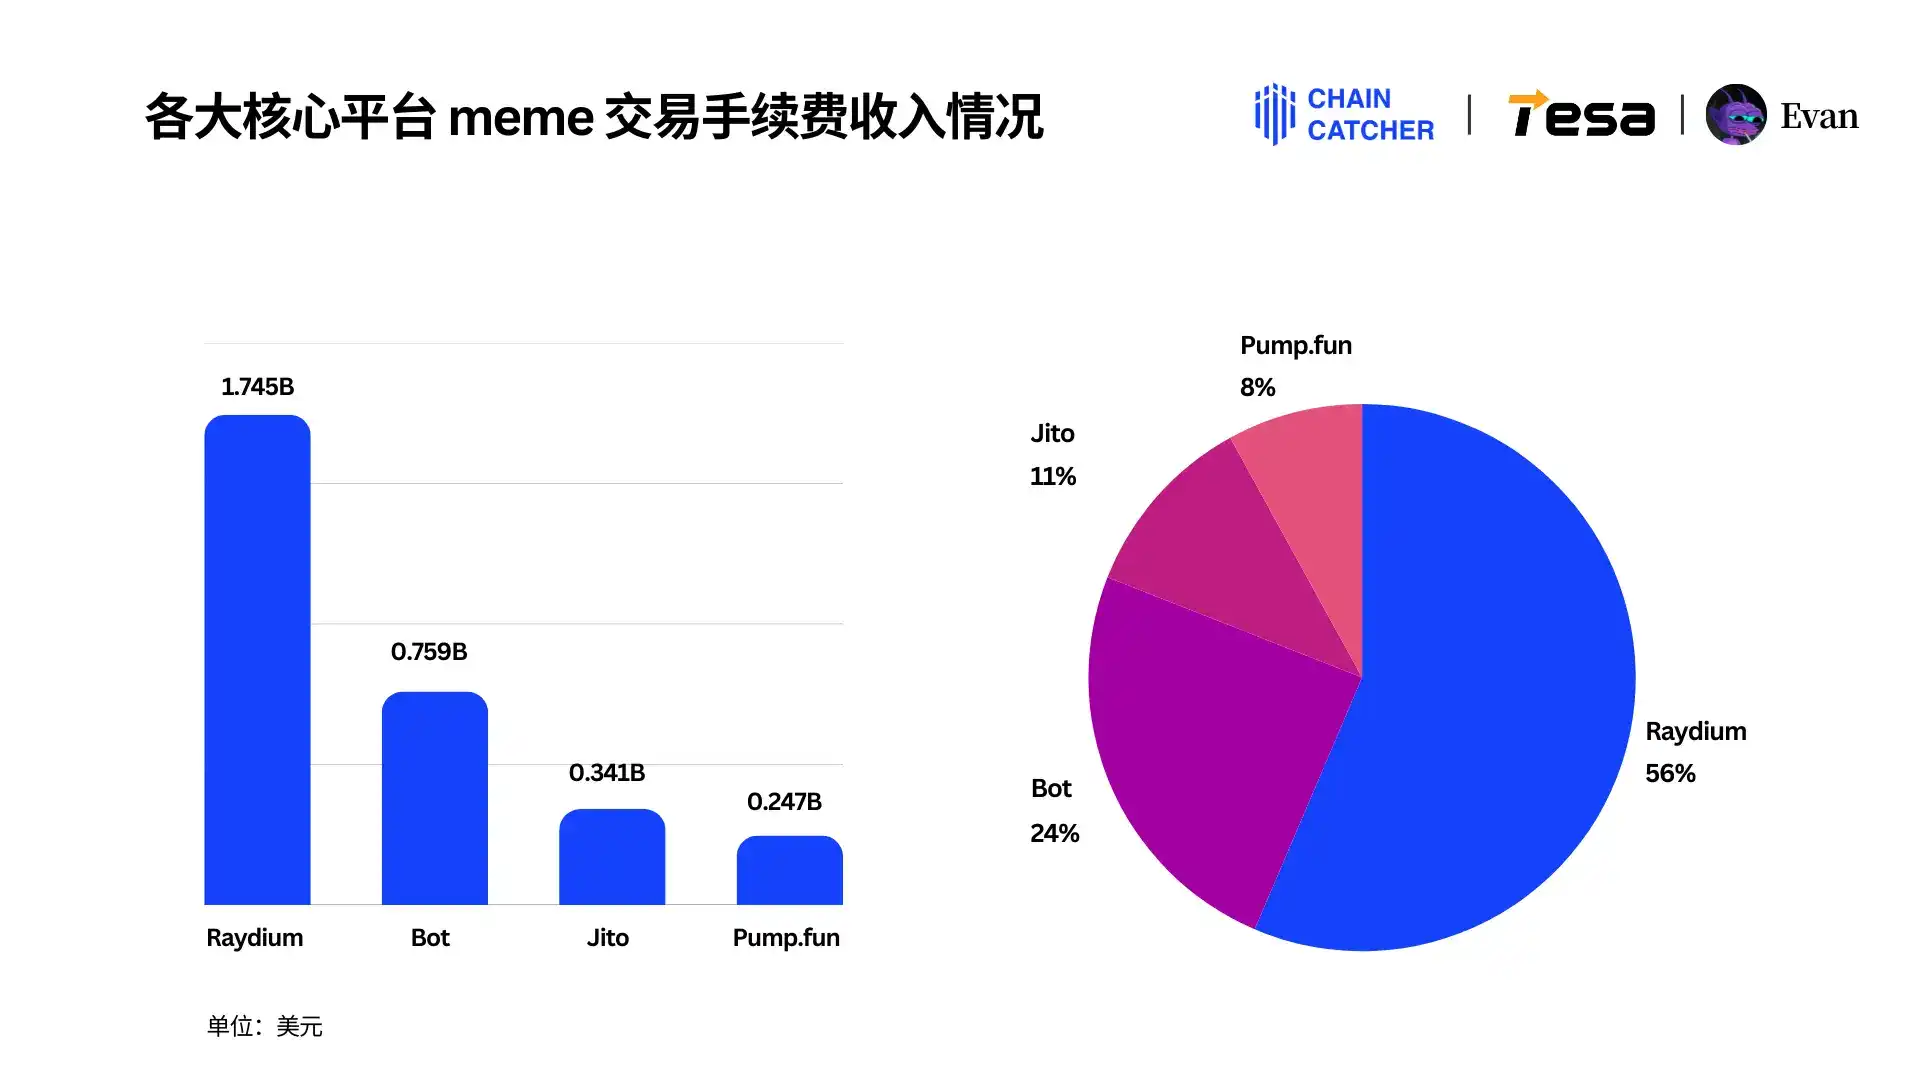
2. Revenue situation of major core platforms:
· DEXs like Raydium: Earned $1.7 billion in transaction fees, accounting for 56%.
· Trading BOTs: Accumulated $750 million in transaction fees, accounting for 24%, with Photon leading with a 33% share.
· MEV infrastructure Jito: Earned $340 million, accounting for 11%.
· Pump.fun: Earned $240 million, accounting for 8%.
1. User concentration: The top 10% of users contributed 90% of the transaction fees, with whale users averaging $13,000 in spending.
2. Top users: The largest "whale player" on Raydium spent nearly $129 million in a year.
Memecoin Transaction Fee Total Scale and Consumption Distribution
1. Total transaction fees exceed $3 billion
As the most popular Memecoin public chain in 2024, the on-chain transaction fee data of Solana has almost become a microcosm of the overall Memecoin market consumption situation. By statistics of about 4 million Solana user addresses with transaction amounts exceeding $1,000 in 2024, the total transaction fees generated by Memecoin transactions on the Solana chain alone reached $3.093 billion, demonstrating Solana's dominant position in Memecoin trading.
2. DEXs like Raydium are the biggest beneficiaries, earning over $1.7 billion in transaction fees
The more than $3 billion in transaction fees contributed by Memecoin users mainly flowed to four major platforms: decentralized exchanges (DEXs) like Raydium, trading BOTs (such as Photon), MEV infrastructure Jito, and the one-click token issuance platform Pump.fun.
Among them, DEXs like Raydium took the top spot with over $1.7 billion in transaction fee revenue, accounting for 56%, with Raydium's transaction fee revenue accounting for 80% of all DEXs.
Jito, which provides priority trading (anti-sandwich) services, earned $340 million based on its exclusive capabilities, accounting for 11%. Pump.fun, on the other hand, earned $240 million by simplifying the token issuance process, accounting for 8%.
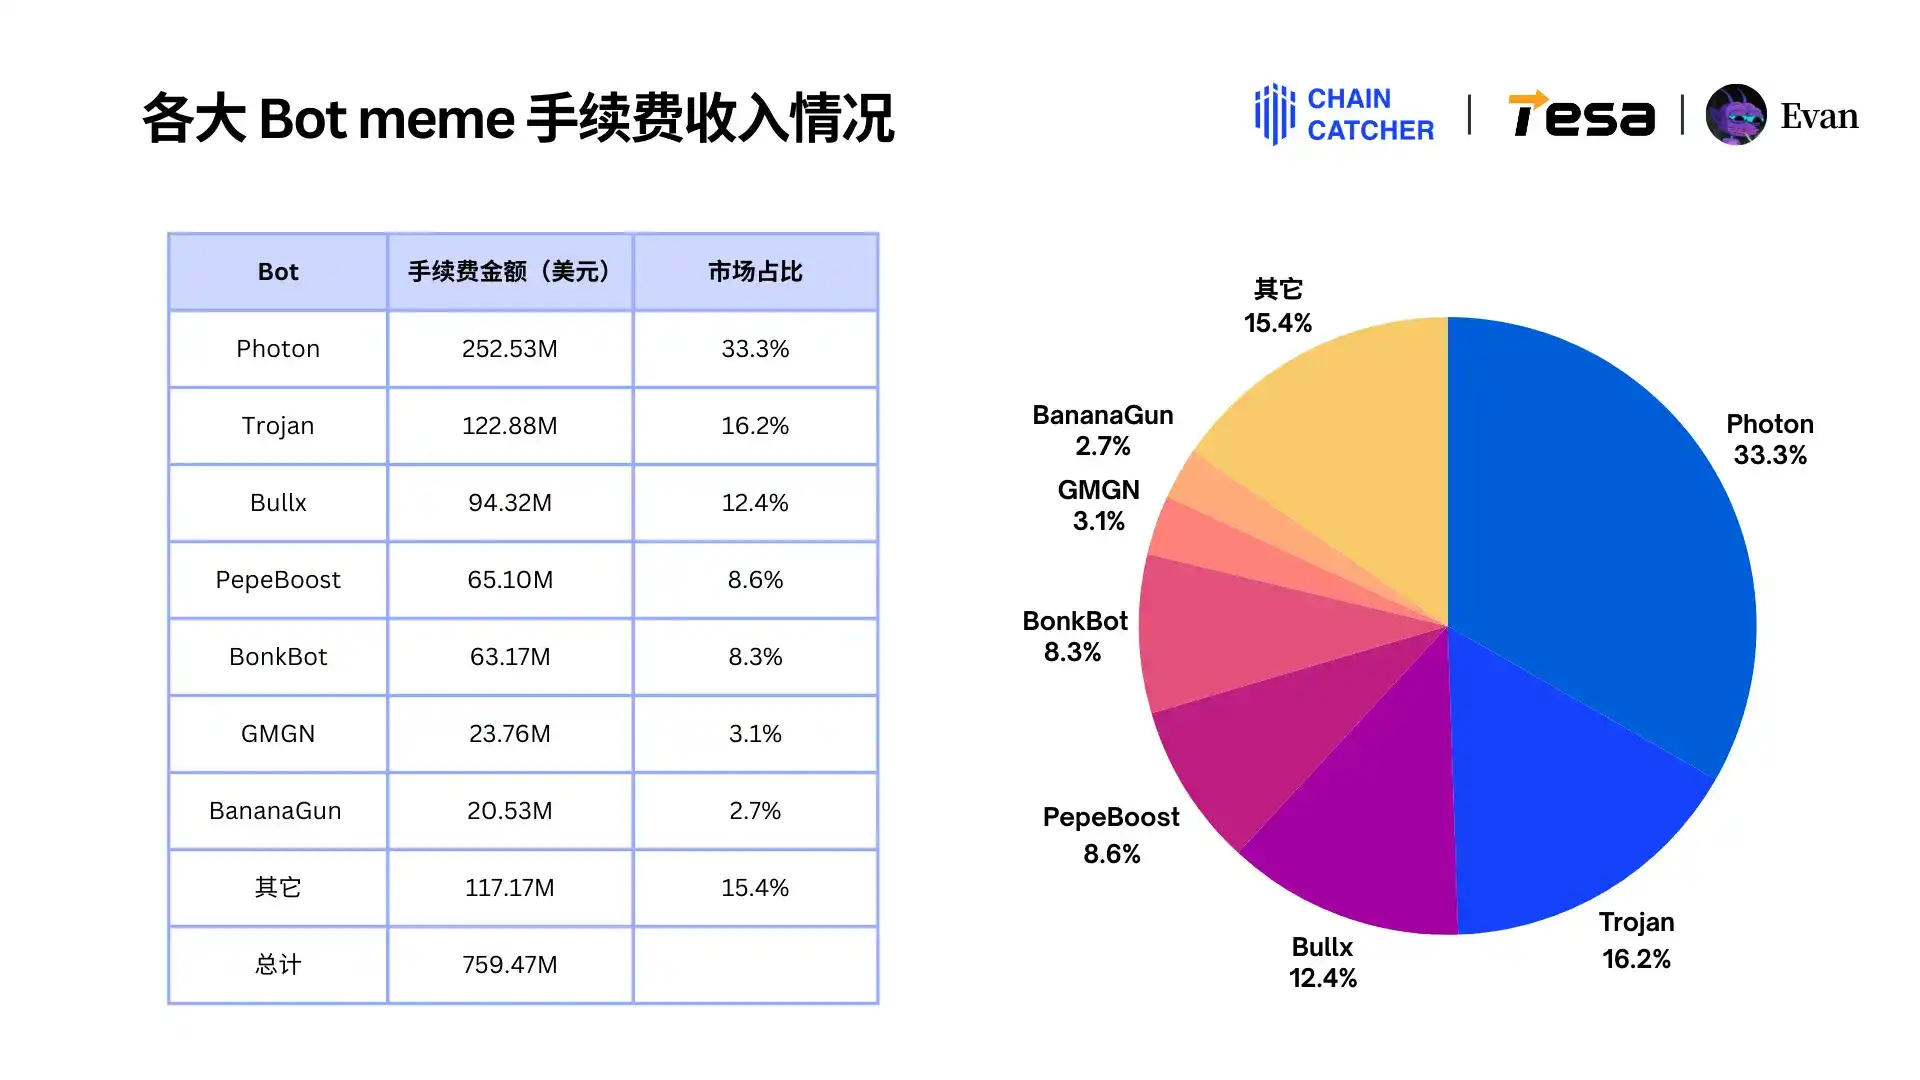
3. Photon is the most popular trading BOT, with transaction fees accounting for over 33%
Among the various trading BOTs, Photon performed the best, earning $250 million in transaction fees in 2024, accounting for 33.3% of the total transaction fees of all trading BOTs. Closely followed by Trojan and Bullx, which earned $123 million and over $94,000 in transaction fees, accounting for 16.2% and 12.4%, respectively.
In addition, the revenue of other BOTs is also quite considerable: PepeBoost earned $65.1 million, accounting for 8.6%; BonkBot earned $63.17 million, accounting for 8.3%; GMGM and BananaGun earned $23.76 million and $20.53 million, accounting for 3.1% and 2.70%, respectively.
At the same time, Tesa, the meme trading platform that provided the data for this report, offers users a completely different choice. Compared to traditional BOTs that charge 1% of the transaction amount, Tesa adopts a subscription model to reduce user trading costs. In addition, Tesa has launched a CEX listing sniper function.
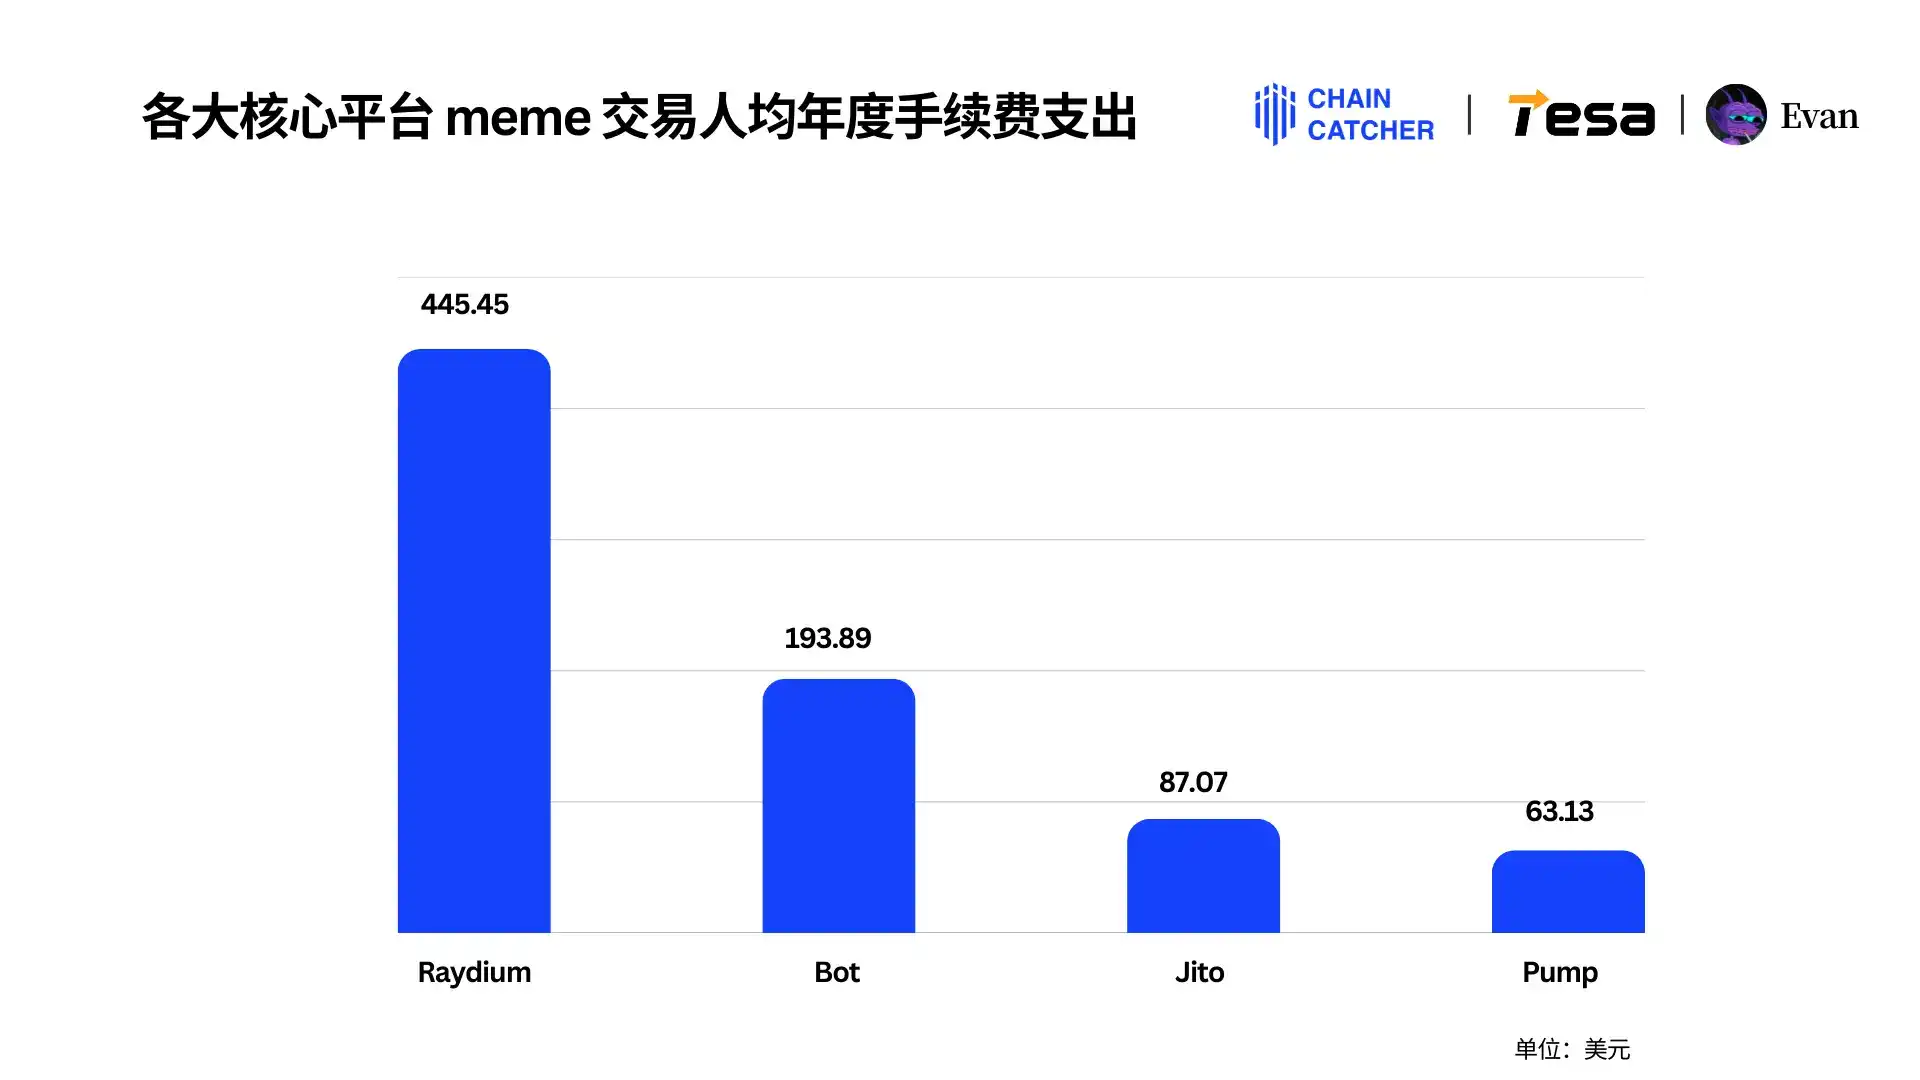
4. Whale users spent an average of $13,000 in transaction fees on Memecoin trading in 2024
In 2024, Memecoin players' average transaction fee spending on various platforms showed significant differences:
· Raydium: $445.45 per user
· Trading BOTs: $193.89 per user
· Jito: $87.07 per user
· Pump.fun: $63.13 per user
Based on the transaction fee amount, users can be divided into three categories:
1. Whale users (top 5% by transaction fees): Average annual spending of $13,000.
2. Regular users (20%-30% transaction fee range): Average spending of $171.28.
3. Newbie users (bottom 25% by transaction fees): Average spending of only $17.67.
In terms of platform preferences, Raydium and trading BOTs are the main transaction fee spending venues for whale users and regular users, while newbie users tend to prefer trading BOTs and Pump.fun.

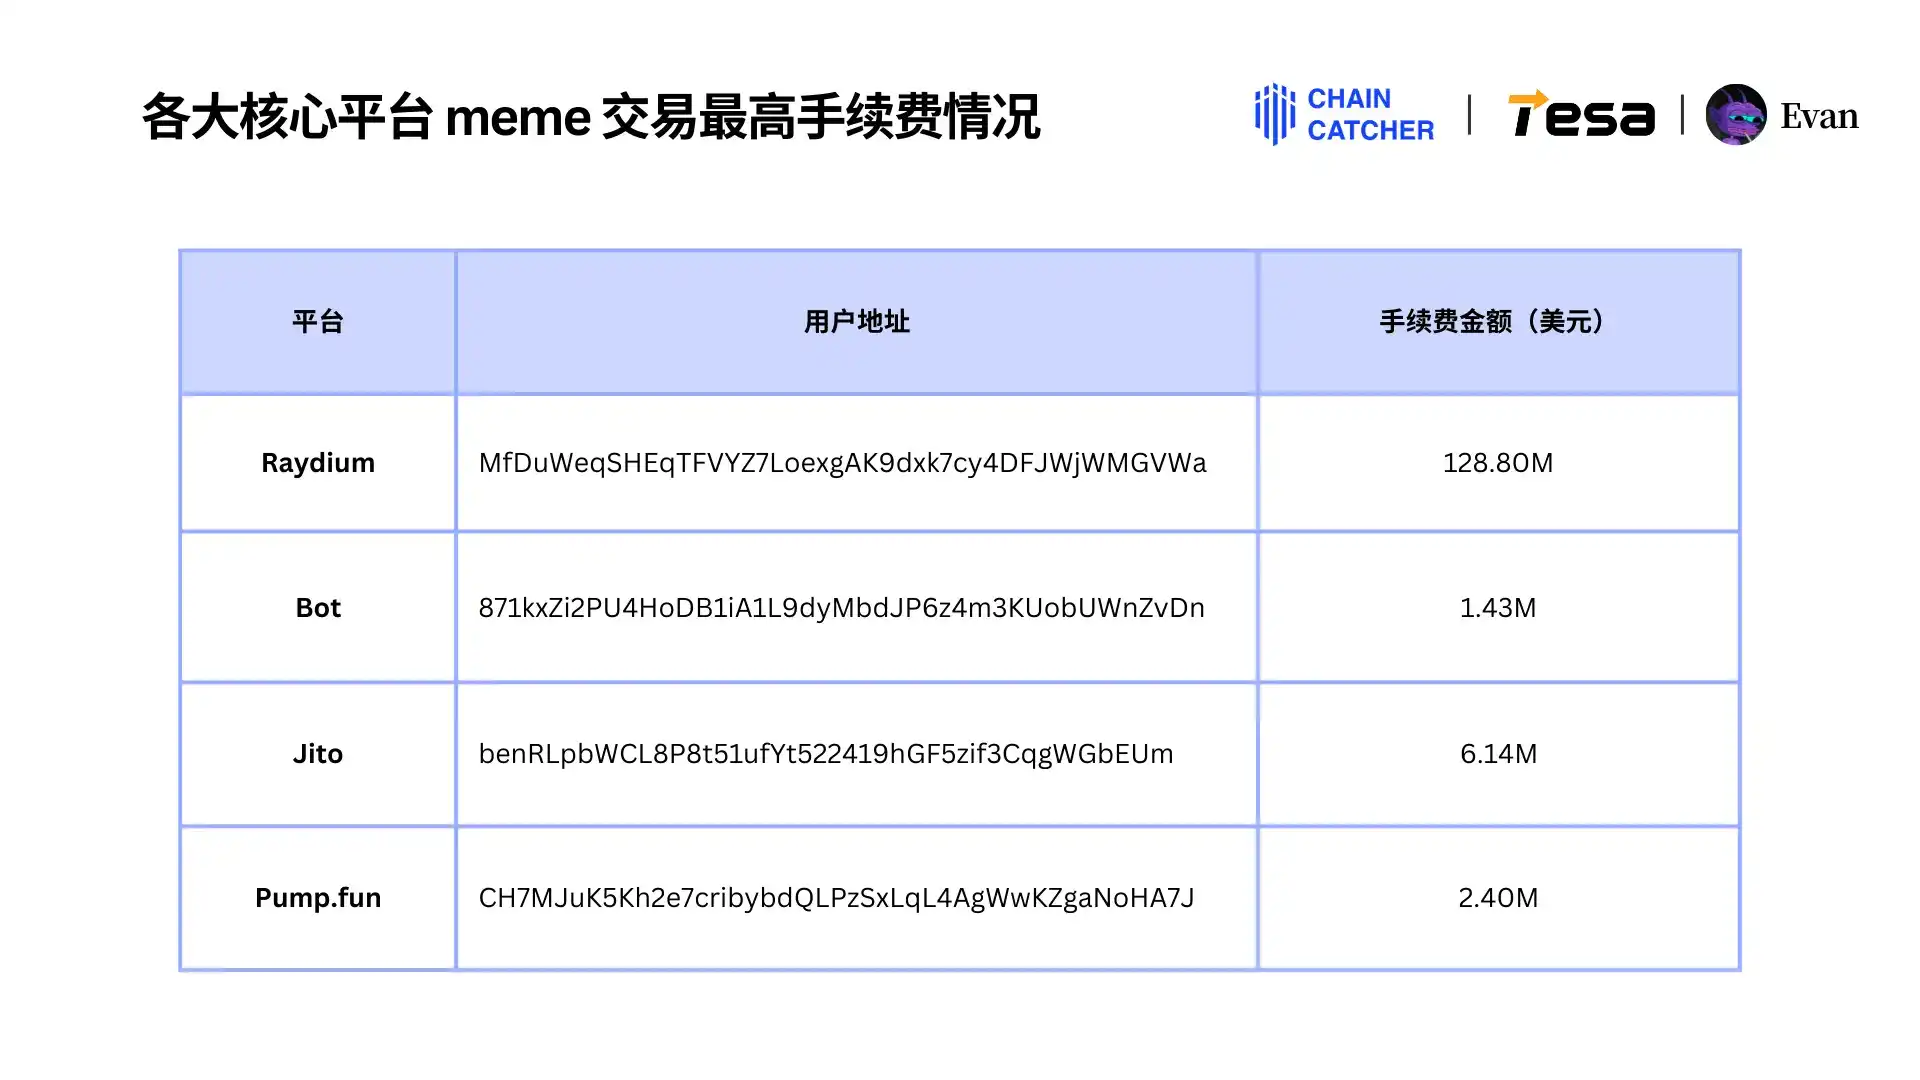
5. The single-platform largest "whale player" spent $129 million in transaction fees
In 2024, the Memecoin market saw the emergence of true "whale players". Among them, the user address MfDuWeq on platforms like Raydium paid transaction fees as high as $129 million in a year, far ahead of others.
In comparison, the highest transaction fee spending on other platforms was relatively "mild":
· Trading BOTs: $1.43 million
· Jito: $6.14 million
· Pump.fun: $2.40 million
This significant difference further highlights Raydium's dominant position in the Memecoin trading market.
II. Memecoin User Consumption Concentration and Cross-Platform Characteristics
1. The top 10% of users by spending contributed over 90% of the transaction fees
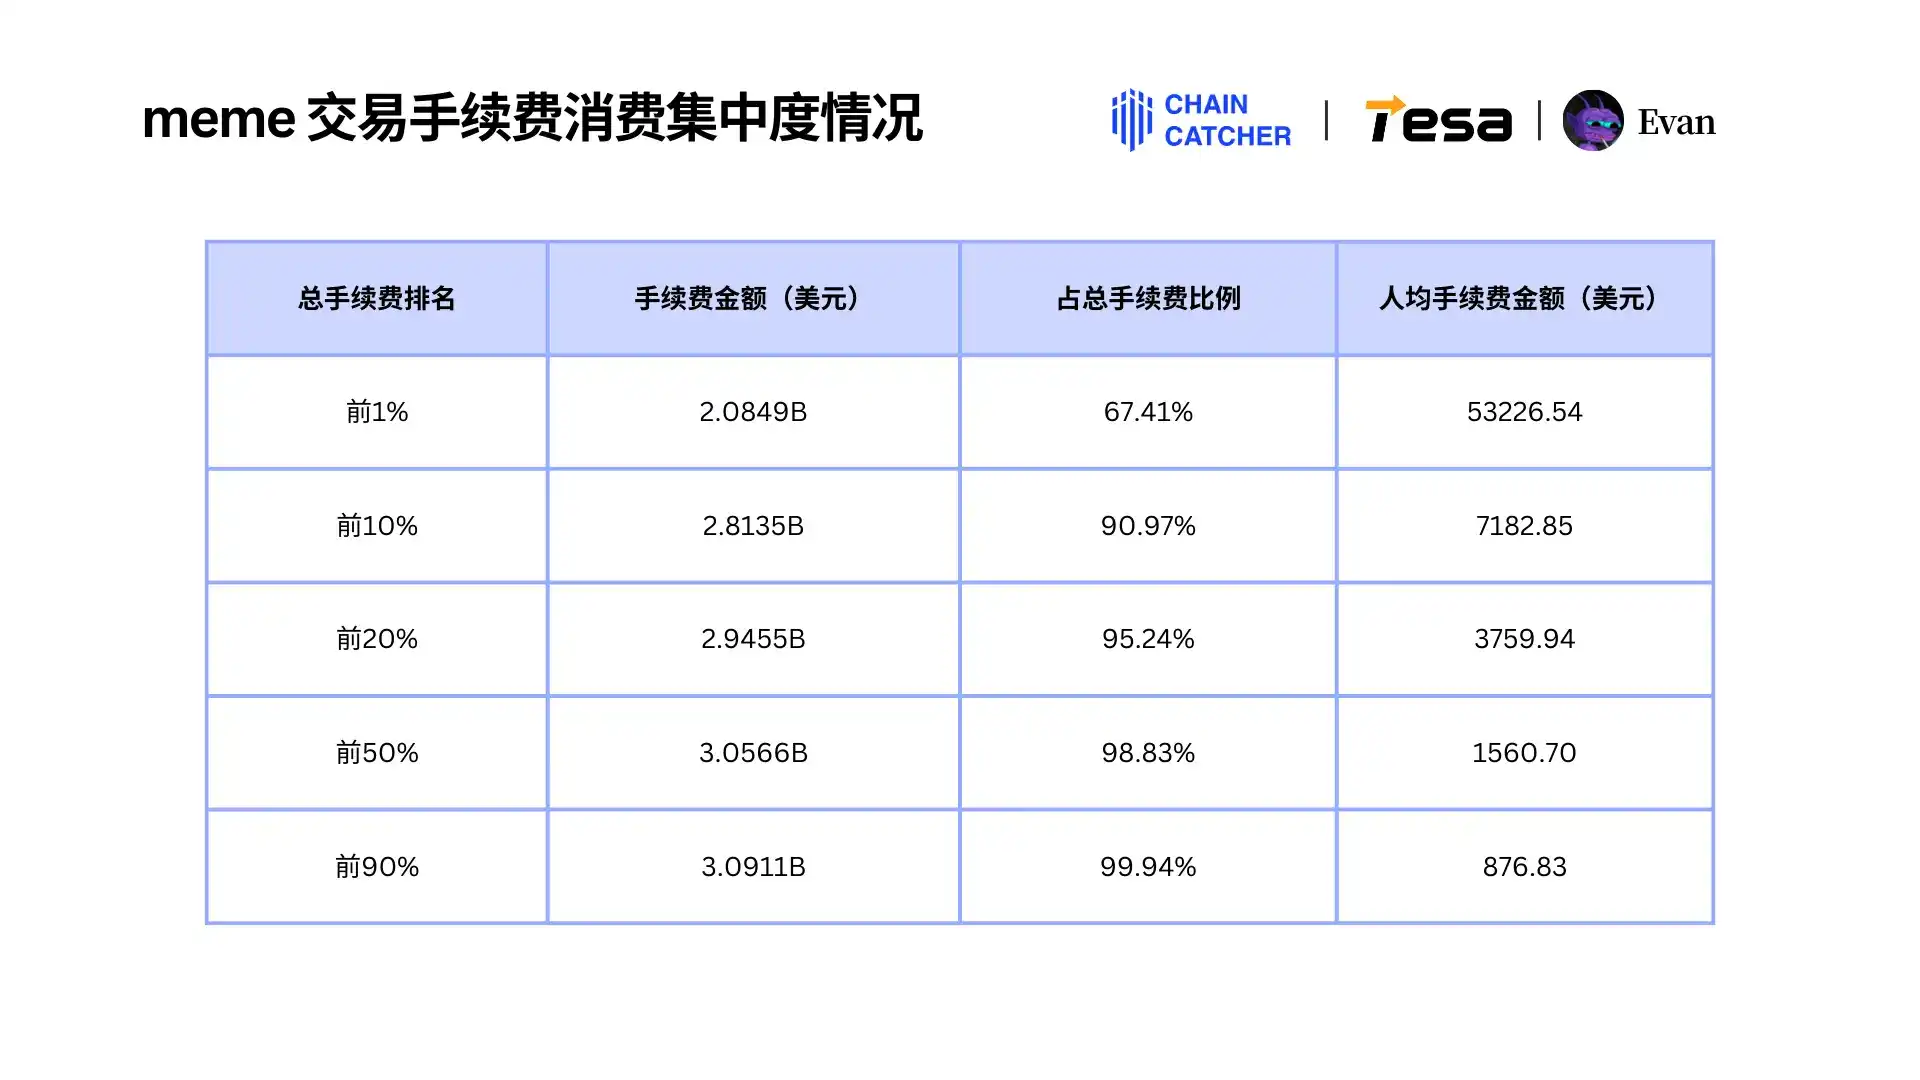
The consumption behavior of Memecoin users shows a clear "80/20 rule": a small number of top users contributed the majority of the transaction fees. The specific data is as follows:
· The top 1% of users contributed 67.46% of the transaction fees, with an average transaction fee of $53,000 per user;
· The top 10% of users contributed 90.97%, with an average transaction fee of $7,182 per user;
· The top 20% of users contributed 95.24%, with an average transaction fee of $3,760 per user.
This highly concentrated consumption pattern indicates that the Memecoin market's transaction fee revenue mainly depends on a small number of high-consumption users, while the transaction fee spending of the majority of ordinary users accounts for a relatively low proportion.
2. Raydium has the highest consumption concentration, and Pump.fun is relatively the lowest
Among the four Memecoin platforms of Raydium, Trading BOT, Jito, and Pump.fun, Raydium has the highest consumption concentration. Data shows that the top 1% of users contributed $1.358 billion in transaction fees, accounting for 79.88% of the total $1.7 billion in transaction fees, with an average transaction fee of $34,700 per user; while the users ranked 2-20% have an average transaction fee of less than $800, and the long-tail users ranked below 20% have an average transaction fee of less than $100. This also reflects the high dependence of Raydium on top users.

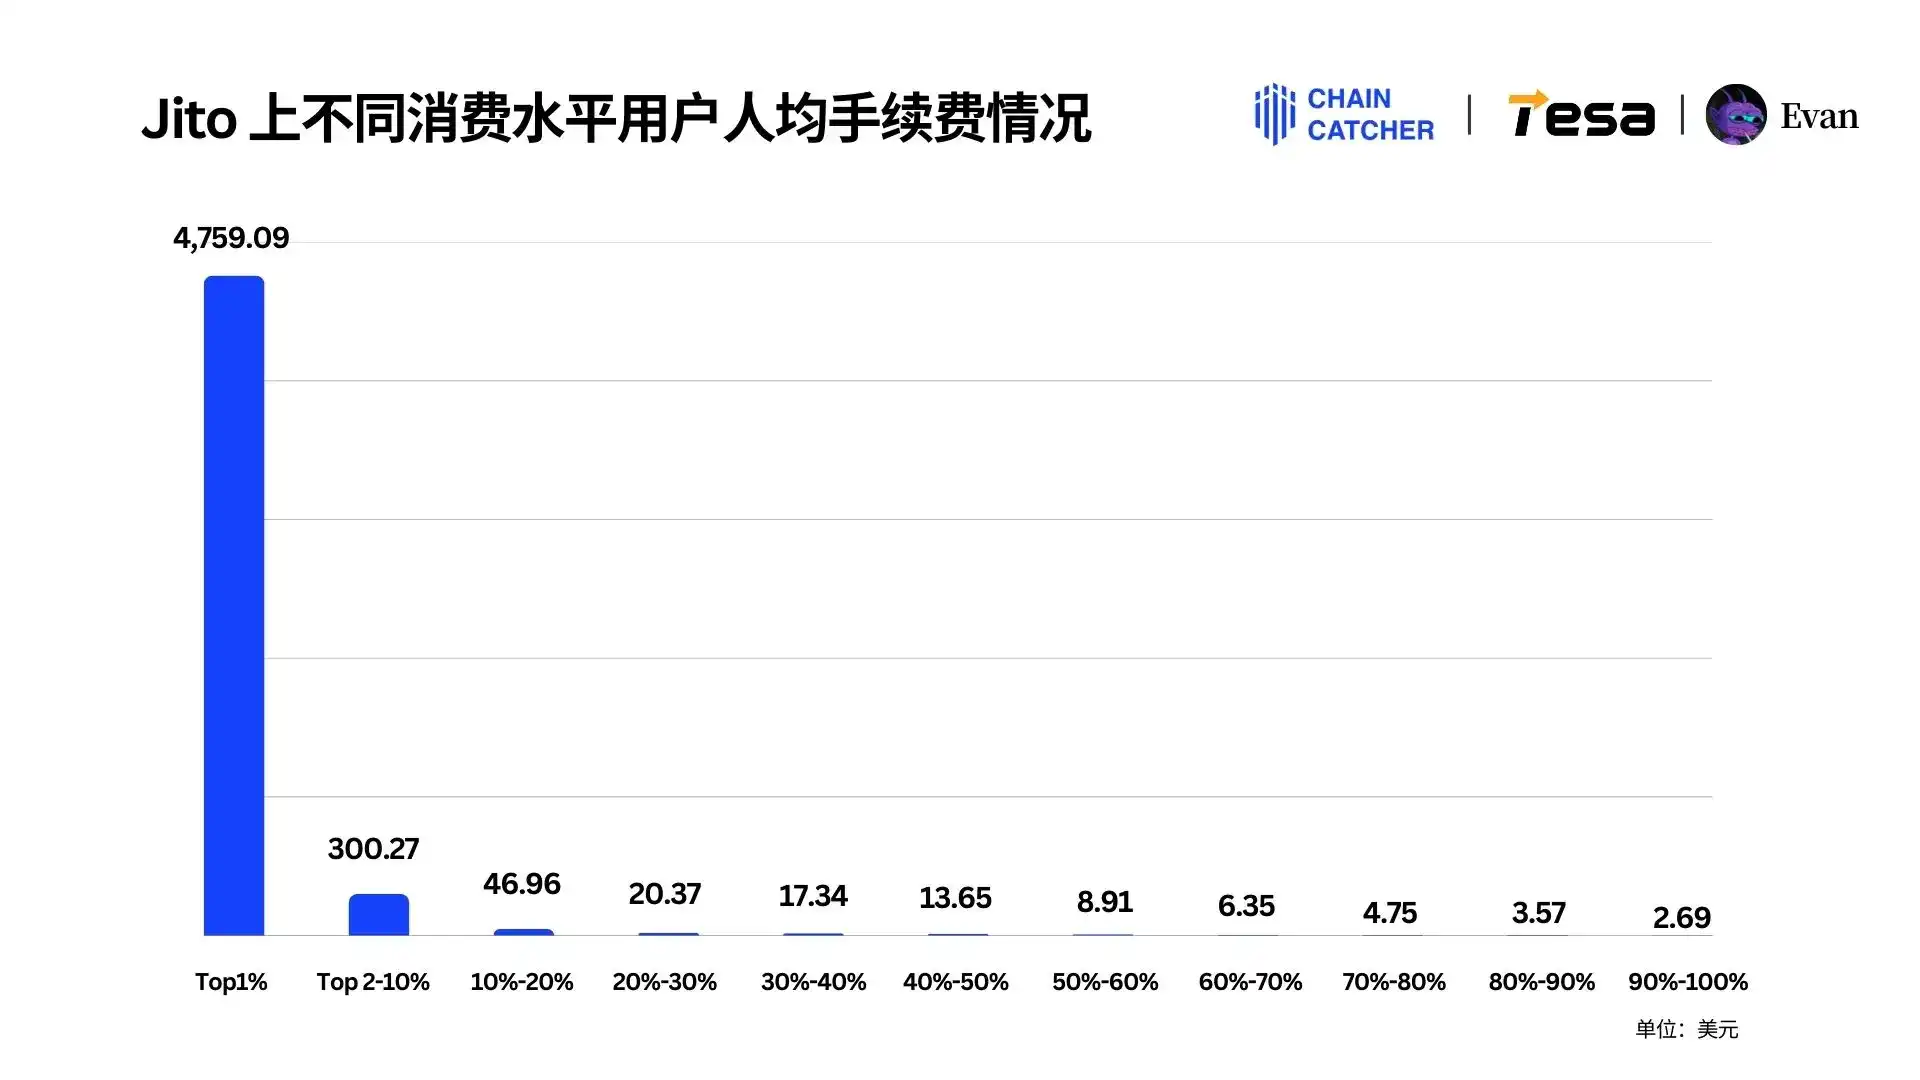
In comparison, the top 1% of Jito users contributed $186 million in transaction fees, accounting for 54.55%, which is less concentrated than Raydium but still exceeds 50%. The average transaction fee of Jito's top users and long-tail users also differs greatly, with the top 1% at around $4,759 and those ranked 2%-10% dropping to $300, while the long-tail users after 10% have an average transaction fee of less than $50.
The top consumption concentration of Trading BOT and Pump.fun is relatively lower:
· Trading BOT: The top 1% of users contributed $313 million, accounting for 41.24%.
· Pump.fun: The top 1% of users contributed $96.62 million, accounting for 39.07%.
This difference indicates that there are significant differences in user structure and profit models among different platforms.
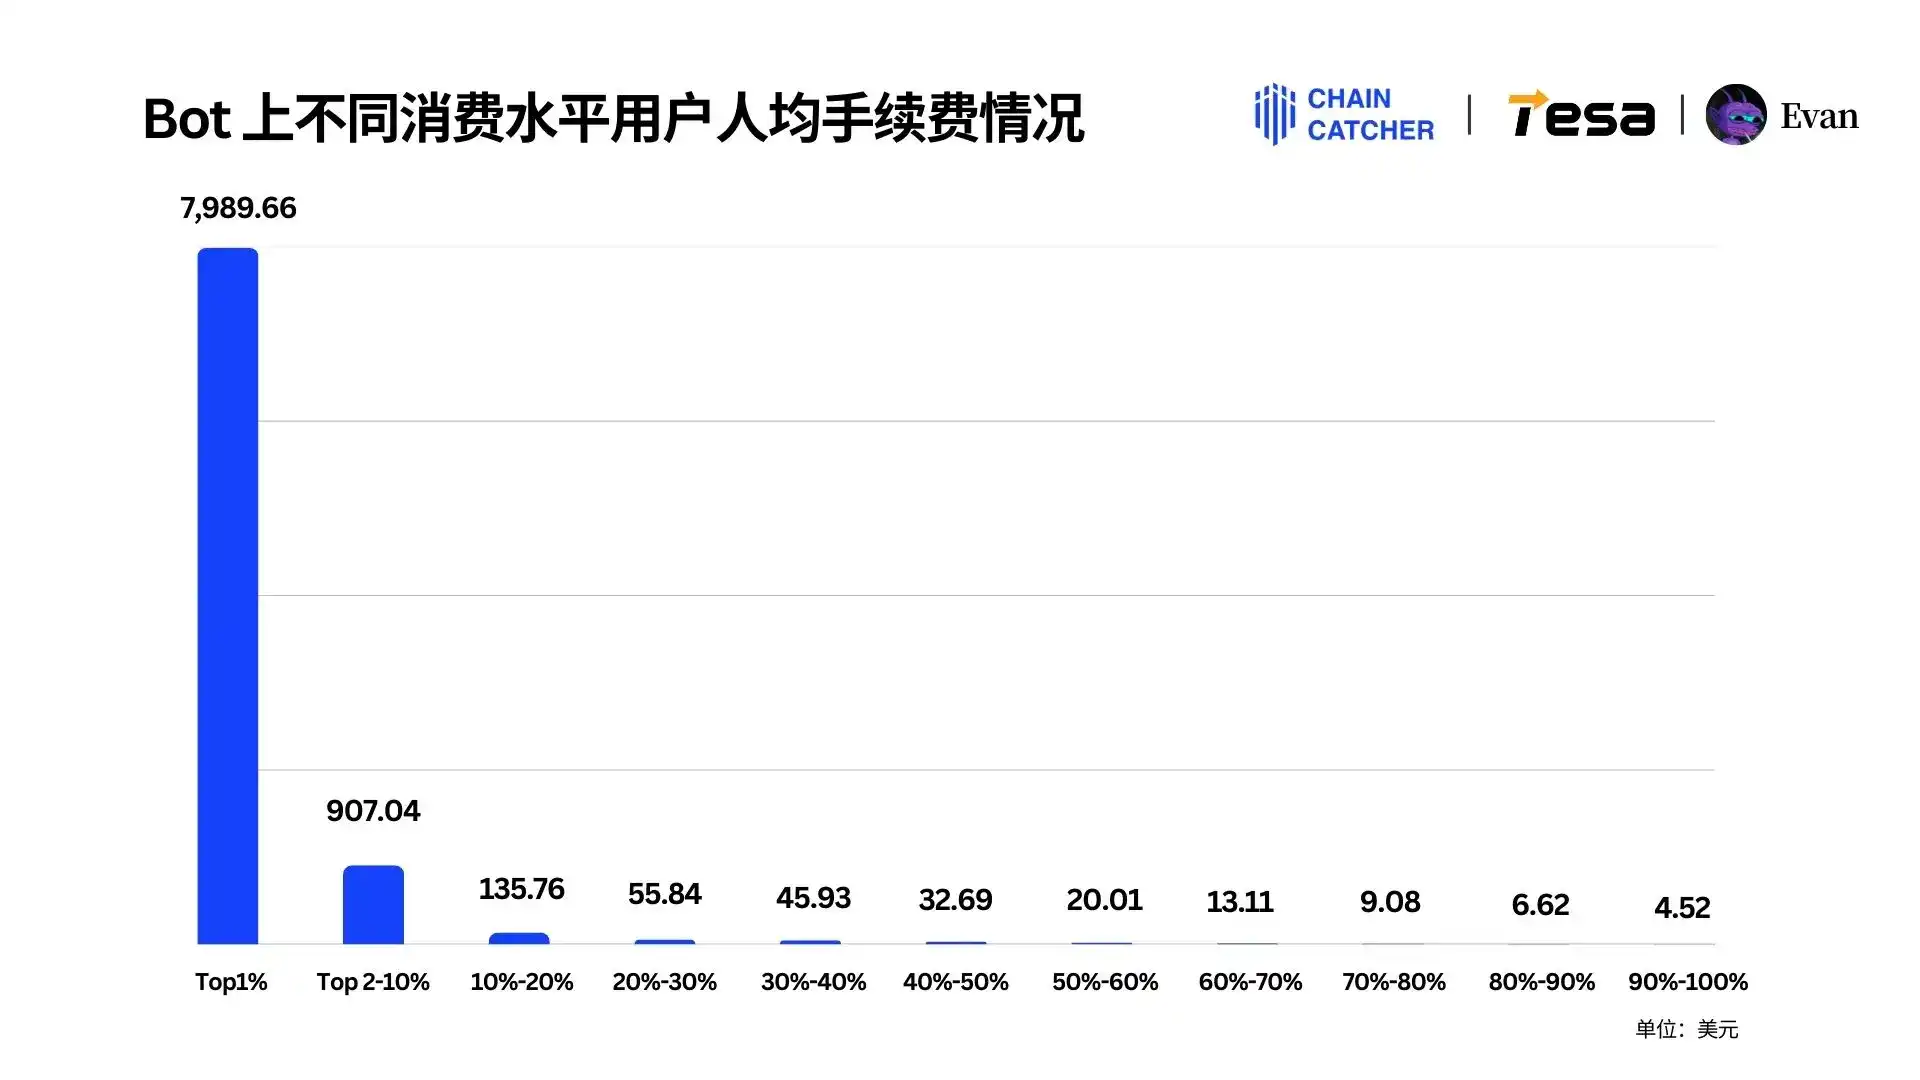
In terms of average transaction fees, the differences between the top users and long-tail users on Trading BOT and Pump.fun are also significant. The top 1% of Trading BOT users have an average transaction fee of $7,990, while those ranked 2%-10% are less than $1,000, and those ranked 20% are all below $60.
On Pump.fun, the top 1% of users have an average transaction fee of $2,467, those ranked 2%-10% are less than $300, and those ranked after 20% are below $50.

3. Raydium has the highest usage rate, with more than half of the users relying on Trading BOT
In the Solana DEX ecosystem, although Raydium's transaction fee rate (0.25%) is higher than Meteora's (0.16%), Raydium still attracts the vast majority of users with its strong market advantages. Statistical data shows:
· Among the approximately 4 million Solana addresses, about 89.27% (3.4968 million addresses) have used Raydium.
· In comparison, the total usage rate of Meteora and other DEXs is only 35.53% (1.3917 million addresses).
This phenomenon indicates that Memecoin users do not simply choose the trading platform based on the fee rate, but rather focus on factors such as liquidity, user experience, and platform stability.

In addition, the use of Trading BOT is also very common:
· More than 2.11 million addresses use Trading BOT, with a usage rate of 53.83%.
· In comparison, the usage rates of Pump.fun and Jito are 46.43% and 45.01% respectively, not yet reaching 50%.
These data reflect the high dependence of users on efficient and convenient trading tools, and also demonstrate the absolute dominant position of Raydium in the market.
4. More than half of the Bot users only use a single Bot platform
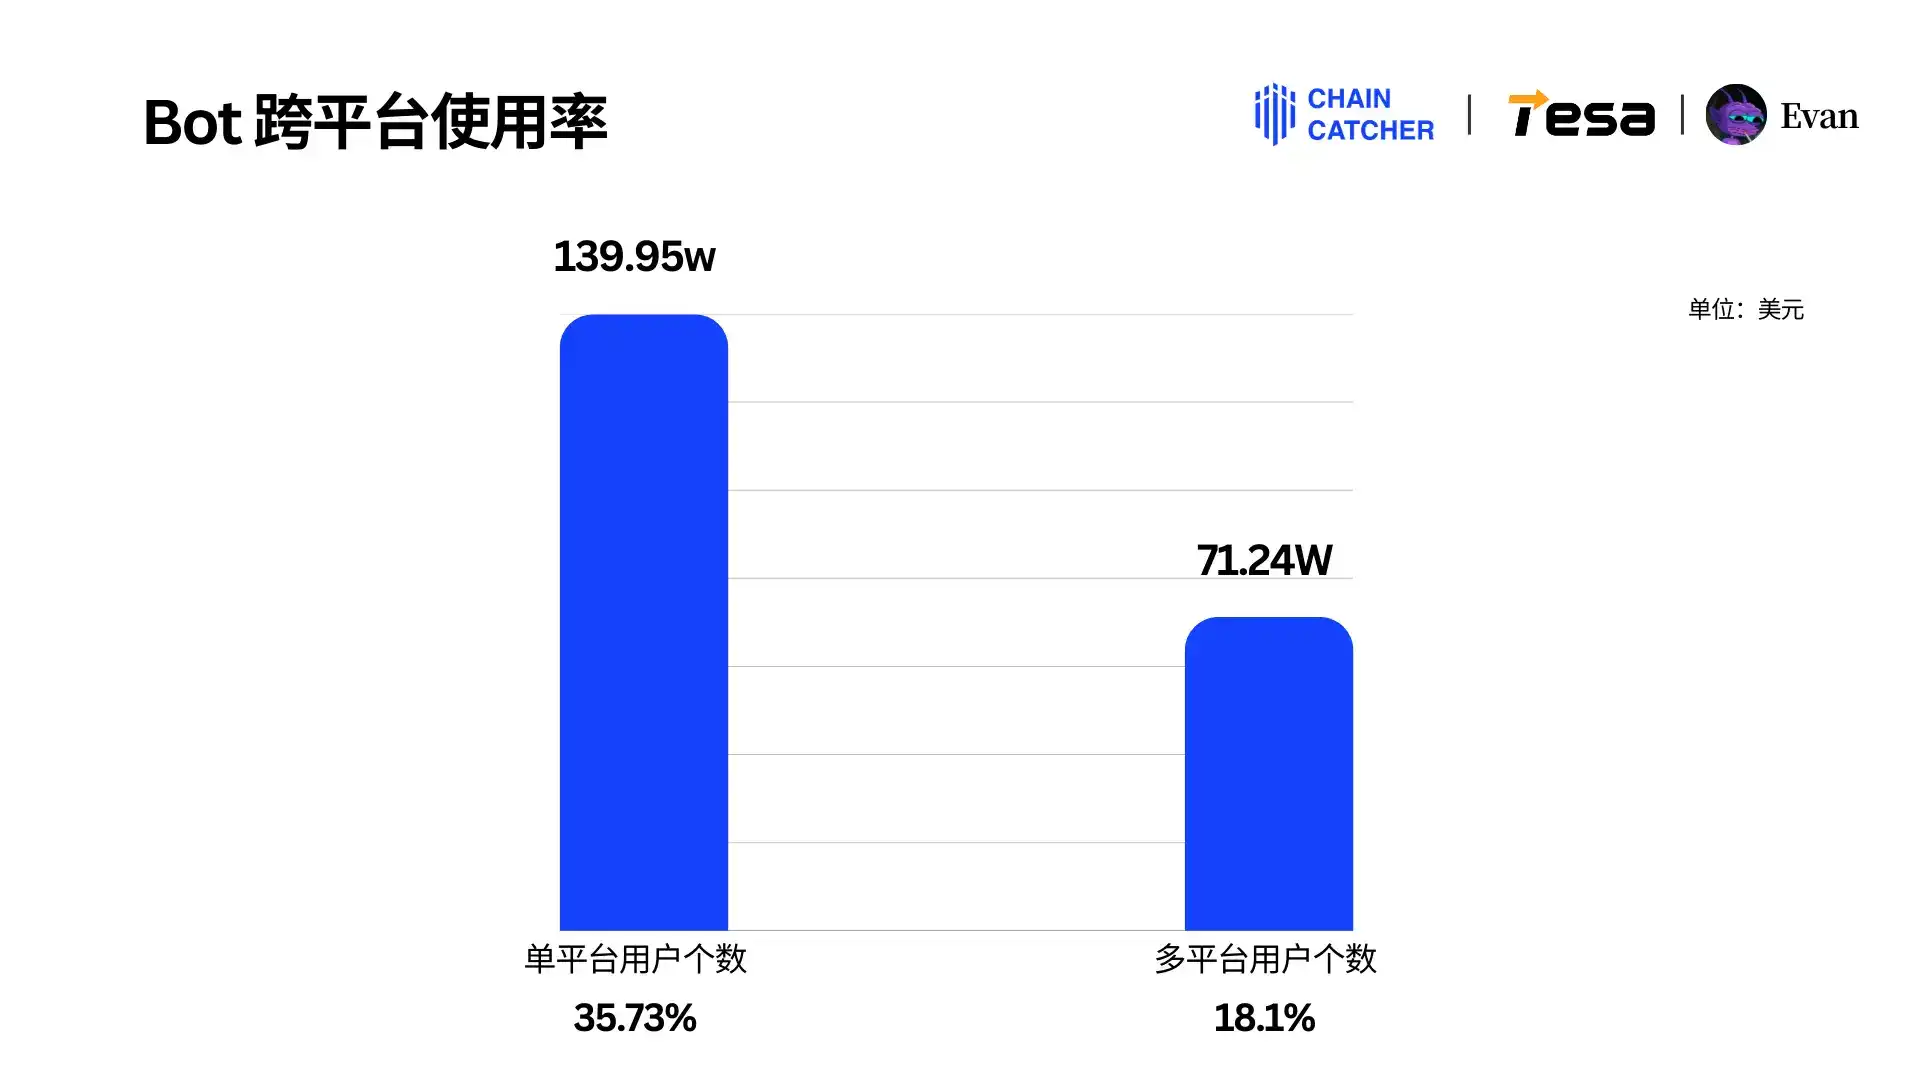
In the Trading BOT market, users' choices show obvious concentration. Data shows:
· 66% (1.3995 million) of BOT user addresses only use a single Trading BOT.
· 34% (712,400) of users choose to use multiple BOTs.
This ratio indicates that users have a high degree of loyalty to the selected BOT platform, or because the differences between platforms are not obvious, users lack the motivation to switch or use multiple platforms after choosing one BOT.
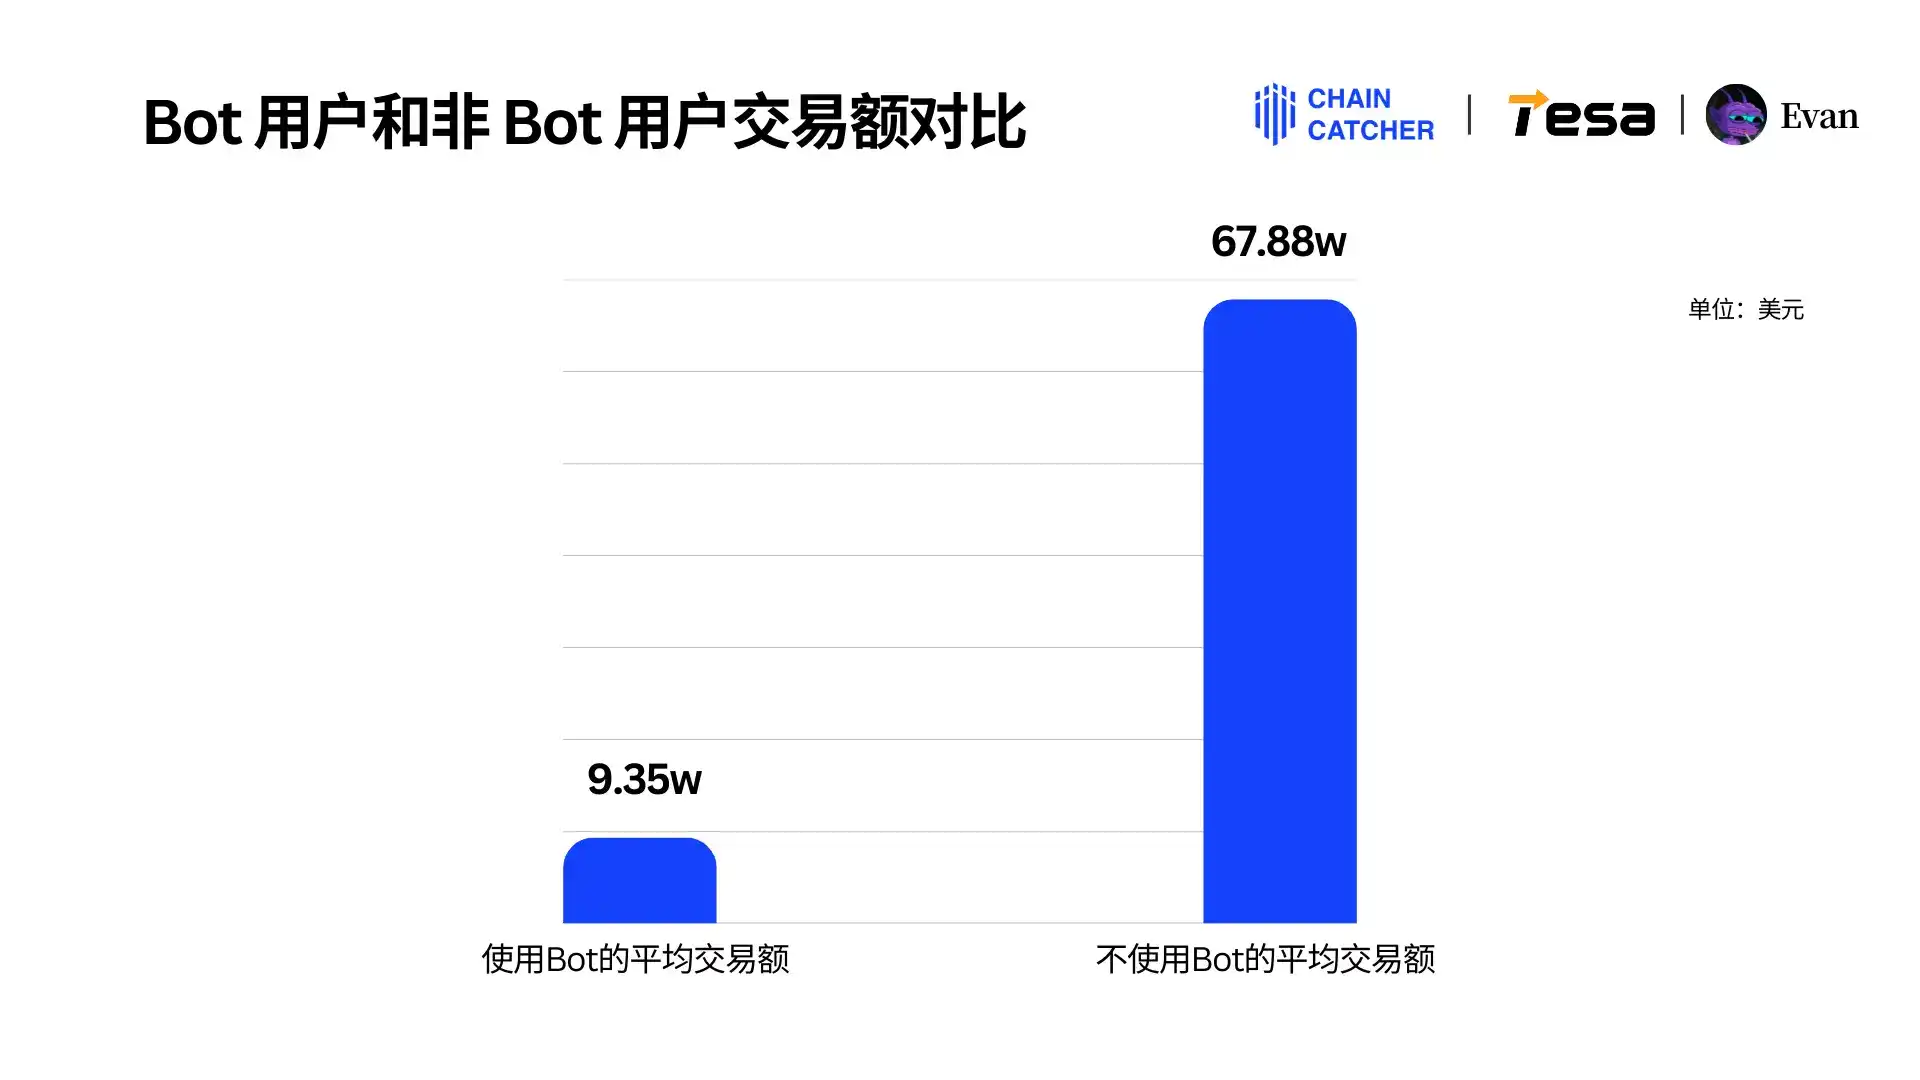
5. Users who do not use BOT have significantly higher transaction amounts
Compared to users who use Trading BOT, users who do not use BOT have average transaction amounts several times higher:
· Users who use BOT: Average transaction amount of $93,500.
· Users who do not use BOT: Average transaction amount of $678,800.
This data may reflect that the BOT user group has a larger proportion of ordinary users and novice users, while the whales with high transaction amounts are more inclined to manual operation or use of efficient tools to pursue more precise control.
6. Whales prefer Photon, while ordinary users are more inclined to Trojan
Users with different consumption levels show significant differences in their choices of Trading BOTs:
Whale users (top 5%)
· Photon is the most popular Trading BOT, contributing 38.9% of the transaction fees.
· Trojan is the second, accounting for 15.02%.
This choice indicates that whale users are more inclined to use powerful and stable Photon BOT.
Ordinary users (20%-30%)
· Trojan becomes the first choice of ordinary users, accounting for 19.27% of the total transaction fees.
· Photon and Bullx are ranked second and third, with 17.34% and 14.71% respectively.
The choices of ordinary users are more diversified, showing a wide acceptance of different BOT characteristics.
Novice users (bottom 25%)
· The choices of novice users are relatively scattered, with Trojan, Photon, PepeBoost, and Bullx being the main Trading BOTs, each contributing more than 10% of the transaction fees.
This distribution reflects that novice users tend to try multiple tools when using BOTs, rather than focusing on a single platform.

III. Analysis of the Top 10 Memecoin Consumption Addresses in 2024
1. 5 addresses have transaction fees exceeding $10 million, with the highest reaching $133 million
In the 2024 Memecoin transactions, the top 10 user addresses by total transaction fees exhibit an extremely high concentration of consumption, with 5 addresses having total transaction fees exceeding $10 million:
· MfDuWe: $133 million (fee rate 0.3%, total transaction amount $44.855 billion).
· kpqUj8: $19.86 million.
· YubQzu: $18.2 million.
· HBGdum: $11.9 million.
· 7vi5dy: $11.89 million.
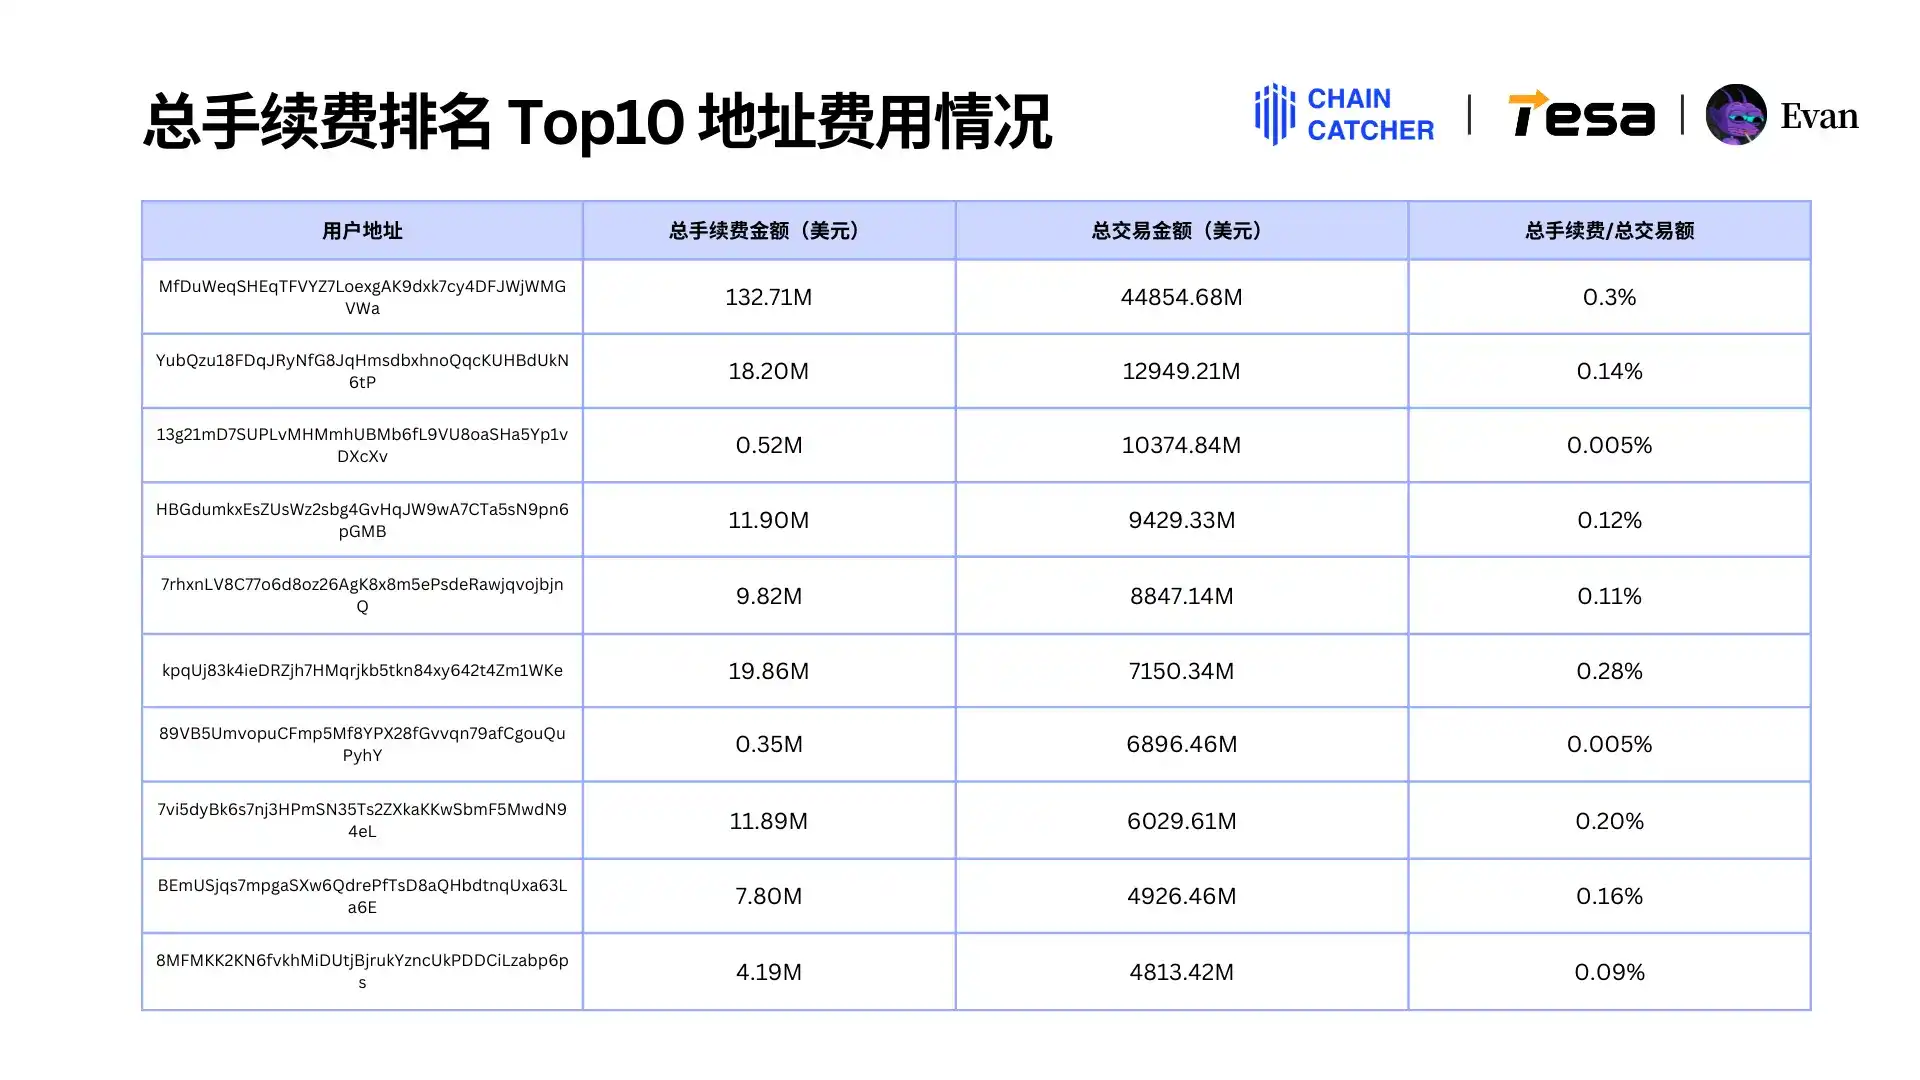
2. Comparison of the highest and lowest transaction fee users
· The address with the highest transaction fees, MfDuWe, exhibits a huge trading scale and expenditure, with fees accounting for 0.3% of the total transaction amount.
· In comparison, the fee rates of addresses 13g21m and 89VB5U are only 0.005%, the lowest level.
This data fully reflects the significant differences in consumption among different users in the Memecoin market, as well as the remarkable contribution of top users to the overall transaction fee income.
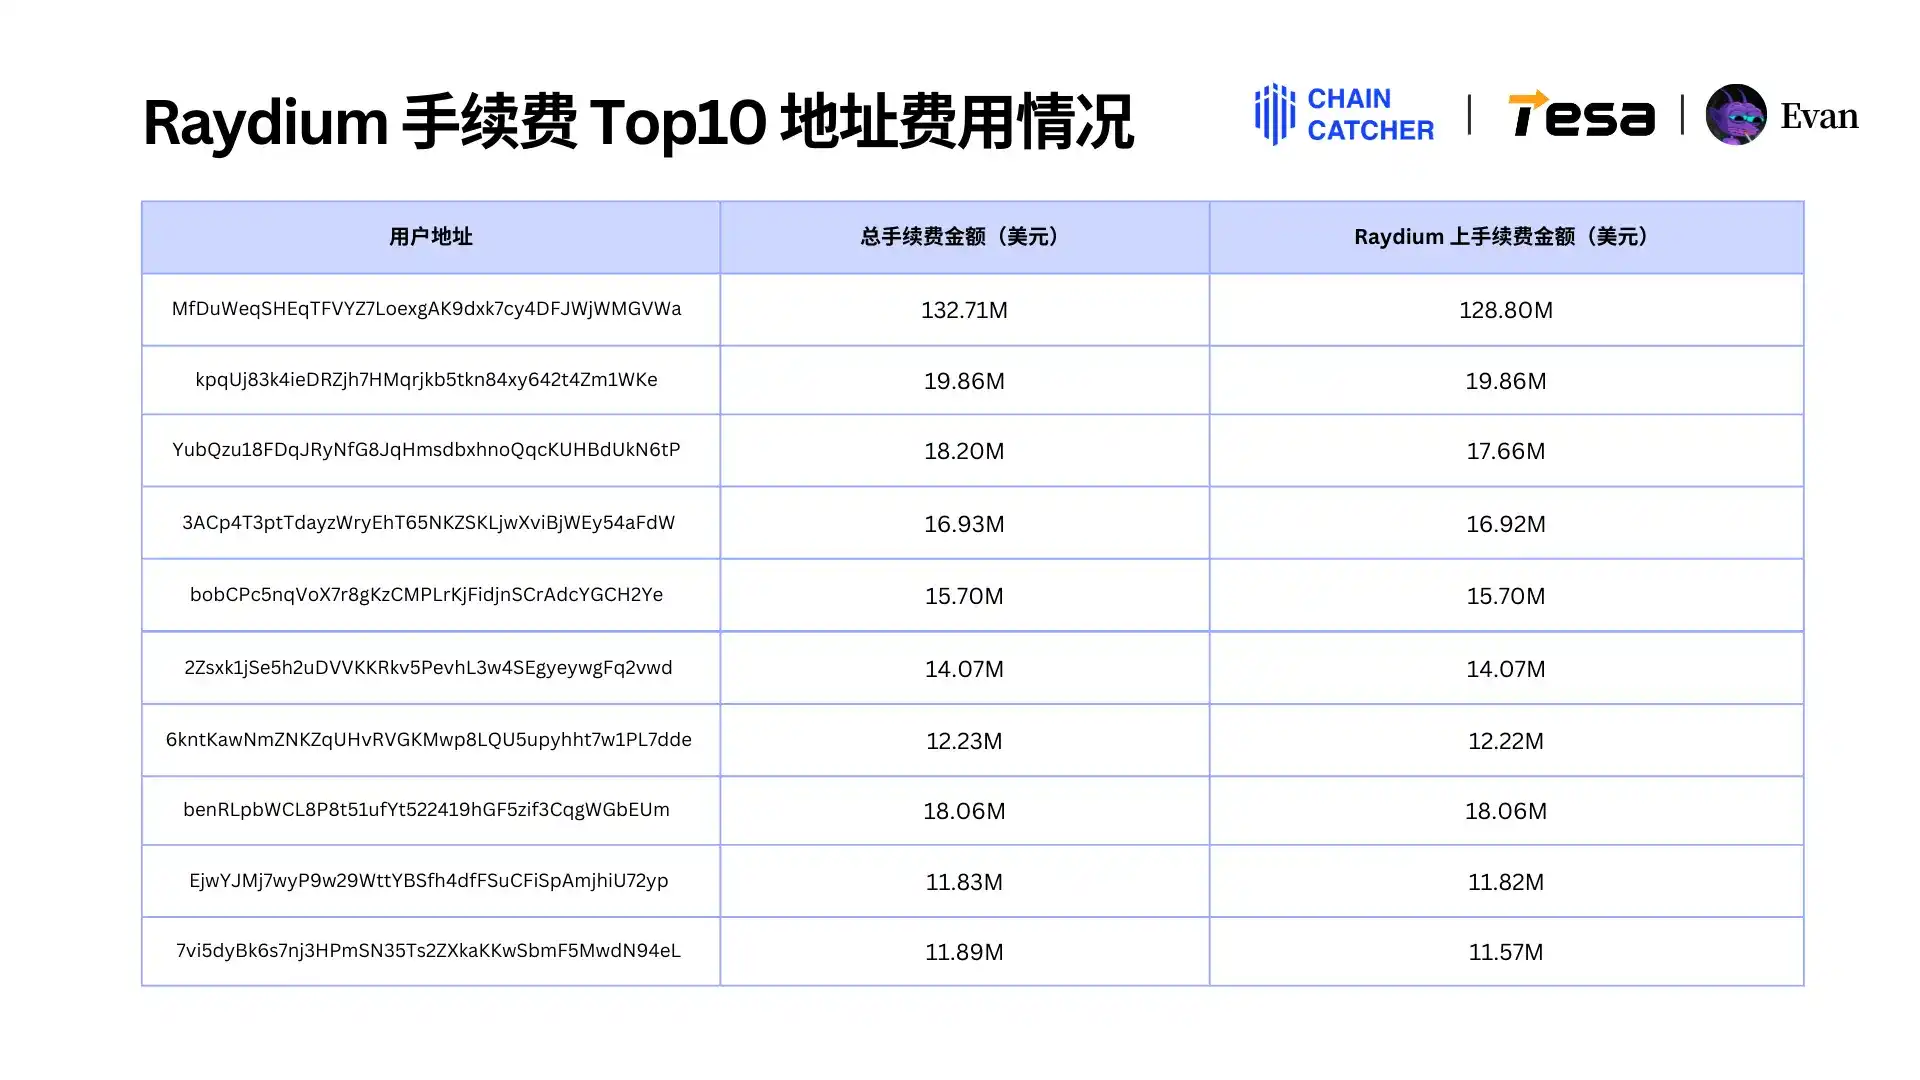
3. Details of the Top 10 addresses with the highest total fees on platforms such as Raydium, Jito, and Pump.fun
The Top 10 user addresses on the Raydium platform have contributed an extremely high amount of fees, with each address spending over 10 million US dollars in annual fees. These users have concentrated almost all of their fee spending on the Raydium platform. Details of the Top 10 addresses:
The fee amount range for the Top 10 addresses on the Jito platform is between 1.2 million to 6.2 million US dollars. Details of the Top 10 addresses:

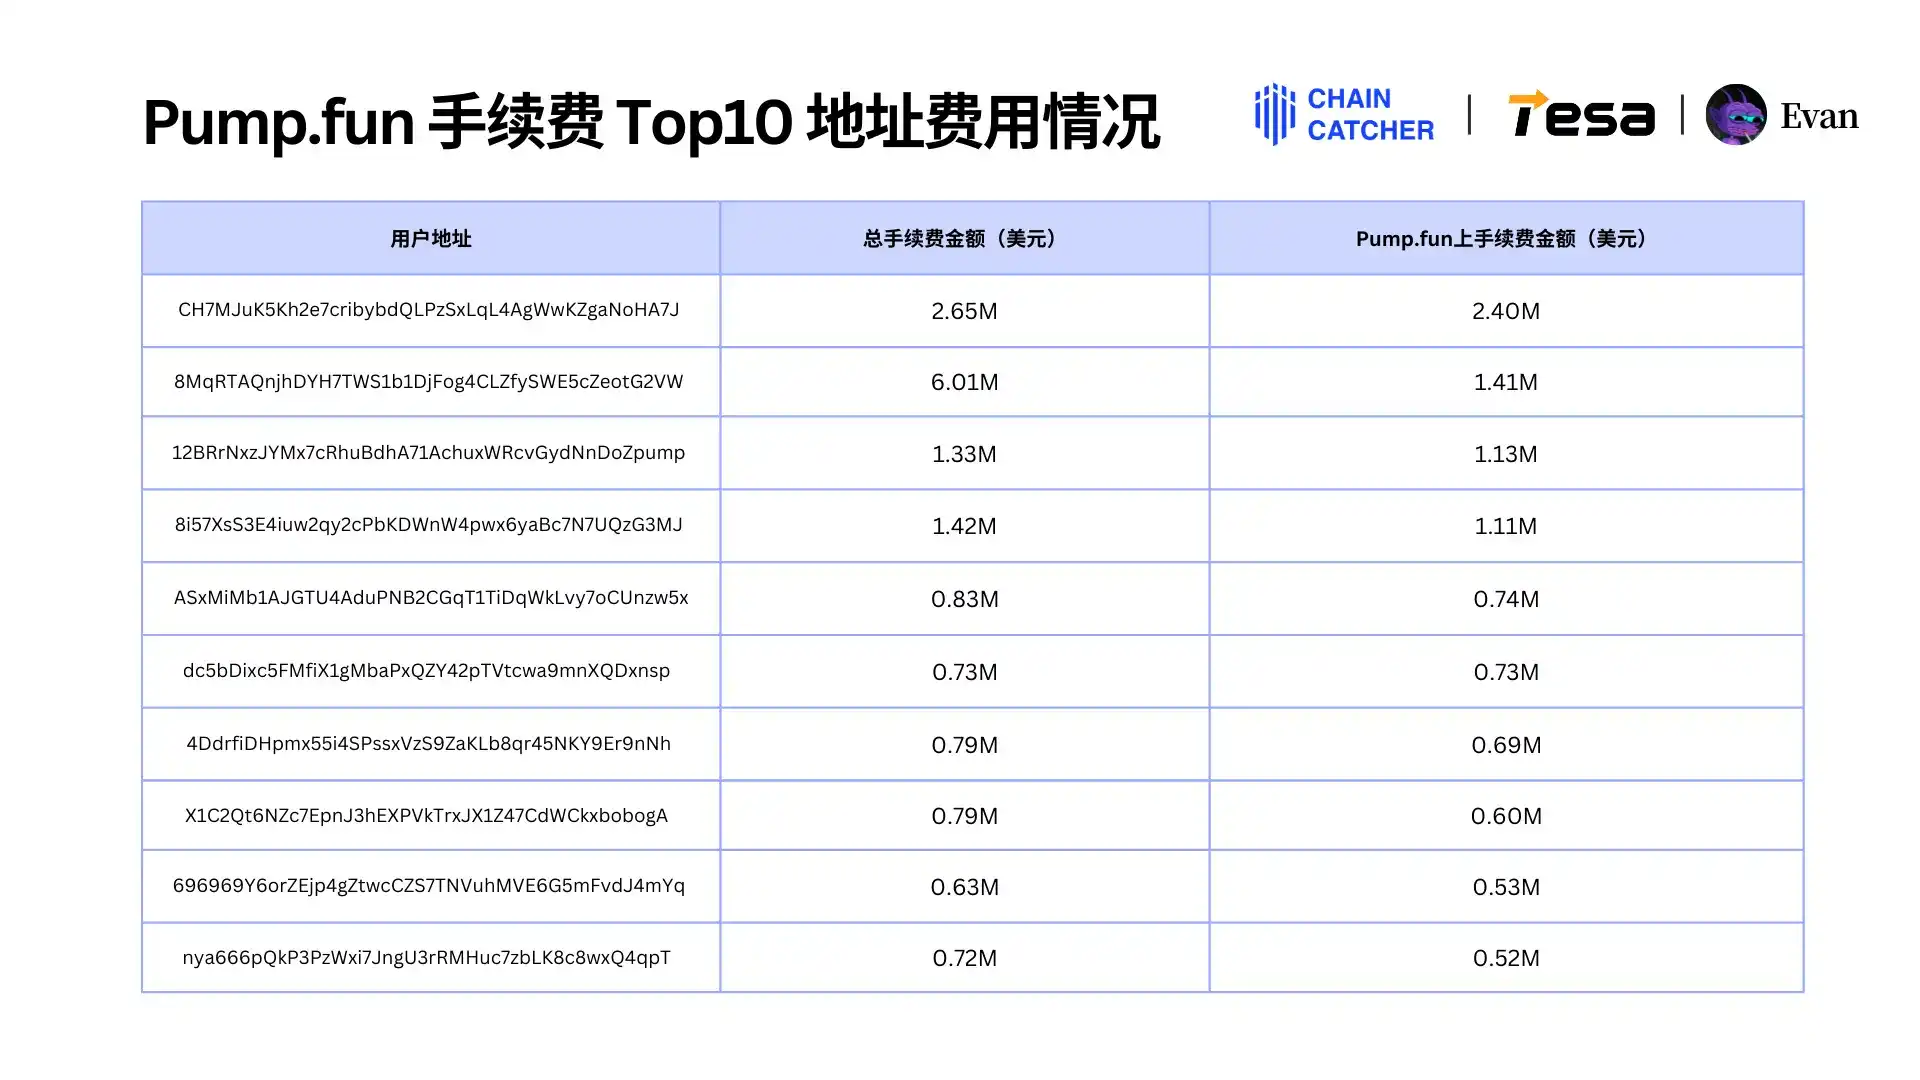
The fee amount range for the Top 10 addresses on the Pump.fun platform is between 500,000 to 2.4 million US dollars. Details of the Top 10 addresses:
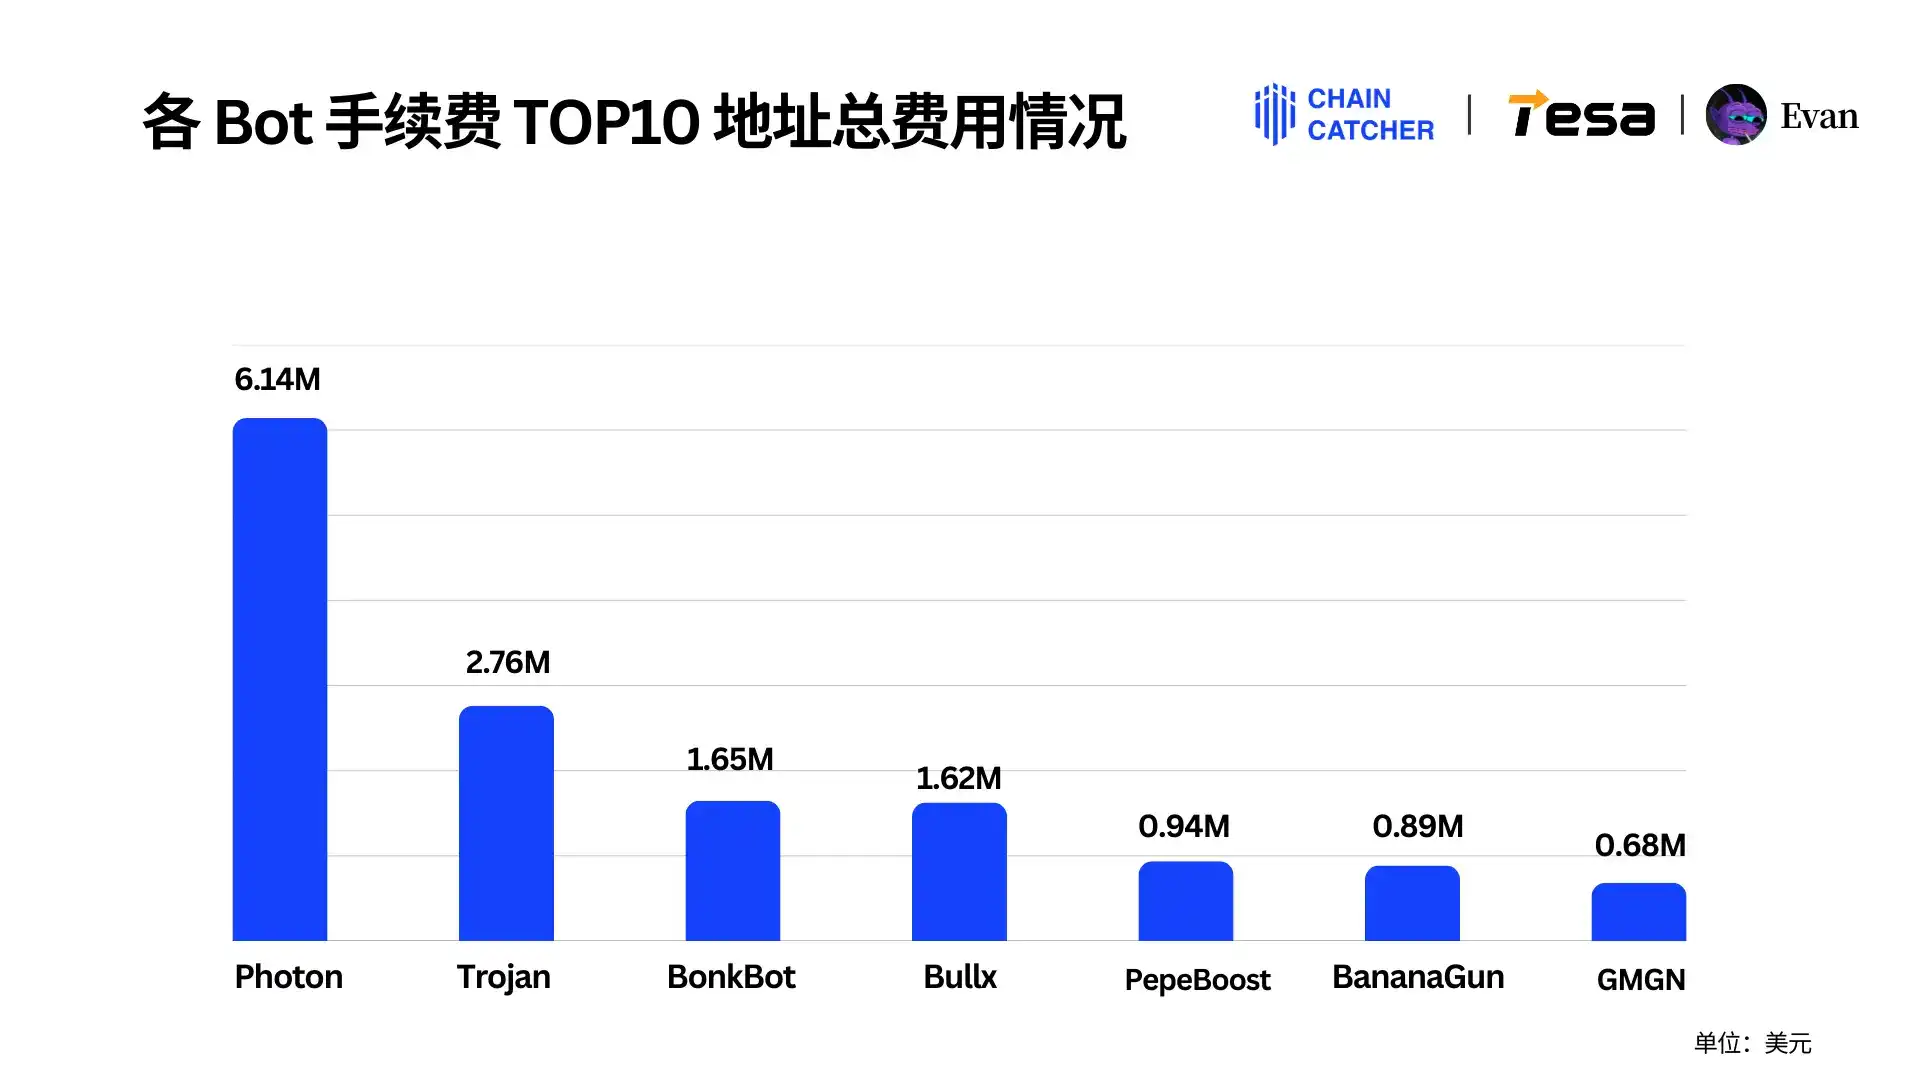
4. Details of the total fees paid by various Bots
IV. To check your personal 2024 Memecoin consumption bill, please refer to:
https://report.tesa.top/
Welcome to join the official BlockBeats community:
Telegram subscription group: https://t.me/theblockbeats
Telegram discussion group: https://t.me/BlockBeats_App
Twitter official account: https://twitter.com/BlockBeatsAsia


