Recently, with the violent fluctuations in the market, the phenomenon of forced liquidation has become an undeniable focus in the contract trading market. Coinglass data shows that on January 14, 2024 alone, the global cryptocurrency market saw forced liquidations amounting to $800 million, involving 264,389 users, with the largest single forced liquidation order valued at $24.9526 million.
Such high-frequency forced liquidations reveal the extreme volatility of the market and also highlight the lack of traders' grasp of market trends. At this time, the importance of the candlestick chart and its related indicators is becoming increasingly prominent, becoming an essential tool for traders. They can help users analyze trends, predict price fluctuations, and develop scientific trading strategies.
Candlestick Chart Indicators and Drawing Tools: Core Tools for Market Analysis
Gate.io Supports Up to 11 Types of Candlestick Indicators
The candlestick chart is a tool frequently used by traders to analyze the market, which can help us better understand market trends and make trading decisions at the right time.
On the Gate.io platform, there are many types of candlestick indicators available for use, mainly divided into main chart indicators and sub-chart indicators. Main chart indicators are indicators that are directly overlaid on the candlestick chart, synchronizing with the price trend to intuitively help us understand the current state of the market. Gate.io's main chart indicators cover support and resistance lines, MA (moving average), EMA (exponential moving average), BOLL (Bollinger Bands), and SAR (parabolic indicator).
Sub-chart indicators are displayed at the bottom of the candlestick chart, providing more data dimensions to help us analyze the market from different angles, including MACD (moving average convergence divergence), KDJ, RSI (relative strength index), WR (Williams' %R), OBV (on-balance volume), and StochRSI.
Candlestick indicators are not only for professional traders to use. In fact, both novice and experienced traders can benefit from them. For new users, simple indicators (such as MA and BOLL) can help quickly understand the market trend and determine when to buy or sell. For professional users, by combining advanced indicators (such as MACD and RSI), they can develop more refined trading strategies and improve the accuracy of investment decisions.
Gate.io Supports Up to 10 Drawing Tools
In addition to candlestick indicators, drawing tools are also very important auxiliary tools in market analysis. These tools can help users mark important price points, trend lines, and patterns on the candlestick chart, so that they can better understand the market trend and predict future price changes.
Gate.io provides a series of powerful drawing tools to help users conduct multi-dimensional analysis on the candlestick chart. These tools are mainly divided into line tools and shape tools. The line tools include segment, horizontal line, vertical line, ray, straight line, horizontal straight line, and horizontal ray; the shape tools include parallel channel, rectangle, and parallelogram.
Drawing tools have a wide range of applications in actual trading. By drawing trend lines and pattern charts, users can more intuitively identify the support, resistance, and potential breakout points in the market. Users can also conduct long-term trend analysis by saving the charts and markings, improving the accuracy and efficiency of their trading decisions.
Smart Support and Resistance Lines: A Trading Weapon Powered by Innovative Technology
In the rapid fluctuations of the cryptocurrency market, traders urgently need precise and efficient tools to grasp the opportunities. The smart support and resistance lines indicator launched by Gate.io was born out of this need. It combines advanced AI algorithms and the BOLL2.0 indicator to automatically identify key support and resistance lines in the market. These lines act as "road signs" for market prices, helping traders judge price reversals or breakthroughs, and make decisions to hold, buy, or sell.
The advantage of smart support and resistance lines lies in their automation, accuracy, and ease of use. It automatically generates support and resistance lines through real-time AI analysis of market data, avoiding the errors and time waste of manual drawing. As an industry pioneer, the smart support and resistance lines allow traders to set stop-loss and take-profit points more intuitively, optimize trading strategies, and benefit both novice and experienced traders in easily navigating the complex market analysis.
1-Second Candlestick Function, Empowering Refined Market Analysis
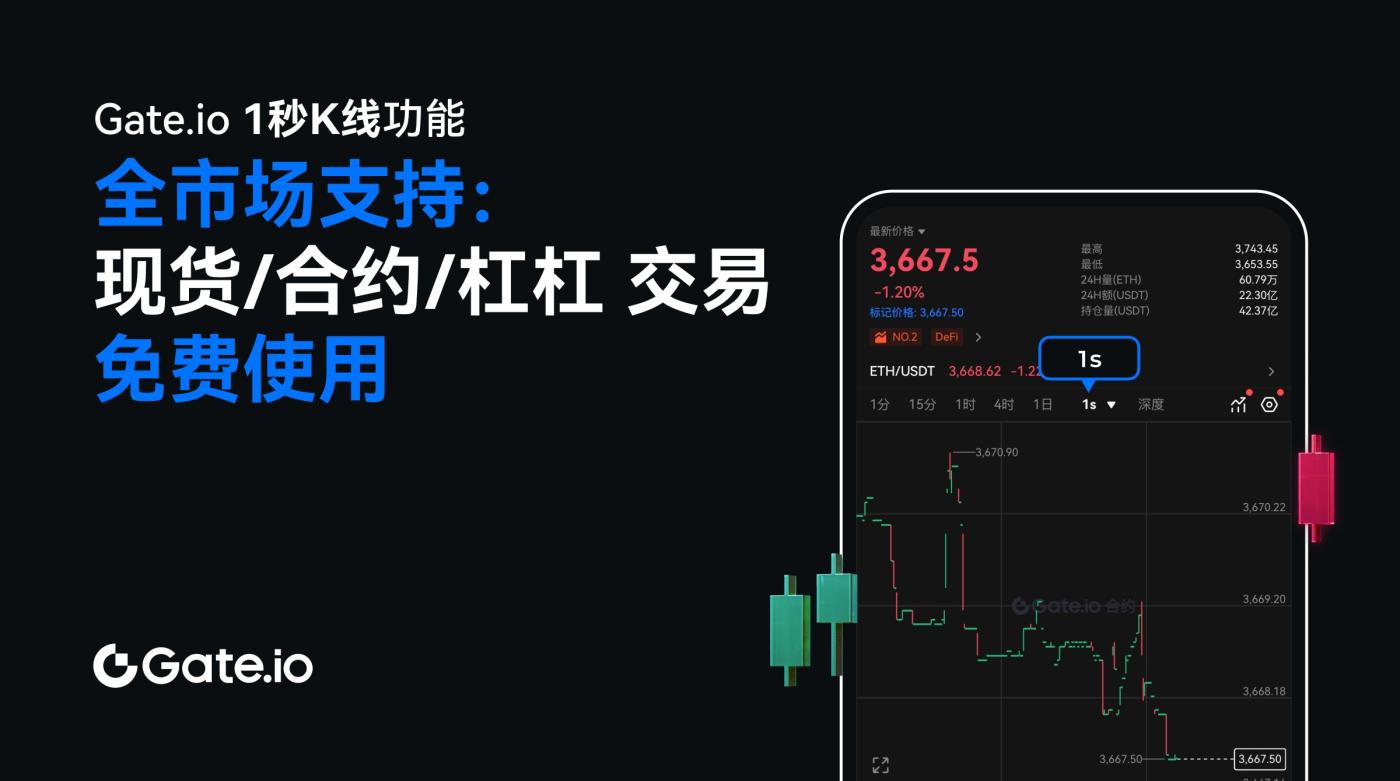
In the ever-changing cryptocurrency market, traders need more refined and timely market information to assist their decision-making. Gate.io's 1-second candlestick function was born out of this need. It displays market price changes at the second level, and this high-precision analysis tool is usually charged for on other platforms, but is completely free on Gate.io. The 1-second candlestick covers the spot, leverage, and contract markets, helping traders quickly capture minor price fluctuations, optimize trading strategies, and improve decision accuracy.
Compared to paid platforms, Gate.io's 1-second candlestick function allows ordinary users to easily access high-frequency data, narrowing the gap with professional traders. Currently, this function is unique in the market, and the main competitors have not yet provided similar services. In addition, Gate.io plans to launch more new indicators such as forced liquidation charts and basis rate in early 2025, further enriching the market analysis tools and helping users gain an advantage in the competition.
Practical Case Study: How to Use Indicators and Tools to Improve Trading Decisions
In cryptocurrency trading, theoretical knowledge is certainly important, but actual operation is the key. Through specific case studies, we can more clearly see how various indicators and tools play a role in actual trading, helping users make more accurate decisions.
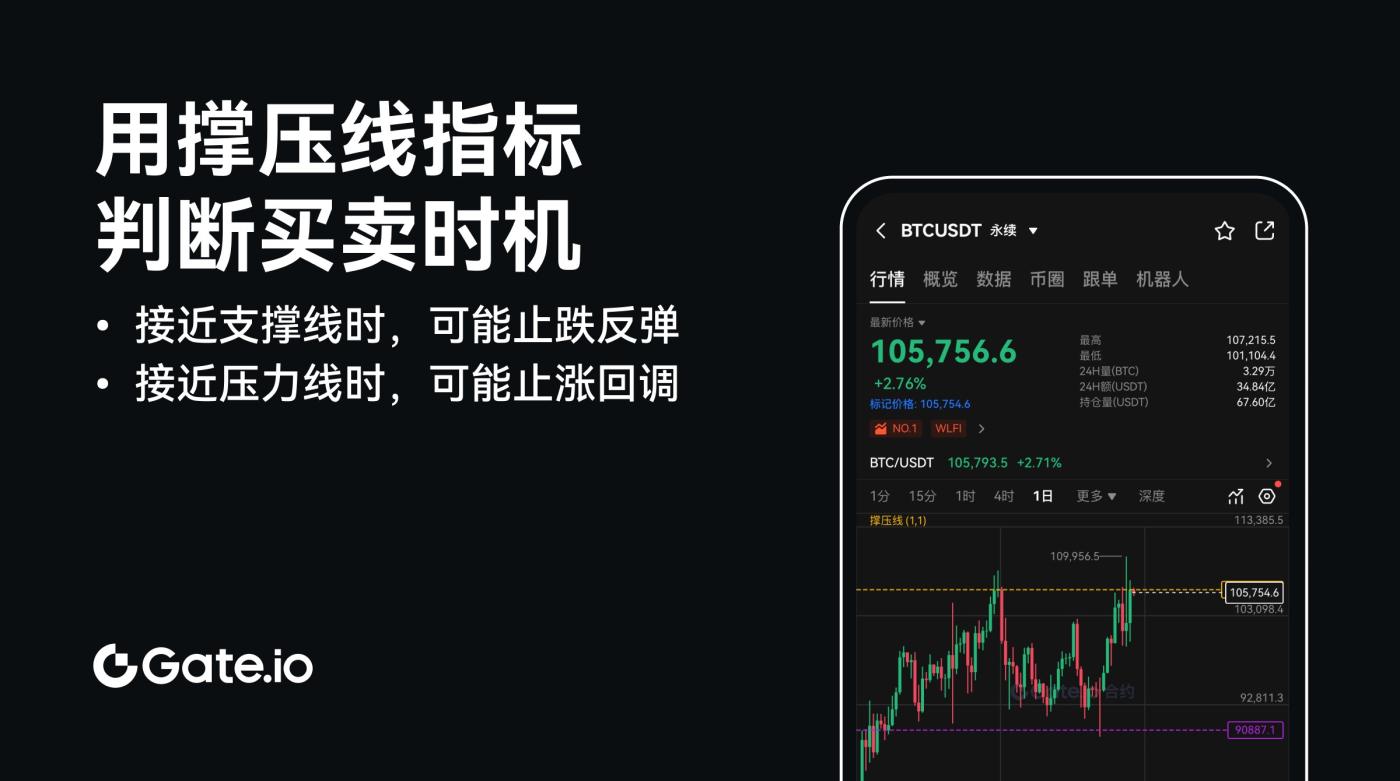
Use Support and Resistance Line Indicators to Determine Buy and Sell Timing
Adding support and resistance line indicators to the candlestick chart can assist in judging trading signals. When the price approaches the support line, it may stop falling and rebound, which is a potential buy signal; when the price approaches the resistance line, it may stop rising and pull back, which can be considered a take-profit or observation of whether it will break through.
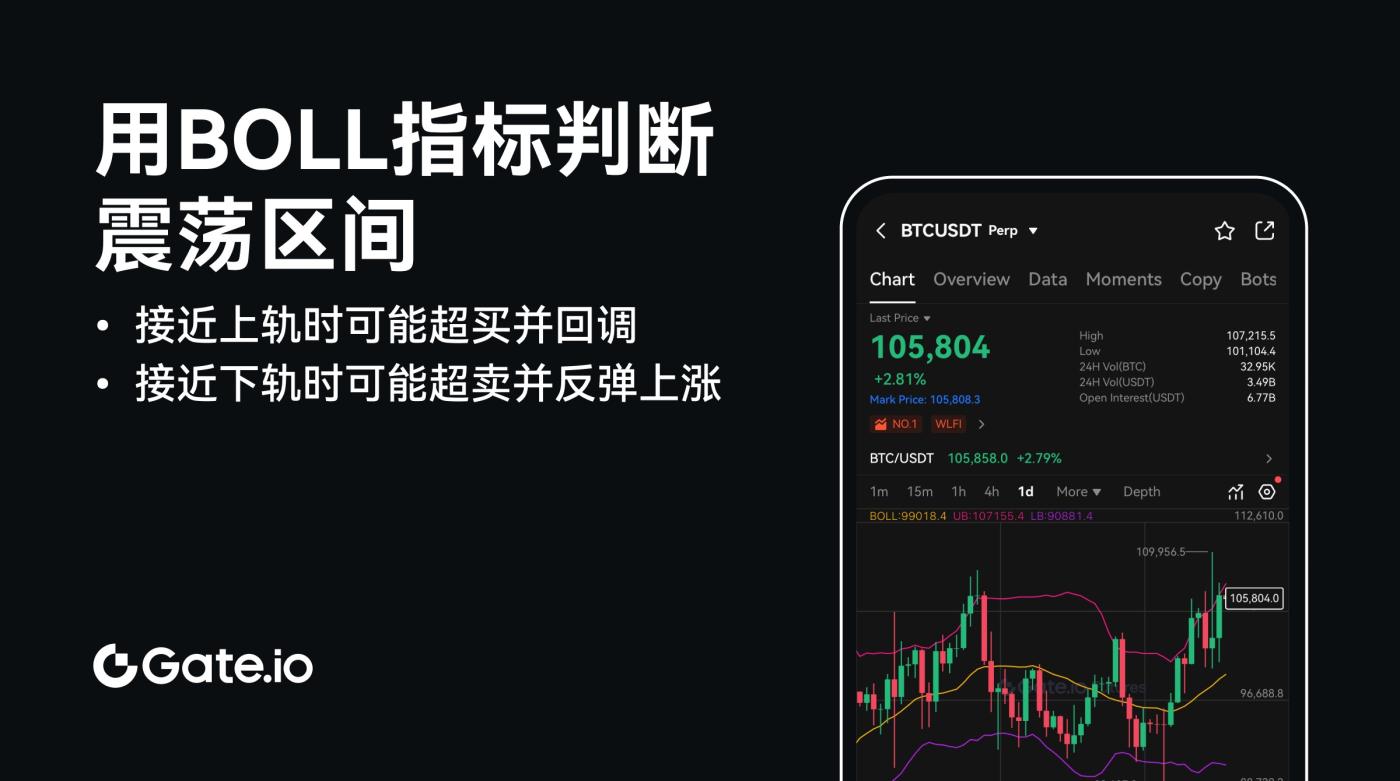
Use the BOLL Indicator to Determine the Oscillation Range
In a volatile market, the BOLL indicator (Bollinger Bands) can be used to reference the price fluctuation range. When the price approaches the upper band, it may be overbought and pull back, and when it approaches the lower band, it may be oversold and rebound upwards.
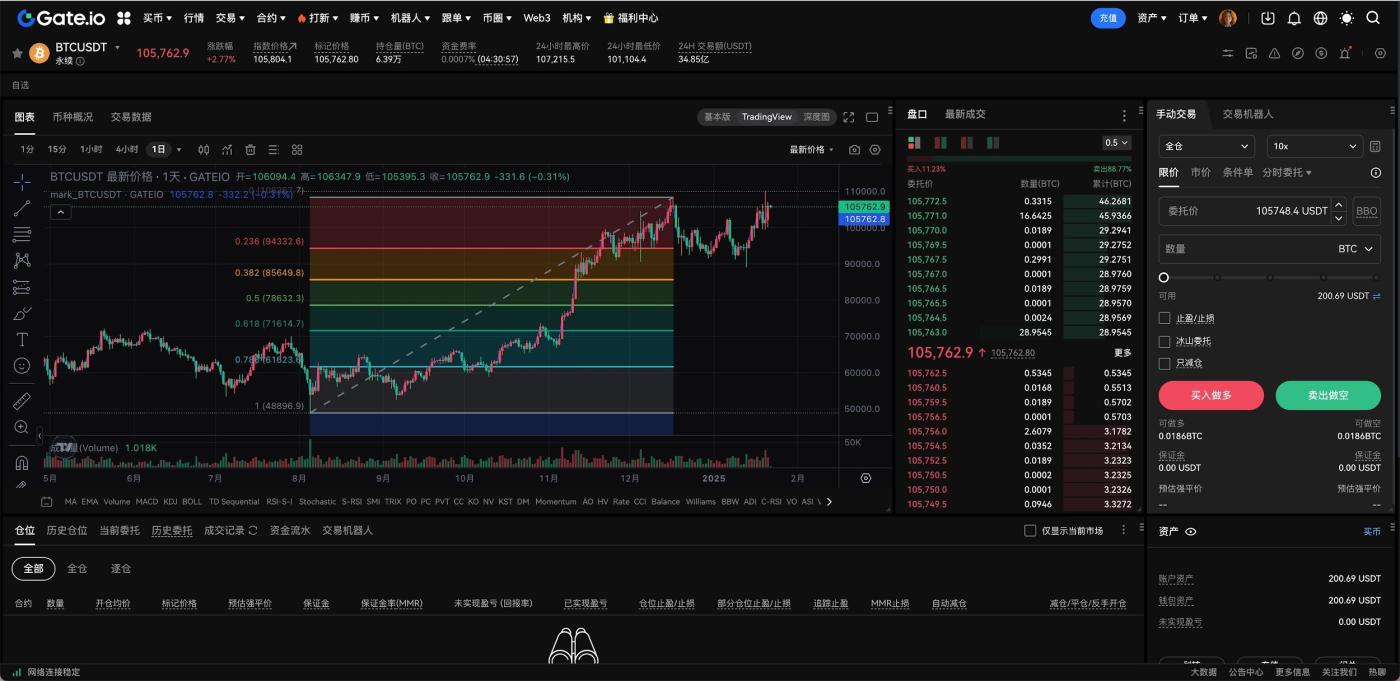
Use Fibonacci Retracement to Analyze Support and Resistance
The Fibonacci retracement tool is a classic method for analyzing support and resistance. In an uptrend, select the tool to mark the starting point (lowest point) and the ending point (highest point), and the system will automatically calculate and draw the retracement levels. These levels are the support or resistance levels where the price may pull back or rebound, and by observing their performance, you can more accurately judge the future trend.
Through these practical cases, we can see that different indicators and tools can provide unique insights in different market environments. Their combined use can help traders develop strategies more scientifically, reduce the blindness of decision-making, and achieve better trading results in the complex market.
In today's rapidly developing and highly volatile cryptocurrency market, the use of scientific tools and indicators has become an indispensable part for traders. Technical analysis tools can improve the accuracy of trading decisions and provide users with deeper market insights. The effective application of these tools allows users to make more rational and scientific decisions in the complex and changing market environment, reducing risks and increasing returns.