Introduction
In the midst of the crypto market's dramatic plunge, what is the future outlook? In this market turmoil, perhaps we can find some clues from the analysis of Grok3, Elon Musk's latest "most intelligent artificial intelligence". As a cutting-edge technology, Grok3 claims to be able to accurately predict market changes, and it may reveal the future trend of the crypto market for us.
Technical analysis, as a tool to predict price movements by studying historical price charts and combining various indicators, although not absolutely accurate, provides us with valuable market insights. Through technical analysis, we can identify potential support and resistance levels, the direction of trend changes, and fluctuations in market sentiment.
Bitcoin: Support and Resistance Levels
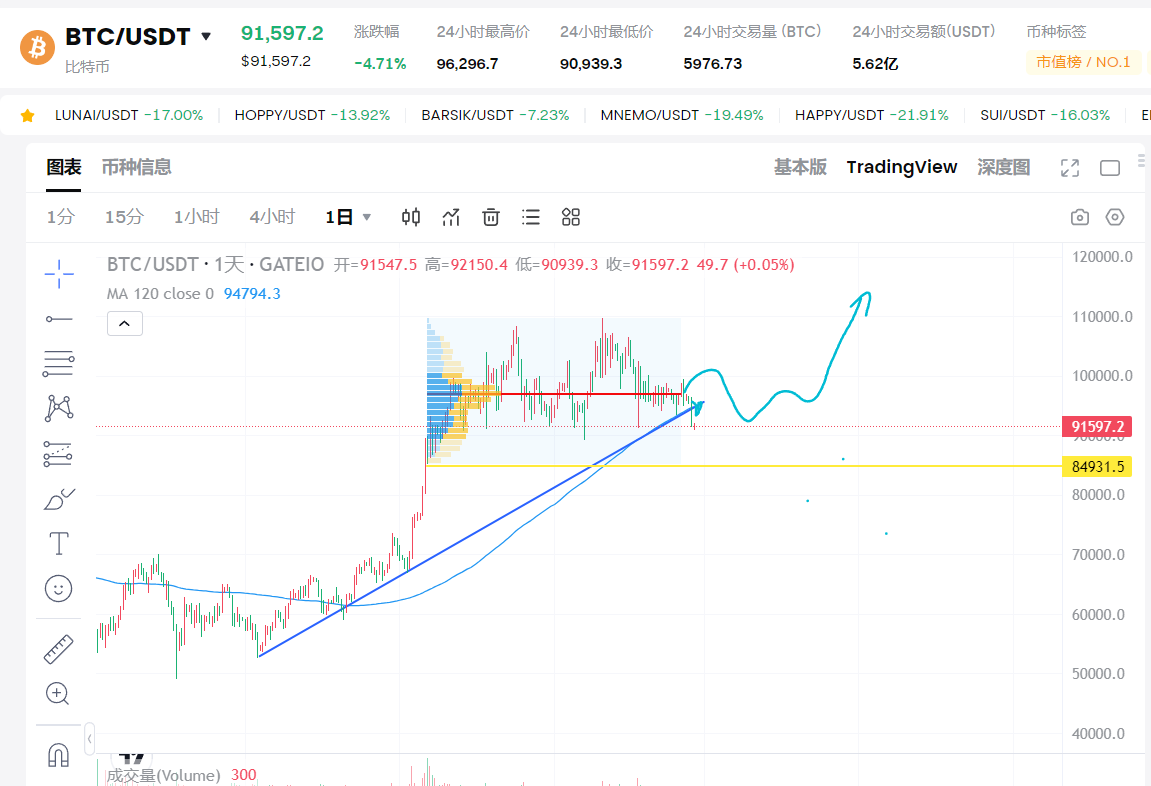
For Bitcoin, the recent drop below $91,000 has brought it to a critical support level. This level has long been seen as strong support, and if it can hold, Bitcoin may rebound and attack the next resistance level of $95,000. However, if the support level is breached, the next important support level is around $85,000, and if the selling pressure continues, it may test this level.
From the moving averages, the 50-day moving average is currently above the 200-day moving average, indicating that the long-term trend is still bullish. However, the recent price volatility has pushed Bitcoin close to the 50-day moving average, and if it breaks below this level, it may signal a change in momentum.
The Relative Strength Index (RSI) is currently in the oversold area, indicating that the selling pressure may be nearing an end and the possibility of a rebound is increasing. However, the RSI alone is not enough to predict a reversal, and other factors need to be considered.
Ethereum: Trend Analysis
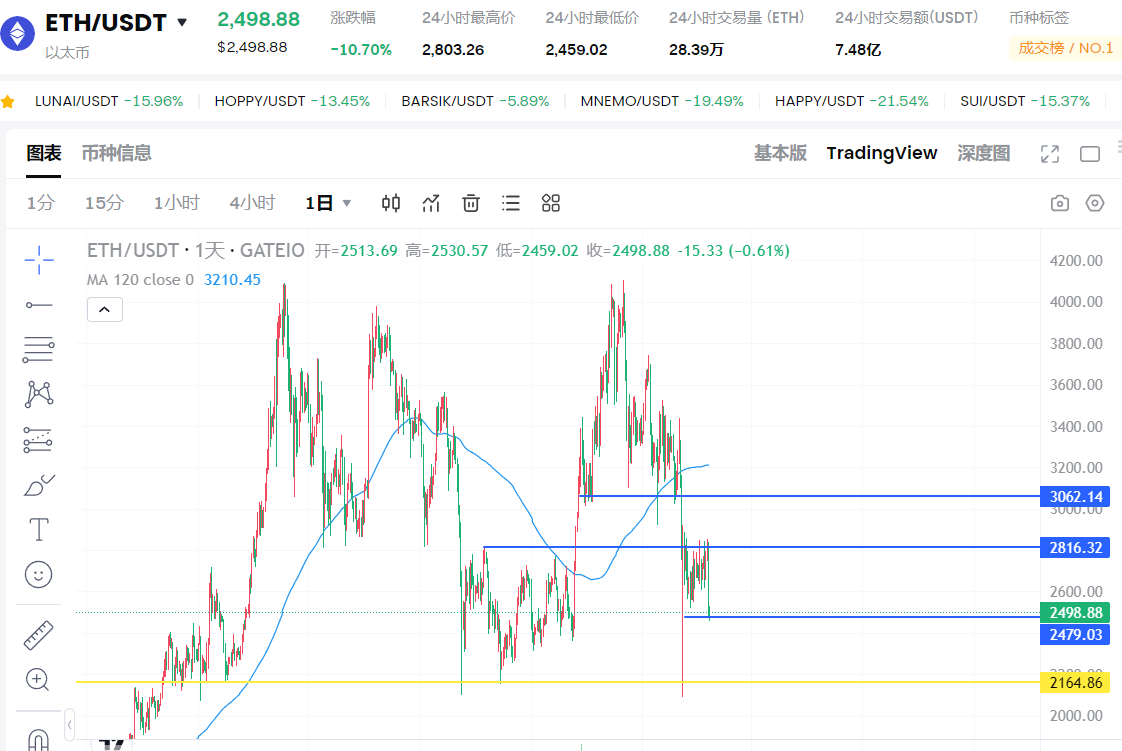
For Ethereum, the $2,400 support level is crucial. If this support level can be maintained, Ethereum may rebound to the $2,800 resistance level. Conversely, if it breaks below the $2,400 support, it may decline to $2,200.
Ethereum's price chart shows a series of lower highs and lower lows, indicating a downward trend in the market. However, the recent price action has formed a potential double bottom pattern, and if confirmed, it may signal an impending reversal.
Ethereum's MACD indicator shows bearish momentum, with the MACD line below the signal line. If a golden cross occurs, it may indicate a change in trend.
Solana: Consolidation and Volatility
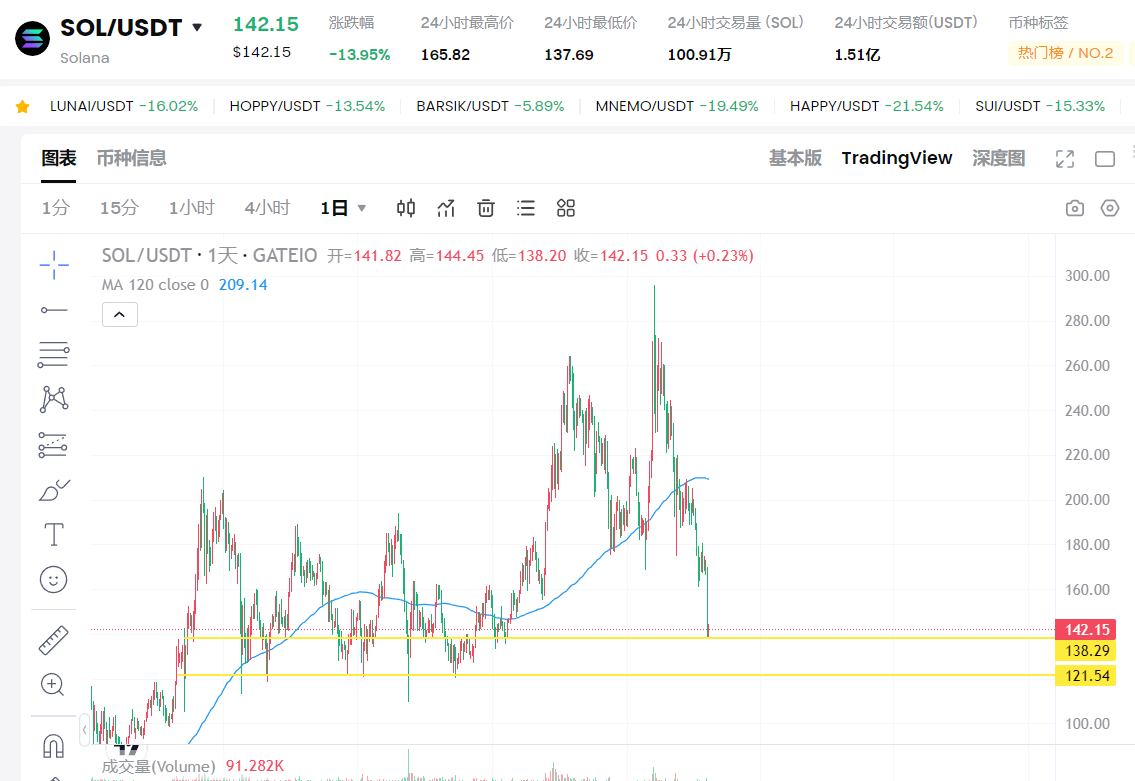
The support level of $130 is crucial for Solana. If it can maintain above this level, Solana may rebound to $160, while a break below this support may cause it to fall to $120.
Solana's price is currently in a consolidation phase, fluctuating between $130 and $160. A breakout of this range may determine the next significant price trend.
Solana's Bollinger Bands are narrowing, indicating that current volatility is low, which usually precedes significant price movements. Traders should watch for a Bollinger Band breakout to gauge the direction of the market.
Outlook for the Next Three Months
Looking ahead to the next three months, the crypto market will be at a critical juncture. If positive regulatory news from the US emerges, it could serve as a catalyst for market recovery. Conversely, if regulatory progress is delayed or setbacks occur, the current volatility period may be prolonged.
Investors should also monitor macroeconomic indicators, such as inflation data and central bank policy decisions, as these factors may impact risk appetite and the degree of capital inflow into the crypto market.
Outlook for the Next Year
Looking ahead to the next year, the crypto market is expected to see potential recovery and growth. If the global economy stabilizes, and inflationary pressures ease, investor confidence is likely to rebound, driving capital inflows into the market.
Furthermore, as the regulatory framework gradually improves, institutional investors may feel more comfortable allocating funds to cryptocurrencies, further expanding the market.
Technological advancements will also play a crucial role. The continued development of Decentralized Finance (DeFi), Non-Fungible Tokens (NFTs), and other blockchain applications may create new use cases and drive demand for cryptocurrencies.
If the global economy remains stable, the regulatory environment becomes clearer, and technological progress and adoption rates improve, the market will be supported. Specifically:
Bitcoin: With the support of favorable regulatory policies and continued institutional capital inflows, the price may reach $150,000 by the end of 2025.
Ethereum: As Ethereum continues to evolve and the DeFi ecosystem matures, the price may reach $5,000 by the end of 2025.
Solana: Leveraging its high throughput and low-cost advantages, the Solana ecosystem may continue to attract developers and users, and the price may reach $400 by the end of 2025.
Conclusion: A Balanced Outlook for the Crypto Market
In conclusion, the crypto market's plunge on February 25, 2025, serves as a reminder of its inherent volatility and the complex influence of various factors on its trajectory. Through a detailed analysis of macroeconomic data, regulatory information, on-chain data, and technical analysis, we have explored the potential trends over the past three months and the past year.
In the short term, the market may continue to face pressure from economic uncertainties, the aftermath of the Bybit hack, and adjustments to the new regulatory framework. However, if key support levels can be maintained and positive catalysts emerge (such as favorable regulatory progress or improvements in on-chain indicators), the market may see a rebound.
Looking ahead to the next year, the outlook is more optimistic. If the global economy stabilizes, inflationary pressures ease, and the regulatory environment becomes clearer.