Original Title: Liquidations, liquidations everywhere!
Original Author: threesigmaxyz
Original Compilation: zhouzhou, BlockBeats
Editor's Note: This article discusses the significant gap between the liquidation data reported by CEXs and the actual liquidation activity, by comparing the transparent liquidation data from Hyperliquid with the reported data from CEXs, revealing that CEXs may be underreporting liquidation data to conceal market volatility or manage public perception. The article also emphasizes the importance of transparency in understanding market risks and systemic risks, and notes that exchanges like Bybit are taking more open measures to publish liquidation data, driving the industry towards greater transparency.
Original Content (edited for readability):
Traders get liquidated, billions of Dollars evaporate. But what if the real liquidation numbers are 19 times higher than reported? We pulled the data, and the results are even worse than you think.
1. Liquidations
The world of trading is becoming increasingly accessible to the average person, whether through the glamorous courses of so-called "gurus" or as an alternative to traditional employment, offering the allure of potentially lucrative income from the comfort of one's own home with just a computer.
However, this is far from easy, and if it were that simple, everyone would succeed. In fact, most people who enter trading ultimately lose money and end up blowing their accounts. So, what causes these losses? Usually, it all comes down to a decisive event that every trader fears: liquidation.
Liquidation is a key mechanism in leveraged trading, where a trader's margin is insufficient to cover the losses on their open positions. In such cases, the exchange steps in and automatically closes the position, ensuring the trader or platform does not incur further losses.
Depending on the severity of the margin deficiency and the platform's risk management mechanisms, liquidations can take different forms:
· Partial Liquidation: Involves reducing a trader's position partially, with the remaining portion still active. This allows the trader to remain in the market while reducing the associated risk.
· Full Liquidation: The entire position is closed, completely eliminating the trader's exposure. Full liquidations are more common in high-leverage environments, where even small price movements can wipe out a trader's entire margin.
Key Factors Behind Liquidations
There are multiple factors that contribute to liquidations, all revolving around the delicate balance between risk and margin:
· Leverage: Leverage allows traders to control larger positions with less capital, but this amplification of potential profits also comes with higher risk. The higher the leverage, the smaller the price movement required to trigger a liquidation. For example, with 50x leverage, a mere 2% adverse price movement can result in a complete loss of margin. This makes risk management crucial in leveraged trading.
· Maintenance Margin: Each exchange sets a minimum margin requirement that traders must maintain to keep their positions open, serving as a safety buffer. When losses cause the margin to fall below this threshold, the exchange will liquidate the position to prevent further losses. Ignoring or failing to monitor these requirements can quickly lead to forced liquidations.
· Market Volatility: Sudden, extreme price movements are a trader's worst enemy, especially in highly leveraged positions. Volatility can quickly deplete available margin, leaving little time for the trader to react. Additionally, periods of high volatility often trigger a chain reaction of liquidations, where one liquidation triggers a series of others, further driving prices in the wrong direction.

Squeezes
Squeezes are one of the most violent and rapid triggers of liquidations, typically occurring during rapid price movements that force traders with opposing positions to close them. These events are often driven by high leverage and low liquidity, creating a snowball effect that accelerates price movements and exacerbates market volatility.
When prices rise rapidly, traders holding short positions find themselves in trouble as their margin is insufficient to support the trade. To avoid further losses, they are forced to buy back the asset to close their positions, adding more upward pressure on the price. This dynamic often quickly evolves into a series of liquidation events, where one trader's liquidation drives the price higher, forcing others to also close their positions.
Conversely, when prices suddenly drop, traders with long positions face the same risk. As their margin shrinks, they are forced to sell their positions to meet the maintenance margin requirements, further exacerbating the downward momentum. This selling pressure amplifies the price decline, triggering more liquidations and a downward spiral.
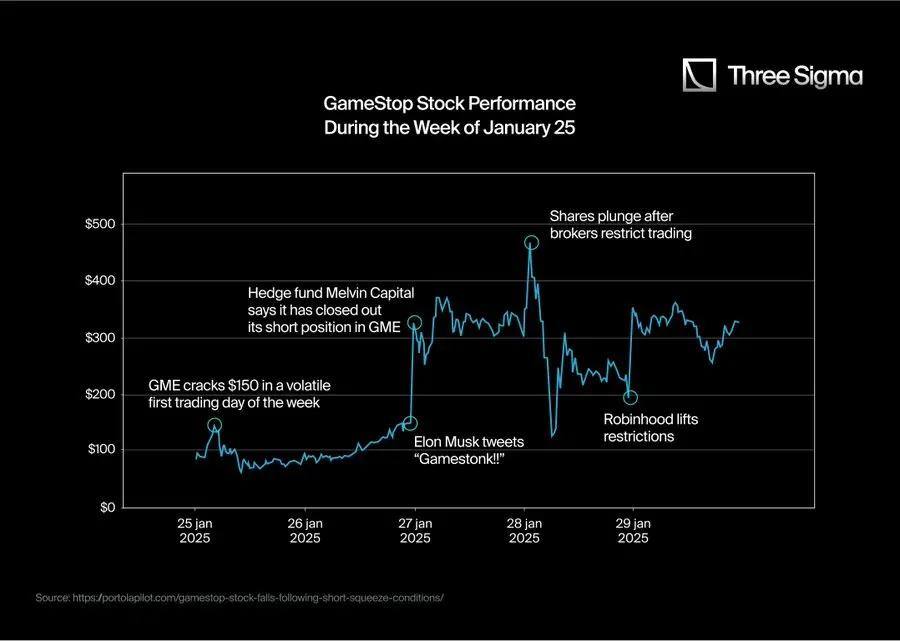
However, coordinated retail buying, particularly driven by communities like Reddit's WallStreetBets, has led to unexpected stock price surges. As prices rise, short-sellers are forced to buy back the stock, and the price continues to climb, further fueling the price increase.
This feedback loop ultimately evolved into a historic event, with GameStop's stock price soaring from around $20 in early January 2021 to a mid-day high of $483 by the end of the month. This short squeeze event resulted in billions of dollars in losses for institutional investors caught in short positions.
2. API and Liquidations
In the Crypto space, there have been many notable liquidation events throughout history. However, the most memorable and impactful are often the "long squeezes" that occur during downtrends. These events are larger in scale and have more far-reaching consequences for traders and the market.
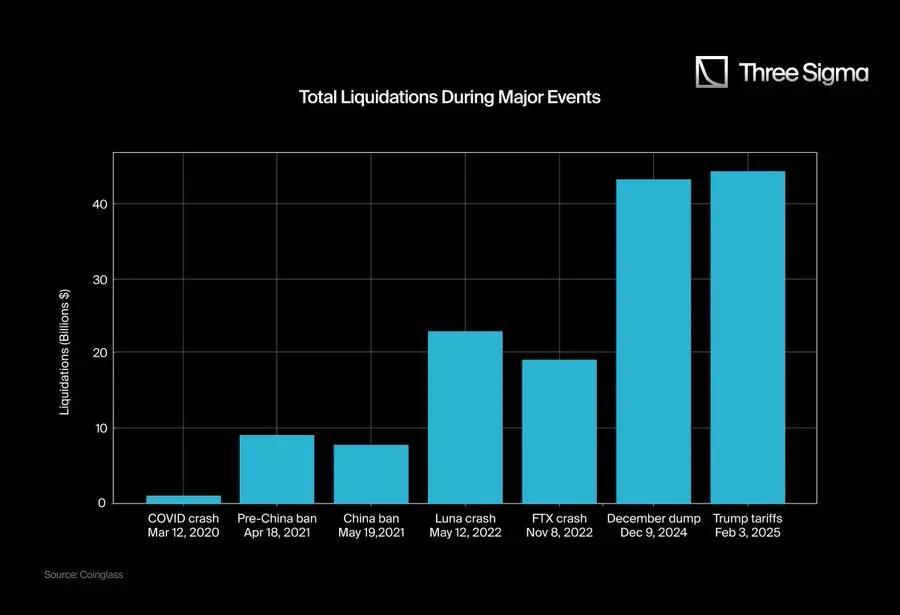
Here are some of the largest Crypto liquidation events in history:
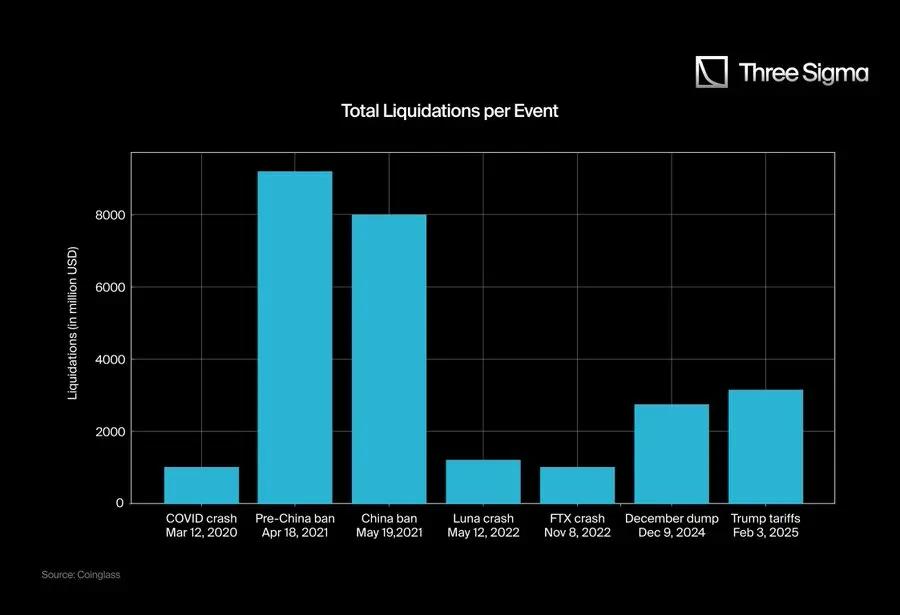
Do you notice anything unusual, anonymous? Do you feel that the FTX collapse or the Luna crash caused more damage than the liquidation events we've seen this year? Well, you're right.
Behind the recent liquidation events being more severe than FTX or Luna, there are three key factors:
Total Market Cap
In March 2020, the entire market cap reached $266 Billion, while by 2025, the peak market cap had reached $3.71 Trillion. To truly understand the scale of these liquidation events, we should consider the ratio of liquidations to market cap, rather than just looking at the absolute numbers. The raw numbers may make the recent liquidations appear more severe than they actually are.
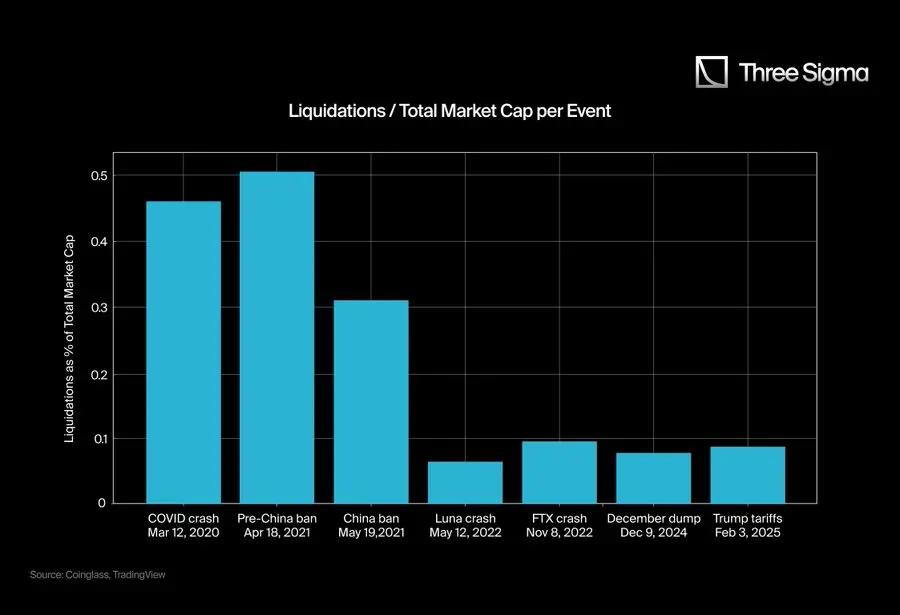
This chart gives us a clearer picture of the scale and impact of the liquidations, but there is still some data that is not entirely accurate; this is where the second issue comes in.
CEX WebSocket
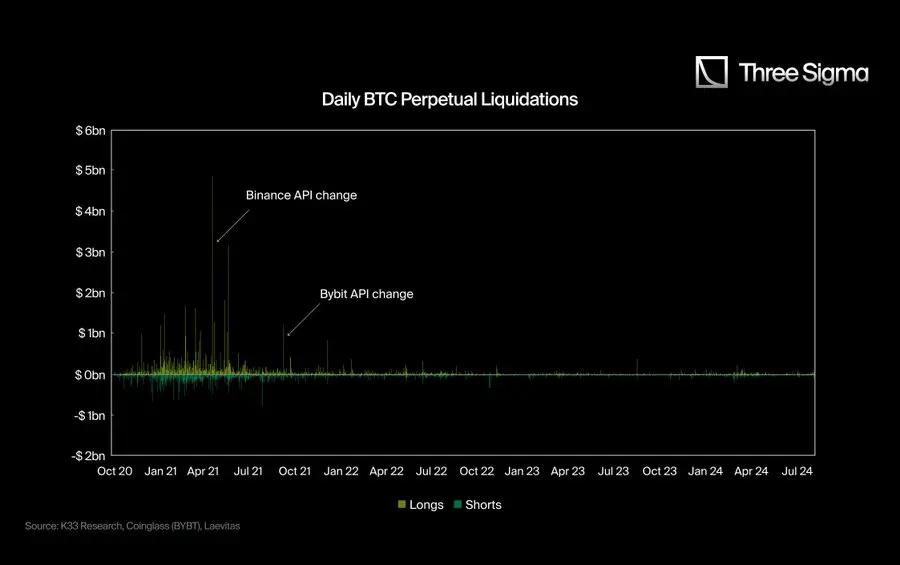
Until the second quarter of 2021, most CEXs provided accurate liquidation data through their APIs, reporting each individual liquidation. However, starting in 2021, they introduced restrictions, limiting the liquidation data to one liquidation per second, regardless of how many actually occurred.
This change significantly reduced the reported liquidation numbers, making the data from late 2021 onwards appear smaller and less impactful, even as the total market cap far exceeded 2021 levels.
@K33Research wrote a research article explaining this situation and illustrating it with two simple but powerful charts:
In the first chart, you can see that after the API change, the liquidation count clearly slowed down, even as the total market cap far surpassed 2021 levels, the liquidation data remained at a relatively low level.
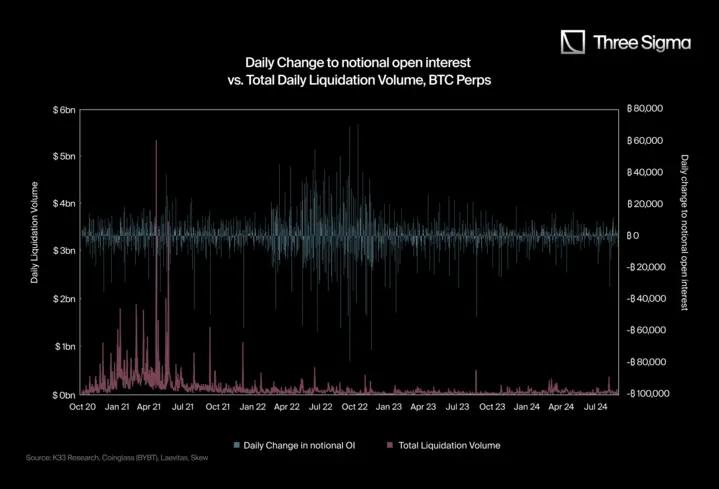
In the second chart, the author compared the total liquidation volume to the changes in daily Nominal Open Interest (OI).
Here is the English translation of the text, with the specified terms preserved:The massive intraday volatility of the notional open interest contracts usually triggers a large number of liquidations, but as we can see in the charts, after the second quarter of 2021, on days with such large OI fluctuations, there has not been a significant increase in liquidations.
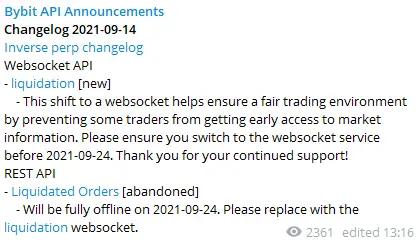
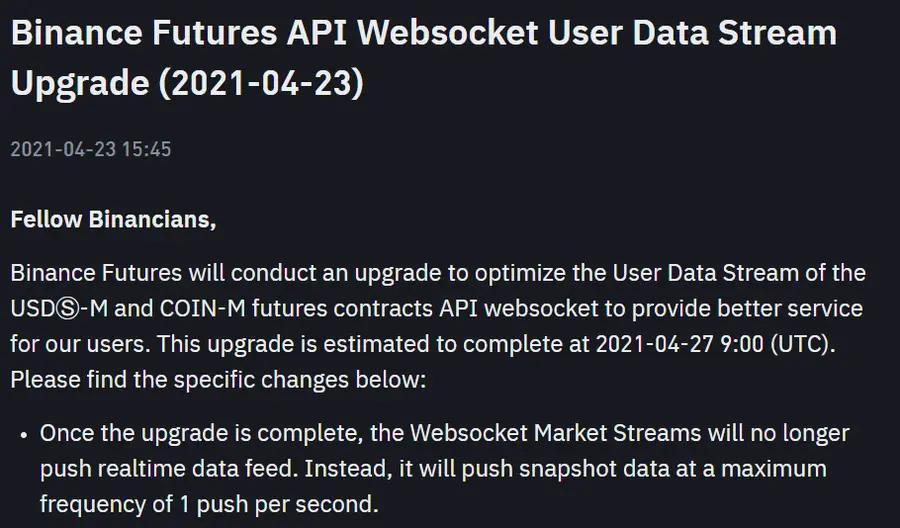
The official reasons behind these API changes are: "to provide a 'fair trading environment'" (Bybit, September 2021) and "to optimize user data flow" (Binance, April 2021), but some believe this is just for public relations purposes, to avoid causing excessive panic, and also to retain their own real data.
Hyperliquid as a Real Platform
Hyperliquid is the first Layer 1 Blockchain Perpetual DEX to achieve sufficient trading volume to compete with CEXs. Unlike CEXs, Hyperliquid provides fully transparent and uncensored reporting of all liquidation events, as its data is public.
This creates a unique environment where CEX liquidation data is restricted (due to reporting limitations), while Hyperliquid's data is uncensored. As a result, the reported total liquidation data is significantly increased, thanks to Hyperliquid's transparency.
This transparency has a significant impact on the broader trading ecosystem, as in traditional centralized exchanges, liquidation data is often selectively reported or aggregated, limiting traders' ability to analyze market dynamics in real-time. Hyperliquid ensures that every liquidation event is publicly visible, providing a more accurate and comprehensive understanding of leveraged trading activity.
For traders, this means better insights into market conditions, allowing them to identify potential squeeze scenarios, monitor risk levels, or gauge market sentiment. Researchers and analysts also benefit from the uncensored on-chain liquidation data, which provides valuable insights into volatility patterns, risk behaviors, and market reactions to liquidations.
This unrestricted access to data fosters a fairer and more efficient trading environment, where all participants have equal access to information. By setting new standards of transparency for perpetual trading, Hyperliquid not only challenges the secrecy of CEXs but also enhances the overall reliability of liquidation data, enabling traders to operate with greater trust and richer market insights.
3. Real Liquidation Data
3.1 Calculating the Hyperliquid Ratio
Hyperliquid's transparency and extensive metrics allow us to see what has been happening over a long period, whereas the derivatives segment of CEXs, due to API limitations, has not been able to report numbers that align with reality. The data discrepancies seen in the charts further confirm this issue, as despite CEXs having much larger open interest contracts and trading volume than Hyperliquid, their reported liquidation figures remain unrealistically low.
Thanks to Hyperliquid, we now have a verifiable and accurate dataset to compare the distortion in CEX liquidation reporting.
The data provided to the media often presents an incomplete picture, as it is based on limited APIs and fails to capture the full extent of liquidations. In contrast, Hyperliquid's uncensored reporting provides a transparent and detailed record of all liquidation events, demonstrating that CEX liquidation activity may be far higher than publicly disclosed.
3.2 Adjusting CEX Liquidation Data Using Hyperliquid Ratios
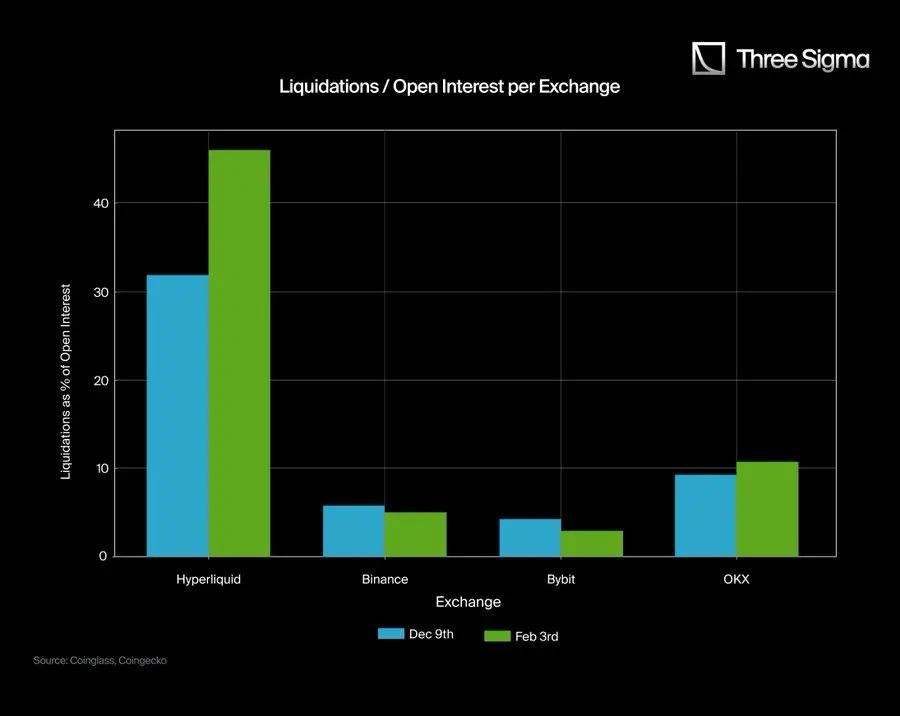
To estimate the "true" liquidation figures for CEXs, we use the Hyperliquid liquidation/trading volume ratio and liquidation/open interest contract ratio as benchmarks. We then compare these ratios to the data reported by CEXs on two specific dates (December 9 and February 3) to derive an adjustment factor.
Calculating the Average Hyperliquid Ratios:
Liquidations / Open Interest (Hyperliquid)
December 9: 1.07B / 3.37B ≈ 0.3175
February 3: 1.42B / 3.08B ≈ 0.461
Average ≈ 0.389 (38.9%)
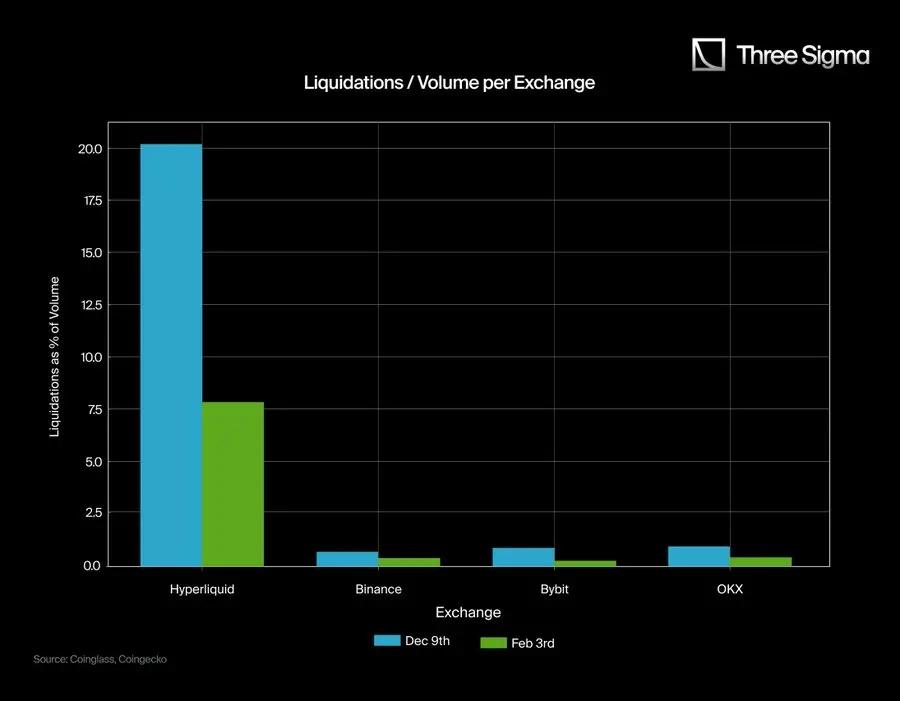
Liquidations / Trading Volume (Hyperliquid)
December 9: 1.07B / 5.30B ≈ 0.2021
February 3: 1.42B / 18.0B ≈ 0.0789
Average ≈ 0.14 (14%)
We use these figures (38.9% and 14%) as reference points to assess what the liquidation data might look like if other exchanges followed similar ratios to Hyperliquid.
Applying these Ratios to Binance, Bybit, and OKX:
For each CEX, we calculate two "adjusted" liquidation figures:
Using the Hyperliquid liquidation/trading volume ratio
Using the Hyperliquid liquidation/open interest contract ratio
We then take the average of these two adjusted results for each date.
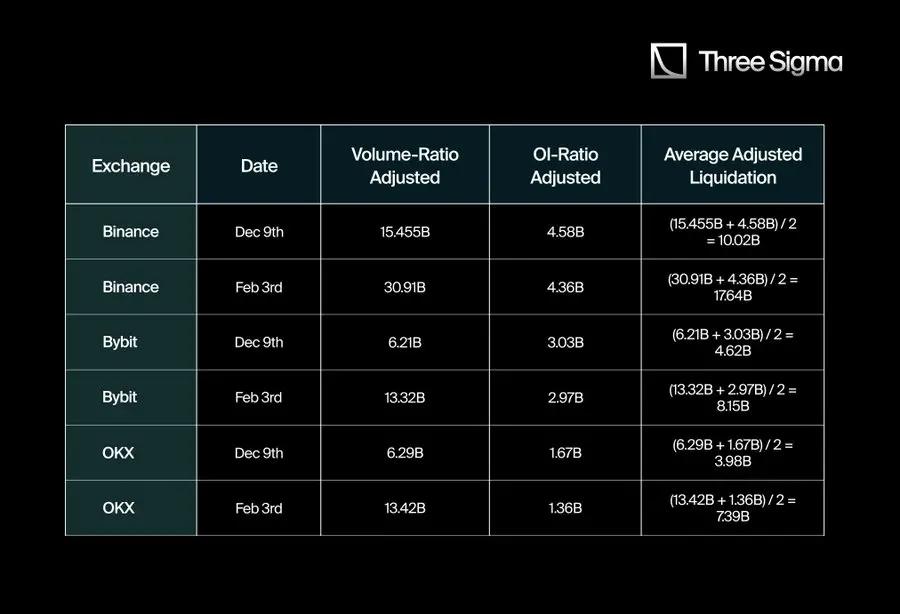
Therefore, the liquidation figures reported by CEXs (typically in the hundreds of millions of dollars) are far lower than the billions of dollars range implied by the Hyperliquid ratios.
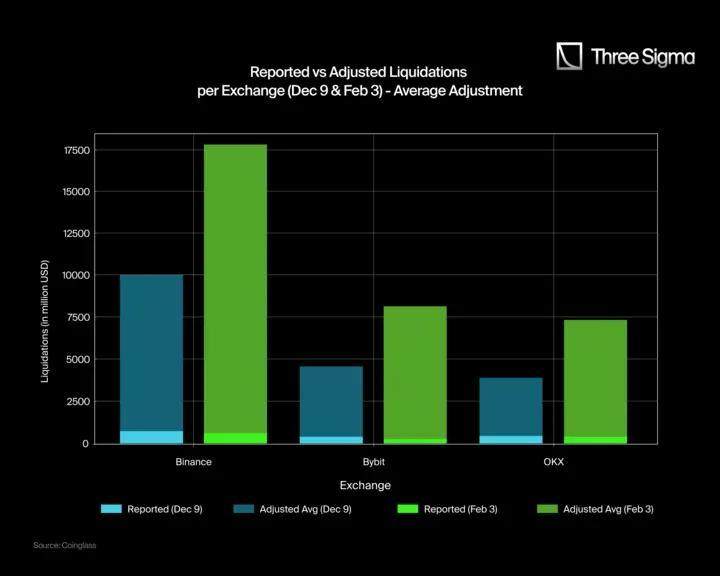
Here are the reported and adjusted liquidation data charts for December 9 and February 3. Each exchange has two bar charts, with light blue and light green representing the reported liquidation data, and dark blue and dark green representing the adjusted liquidation data.
The adjusted values are calculated using the average of the Hyperliquid liquidation/trading volume ratio and liquidation/open interest contract ratio as a benchmark. While this provides a clearer perspective on the potential liquidation data discrepancies, there may still be some variations due to differences in market structure, retail participation, and market-making activities across different exchanges.
Key Takeaways:
Binance, Bybit, and OKX are severely underreporting their liquidation data: The reported liquidation figures (light blue/light green) are far lower than the adjusted data (dark blue/dark green), suggesting that the actual liquidation figures may be much higher than publicly disclosed.
Binance should report around 17,640M in liquidations: The adjusted data suggests that Binance's true liquidation figure on February 3 should be around 17,640M, not the reported 611M, highlighting a massive discrepancy. On December 9, Binance should have reported 10,020M, not 739M.
Bybit and OKX follow a similar pattern: Bybit's adjusted liquidation figure on February 3 is 8,150M, not the reported 247M; on December 9, it is 4,620M, not 370M. OKX also shows significant differences, with adjusted liquidation figures of 7,390M on February 3 and 3,980M on December 9, compared to their reported 402M and 425M, respectively.
3.3 Major Liquidation Events and Their "True" Estimates
After comparing Hyperliquid's liquidation data with the limited data reported by major CEXs, we have found significant discrepancies. To quantify this difference, we collected the reported data from Binance, Bybit, and OKX on December 9 and February 3, specifically analyzing their liquidation/trading volume and liquidation/open interest contract ratios.
To estimate the true liquidation figures, we calculated the average liquidation/trading volume ratio for Hyperliquid and applied these ratios to the CEX data. We did not use a simple arithmetic average, but instead weighted the ratios based on the proportion of trading volume for each exchange on each date. This approach provides a more accurate reflection of the overall market liquidation activity.
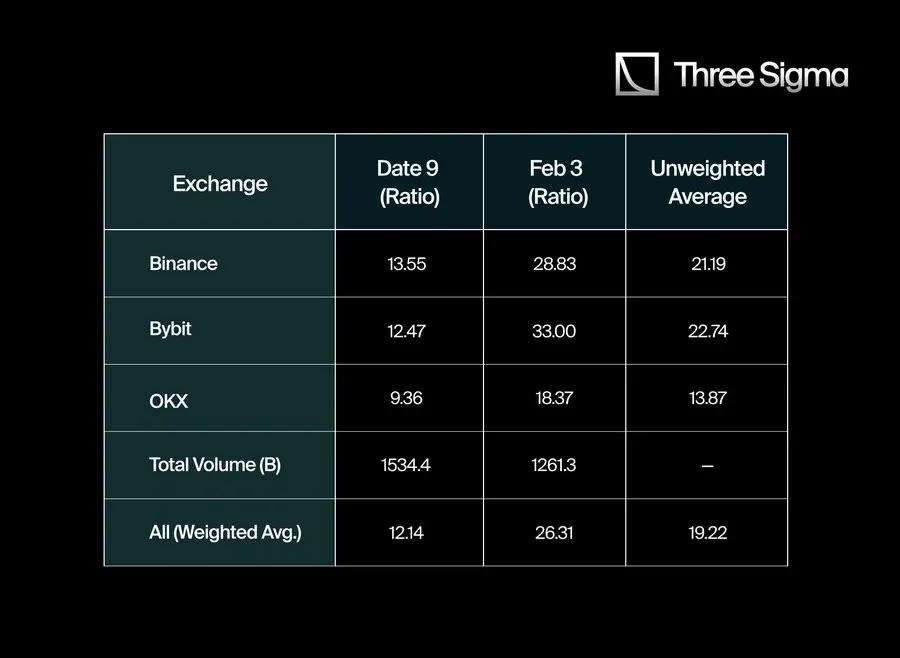
When we first calculated the adjustment multipliers for each exchange (Binance: 21.19, Bybit: 22.74, OKX: 13.87), the simple average global adjustment multiplier was 19.27. However, considering the weighted differences in trading volume across exchanges, the more accurate weighted average is 19.22.
This suggests that the true liquidation data for CEXs may be around 19 times higher than the official reports, or at least 19 times higher than the data publicly available through their restrictive APIs.
Here is the English translation:With this 19.22x adjustment factor, we analyzed some of the major liquidation events in crypto history to estimate what their true liquidation data might have been if they had the same transparency as Hyperliquid. The table below compares the commonly reported liquidation amounts with the values adjusted using the 19.22x factor:
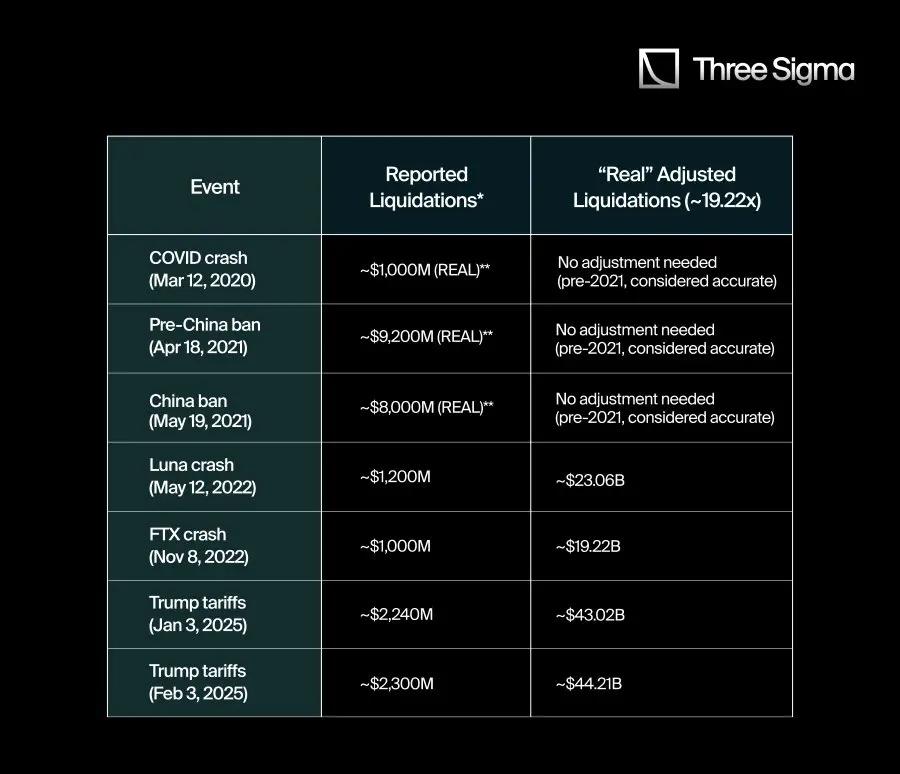
"Reported" refers to the numbers published on aggregators, social media, or limited APIs.
For events prior to Q2 2021, the liquidation data is much more reliable as there were no API restrictions.
As the image emphasizes, many of the liquidation figures reported from CEX data sources after 2021 may greatly underestimate the actual situation. By applying the multiplier derived from Hyperliquid's full transparency, the scale of these events' liquidations is much larger than the official numbers suggest.
3.4. Comparing Liquidations to Total Market Cap
To provide more context, we compared the total "true" liquidations of these events to the total market cap at the time. The ratio calculation formula is: (Liquidation Amount/Market Cap) x 100.
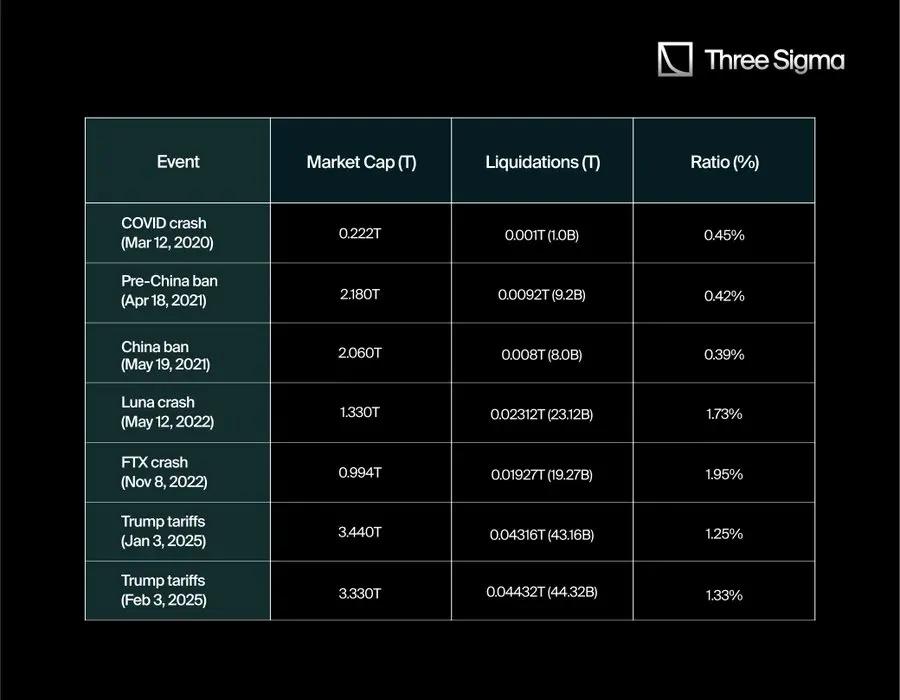
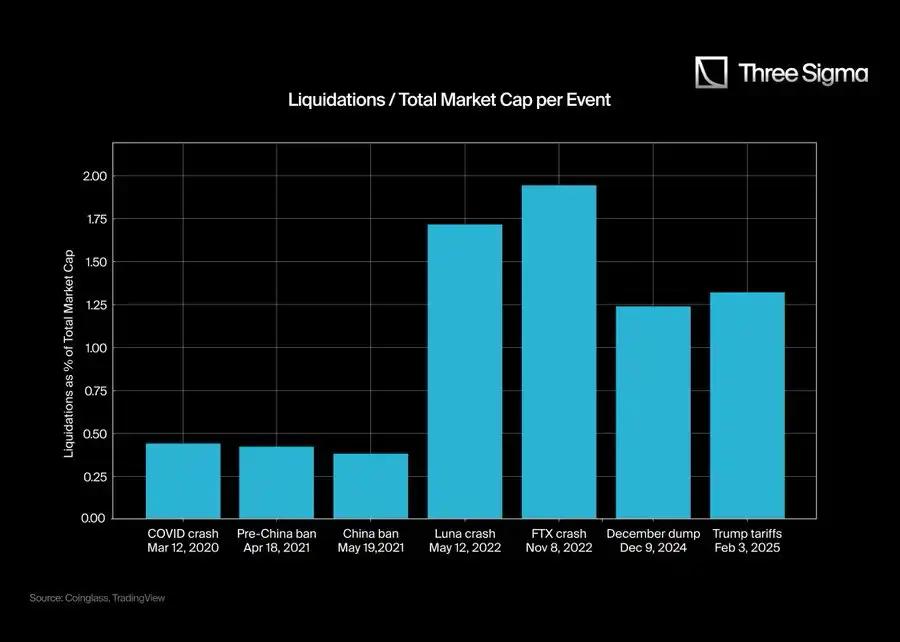
By comparing the "true" liquidation data to the broader Bit currency market cap, we can gain a more granular understanding of each event's impact on market dynamics. This not only shows the scale of capital that vanished in a short time, but also reflects how market sentiment can shift violently when leverage is unwound.
In many cases, the ratios become more significant after adjustment, indicating that participants may have been exposed to larger systemic risks than initially appeared. Therefore, understanding these liquidation-to-market cap ratios can provide a clearer perspective to help us comprehend the changes in market psychology and liquidity conditions during periods of extreme volatility.
4. Conclusion
From all the data and comparisons above, a clear pattern emerges: the figures publicly reported by CEXes are often far lower than the "true" liquidation activity. When adjusted to match Hyperliquid's transparent ratios, events like the Luna and FTX collapses reveal larger impacts than the official data suggests, further reinforcing the view that CEXes may underreport liquidations to obscure volatility or manage public perception.
This contrast is particularly evident when considering historical events: the 2020 COVID Crash, while a major market event at the time, now appears relatively small, as there was less leverage participation then. As leverage has proliferated, the absolute and relative scale of liquidations has grown, but the limitations of official data streams may have distorted traders' and analysts' perceptions of systemic risk.
Moreover, exchanges often justify "optimizing data flows" or "ensuring fair trading conditions," but it is not difficult to see how restricting real-time liquidation data publication can serve broader interests. Underreporting liquidations can reduce the fear of new retail investors, while also giving exchanges exclusive insights into the overall market risk exposure.
While these measures may help narrow the gap between reported data and actual liquidation activity, Hyperliquid's fully on-chain, unconstrained reporting still highlights how crucial true transparency is for anyone seeking to navigate leveraged Bit trading.