Arbitrum (ARB) has risen more than 12% in the last 24 hours since the Robinhood listing, sparking strong speculative interest. The market capitalization has now reached $1.8 billion, with trading volume surging to $400 million over the same period.
Despite this price surge, technical indicators show that ARB is still in a downtrend. However, buyers are gradually gaining control.
ARB DMI Chart, Buyers in Control
After the Robinhood announcement, the Directional Movement Index (DMI) chart of Arbitrum has seen notable changes.
The Average Directional Index (ADX), which measures trend strength, has slightly declined from 30.6 to 28.4, reflecting a weakening of the downtrend. However, +DI has surged from 13.5 to 29.3, while -DI has dropped from 37.3 to 25.2. This indicates that buying momentum is increasing and selling pressure is decreasing.
Despite these improvements, ARB is still in a downtrend. However, the recent changes in the Directional Movement suggest a potential trend reversal if the bullish momentum continues to build.
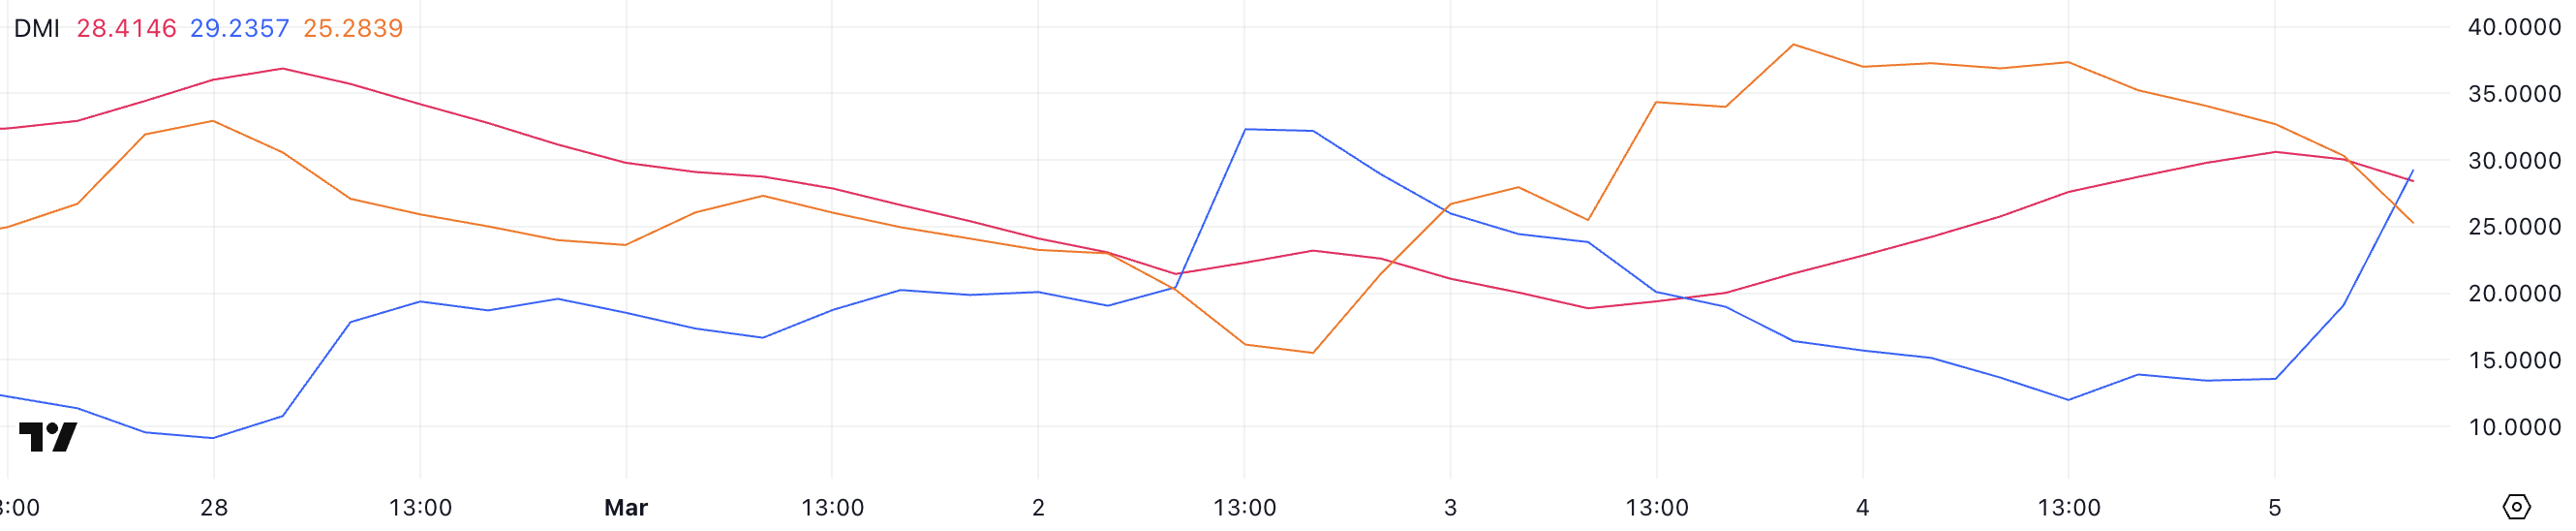
The Average Directional Index (ADX) is a technical indicator that measures the strength of a trend, regardless of direction. Values above 25 indicate a strong trend, while values below 20 suggest a weak or uncertain market condition.
With the current ADX at 28.4, the trend of ARB is well-defined, but the downtrend is weakening.
The rising +DI and falling -DI indicate that buyers are starting to take control. However, further confirmation is needed for ARB to fully establish a bullish reversal. If +DI continues to rise and crosses above -DI, ARB could establish a strong bullish trend.
Arbitrum Daily Active Addresses Continuing to Decline
Despite the recent price surge of Arbitrum following the Robinhood listing, the 7-day active addresses on the Arbitrum chain have been steadily declining since December.
This metric currently stands at around 36,400, a significant drop from the 110,000 active addresses recorded on December 7th, when ARB was trading around $1.23.
While the Robinhood listing has sparked short-term speculative interest, the long-term sustainability of ARB's price increase may be challenged if on-chain participation continues to weaken.

Tracking active addresses is important as it reflects actual user engagement and adoption of the blockchain network. Increasing active addresses generally indicates higher demand for network services and stronger community participation.
However, the decline in Arbitrum's activity raises concerns about whether the recent price surge is driven by genuine adoption or simply market speculation following the Robinhood listing.
If this trend persists, it may suggest that interest in network usage is waning, despite the price increase, which could ultimately impact ARB's long-term value.
Arbitrum (ARB) Coin Price Prediction for March
Arbitrum's moving averages (EMAs) indicate that the coin is still in a downtrend, with the short-term moving average below the long-term moving average.
However, the recent price surge following the Robinhood listing has started to push the short-term moving average into an upward trajectory.
If this momentum continues, Arbitrum's price could test the $0.438 resistance level. A breakout above this level could pave the way for moves towards $0.466 and potentially even $0.51.
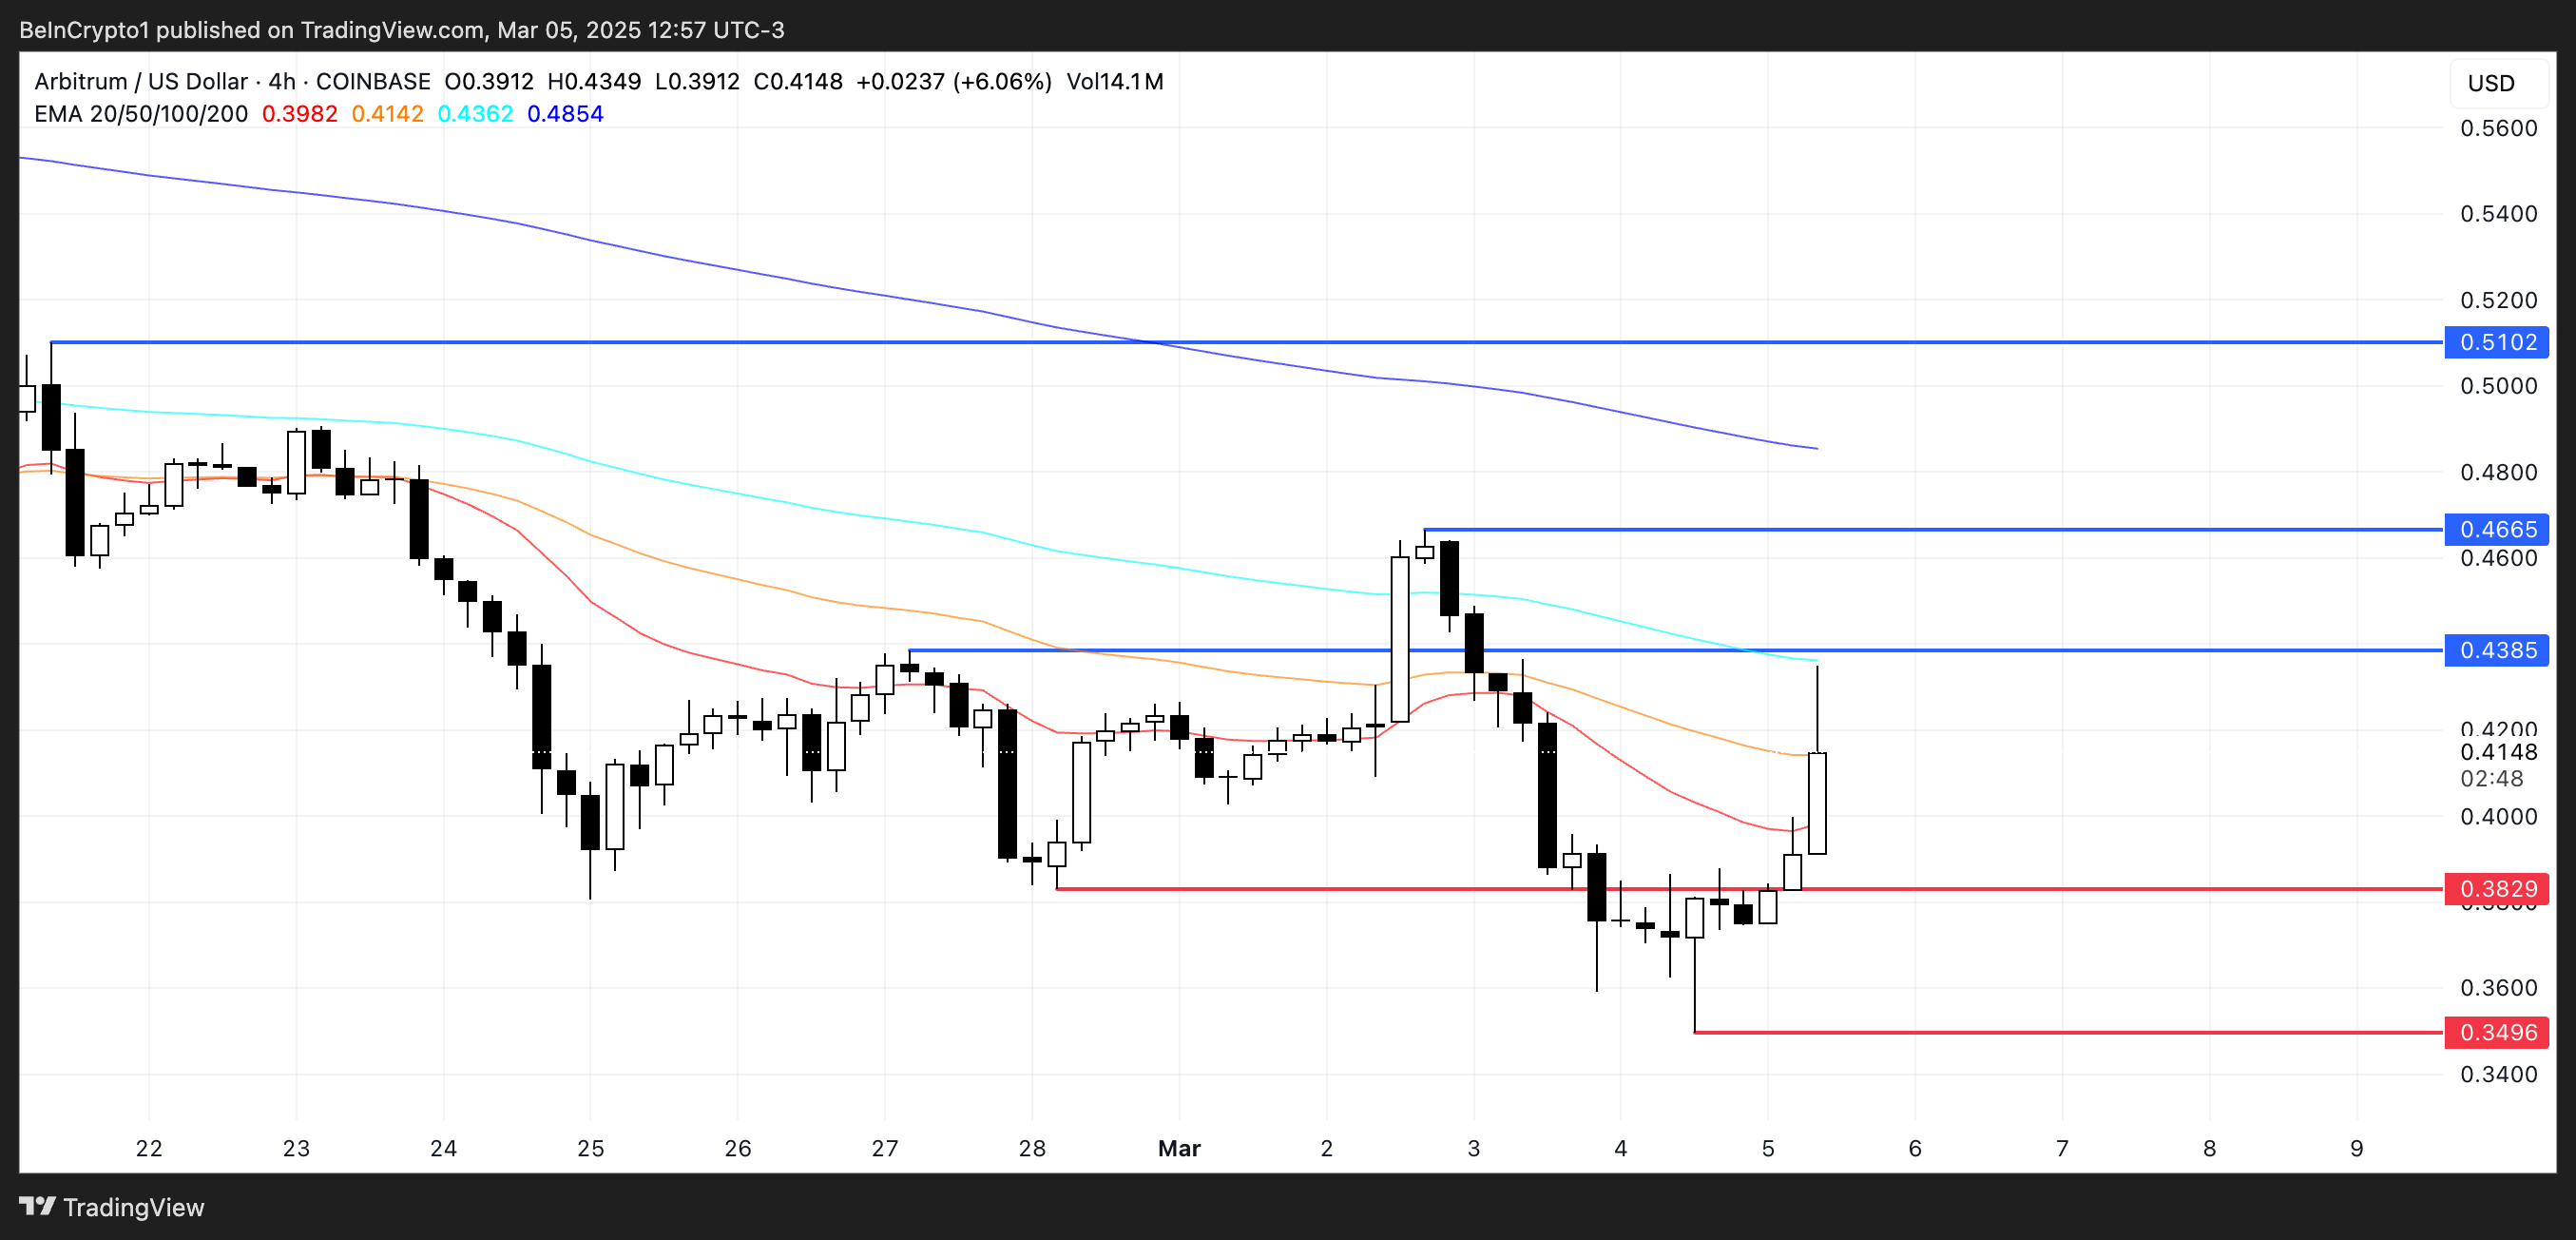
The key for ARB is whether the buying pressure is strong enough to sustain this upward momentum, potentially reversing the previous downtrend structure.
On the other hand, if Arbitrum (ARB) fails to maintain its bullish trajectory, the downtrend could resume, leading to a retest of the $0.38 support level.
A breakdown below this zone would signal a return to weakness, with the possibility of the price dropping as low as $0.349. Losing this level would mark the first time ARB falls below $0.35, further strengthening the bearish sentiment.