XRP is experiencing strong selling pressure, declining by more than 5% in the past 24 hours and over 12% in the past 7 days. The recent downtrend has appeared alongside increasingly weak technical indicators, including a sharp increase in trend strength and a collapse in on-chain activity.
As price momentum weakens and user engagement decreases, concerns are growing about whether XRP can maintain its key support levels. Unless sentiment quickly reverses, the path of least resistance appears to remain downward.
DMI Chart Shows Current Downtrend is Strong
XRP's Directional Movement Index (DMI) is currently sending a strong bearish signal, with the Average Directional Index (ADX) surging from 25.43 to 47.14 the day before.
The ADX measures trend strength regardless of direction, and values above 25 typically indicate that a trend is gaining momentum.
A reading above 40 suggests a very strong trend is in progress. With XRP currently in a downtrend, this rising ADX indicates that bearish momentum is intensifying and the market is heavily tilting towards further decline.
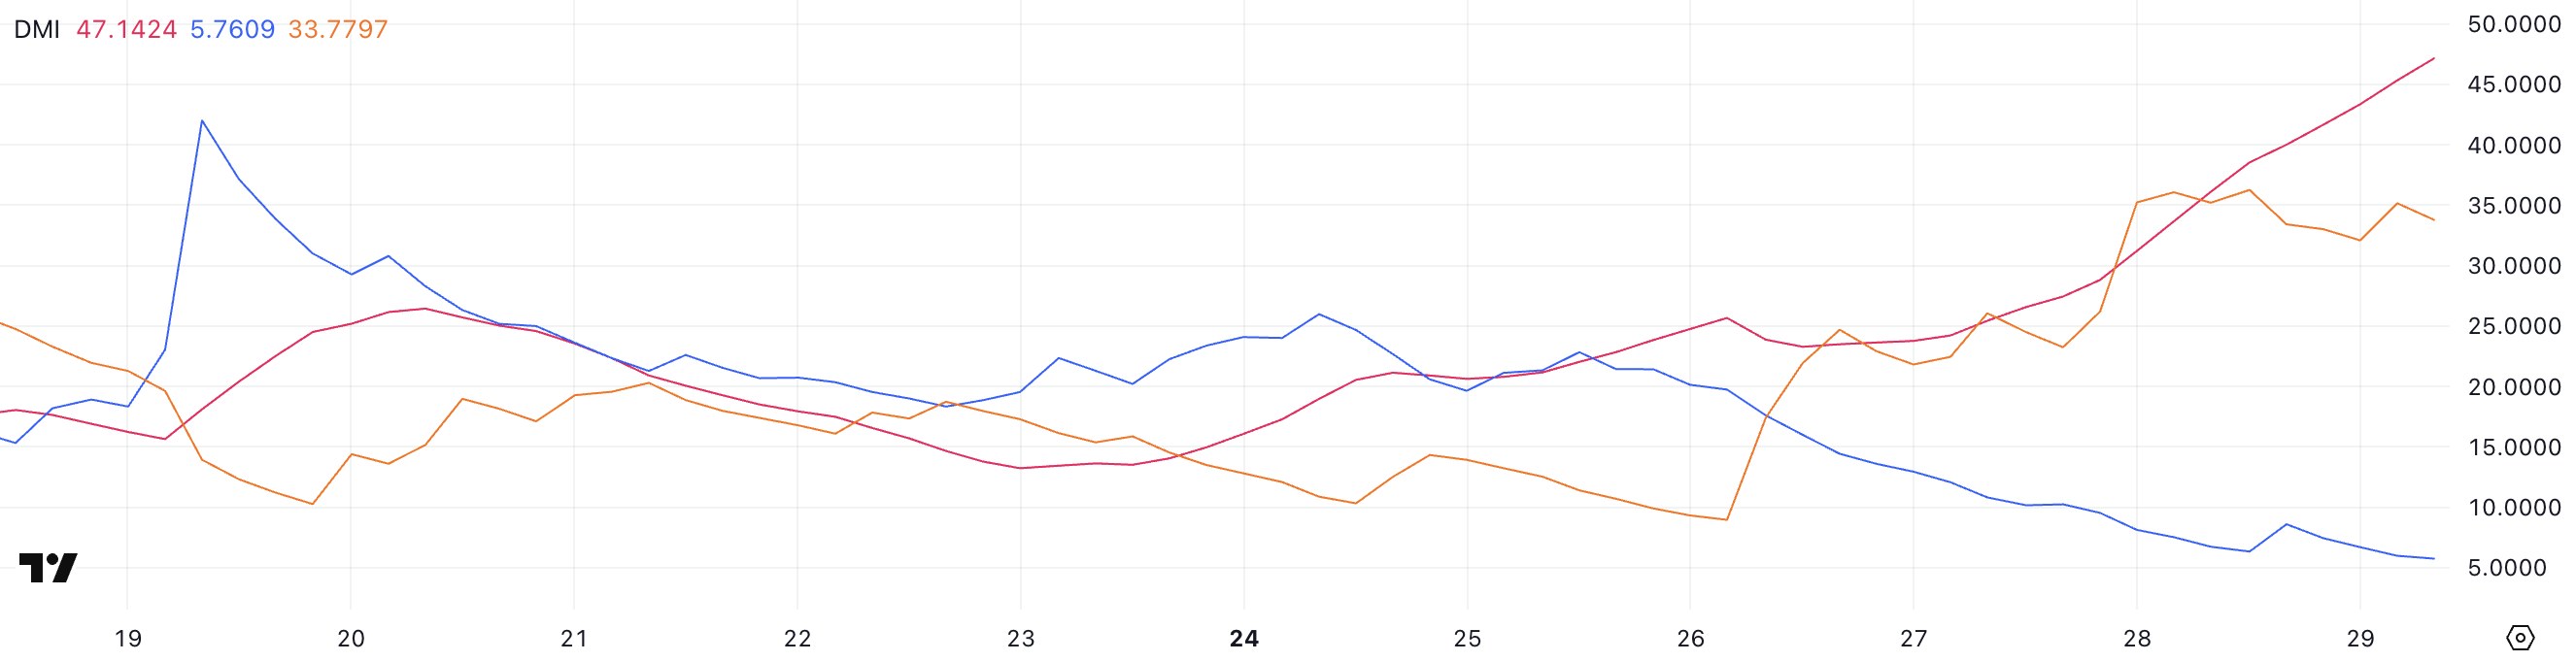
Diving deeper into the DMI components, the +DI tracking upward price pressure has plummeted from 20.13 to 5.76. Meanwhile, the -DI tracking downward price pressure has surged from 8.97 to 33.77.
This stark difference reinforces the bearish trend, indicating that sellers are aggressively taking control while buyer strength weakens.
With the ADX confirming the movement's intensity and directional indicators heavily skewed downward, XRP's price may face pressure in the short term unless sentiment significantly reverses.
XRP Active Addresses Dramatically Decrease
XRP's 7-day active addresses sharply declined last week after recently spiking to an all-time high. On March 19, the indicator reached 1.22 million, signaling strong network activity and user engagement.
However, it subsequently plummeted to 331,000, representing a decline of over 70%. This sudden drop suggests that interest in XRP trading has cooled significantly in a short time.
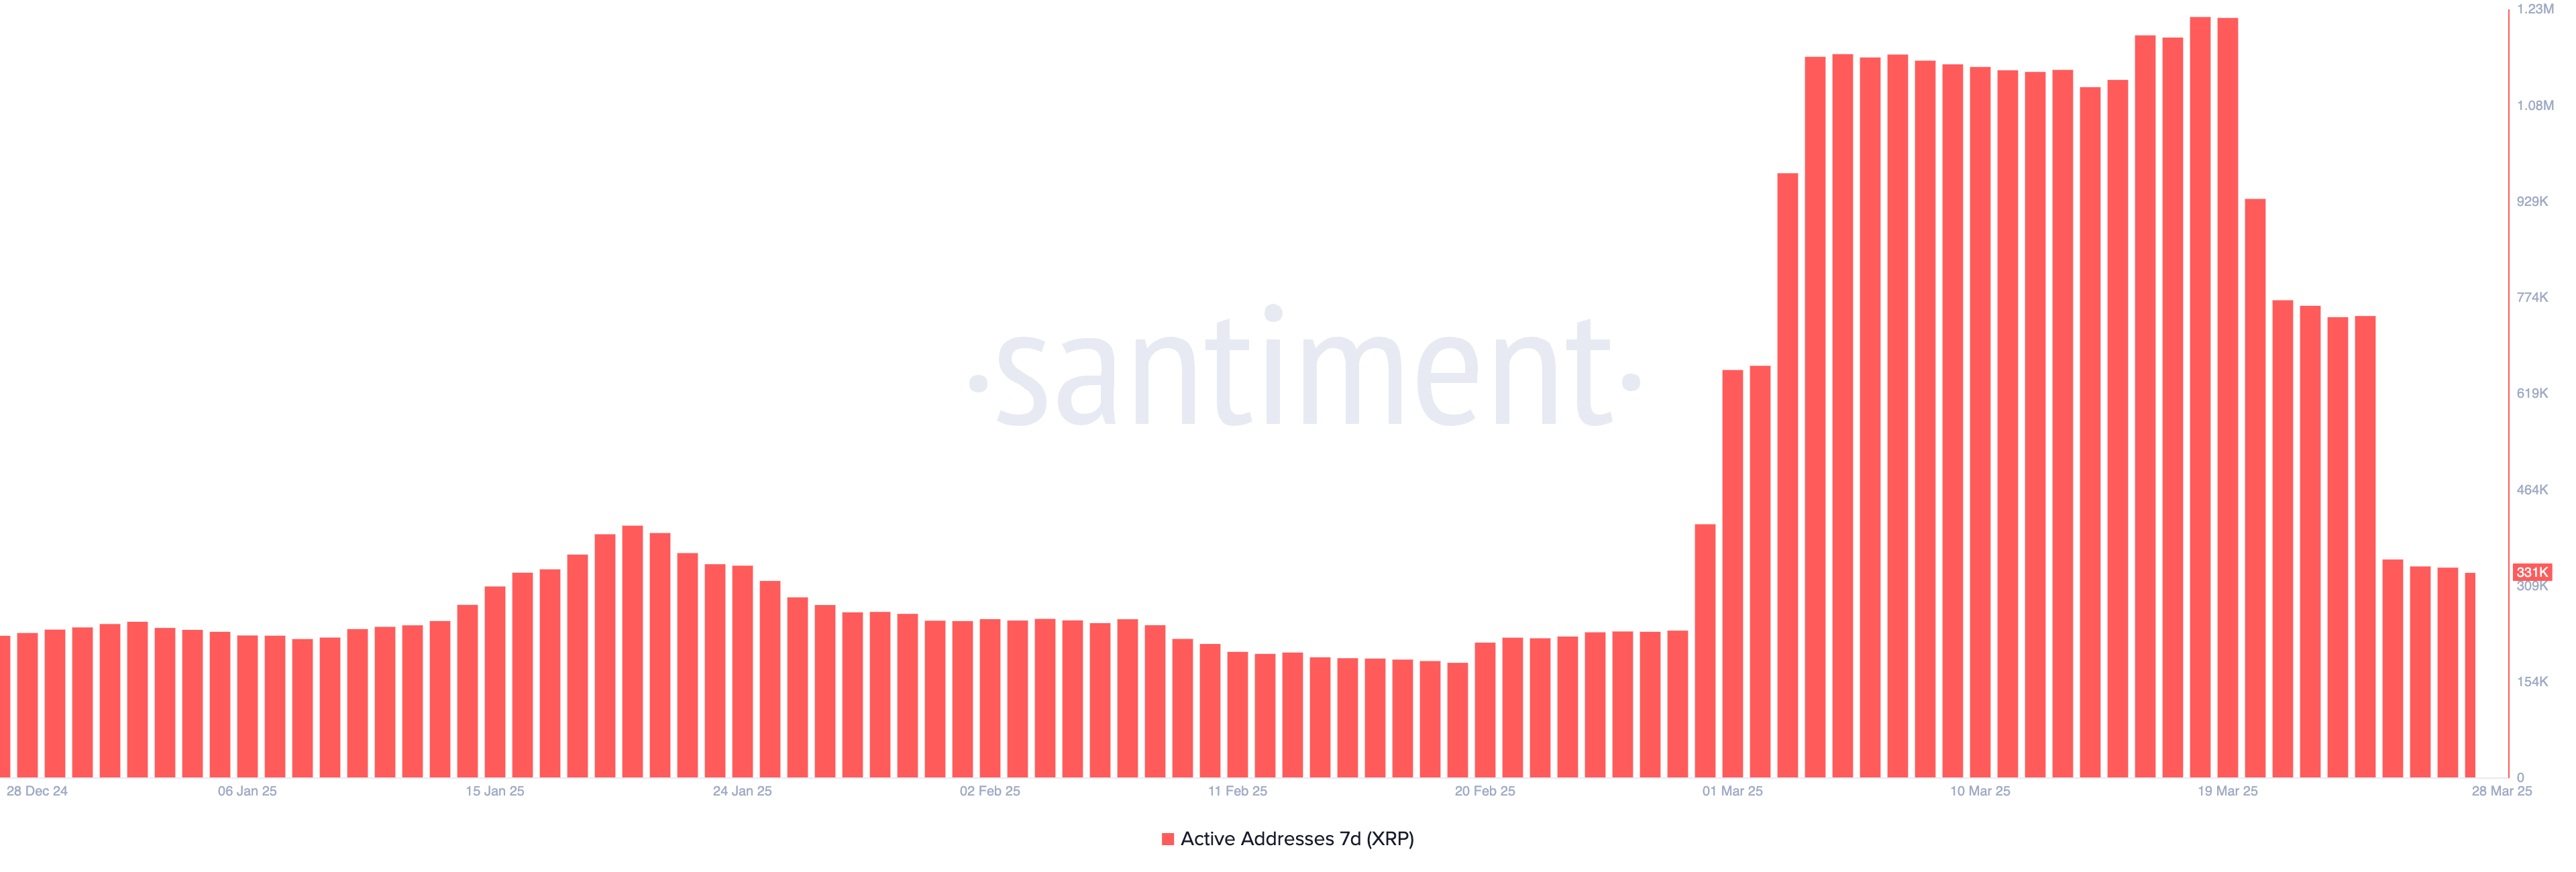
Tracking active addresses is a key method for assessing on-chain activity and overall network health. An increase in active addresses typically reflects growing user participation, demand, and potential investor interest, which can support price strength.
Conversely, a sharp decrease like XRP is currently experiencing can indicate momentum weakening and reduced interest, which may exert additional price pressure.
Unless user activity rebounds, the decline in network participation could continue to burden XRP's short-term outlook.
XRP Could Soon Drop Below $2
XRP's Exponential Moving Average (EMA) lines are currently signaling a strong downtrend, showing a typical bearish alignment with short-term EMA positioned below long-term EMA.
This setup indicates that recent price momentum is weaker than the long-term average, which is often observed during sustained corrections. If this downtrend continues, XRP may retest the $1.90 support level.
Falling below that could lead to an even deeper decline to $1.77 in April.

However, if market sentiment shifts and XRP price changes direction, the first major level to watch would be the $2.22 resistance.
Successfully breaking through this point could trigger new bullish momentum, potentially driving the price up to $2.47.
If that level is also breached, XRP could advance further to test the $2.59 mark.