

As the broader cryptocurrency market begins to recover from recent lows, on-chain data reveals an increasing behavioral divergence between long-term and short-term Bitcoin holders.
Long-term holders (LTHs) have started net accumulation for the first time since the recent local peak, while short-term holders (STHs) appear to be leaving the market.
BTC LTHs Return to Accumulation as STHs Surrender
In a recent report, CryptoQuant's anonymous analyst IT Tech noted a clear behavioral divergence between BTC's LTHs and STHs, suggesting the early formation of a re-accumulation phase.
This is based on an assessment of BTC Long-Term Holders' (LTH) Net Position Change, which the analyst says has turned positive for the first time since BTC's recent local peak.
"This indicates that experienced, confident participants are gradually returning to accumulation after several months of continuous distribution. Their activity typically reflects strategic repositioning, cycle awareness, not necessarily large capital flows," the analyst noted.
Meanwhile, BTC's STHs—those who have held BTC for under 155 days—are selling during weak prices, with net outflow remaining negative. This trend suggests surrender, as new investors reduce their coin exposure to cope with recent price troubles.
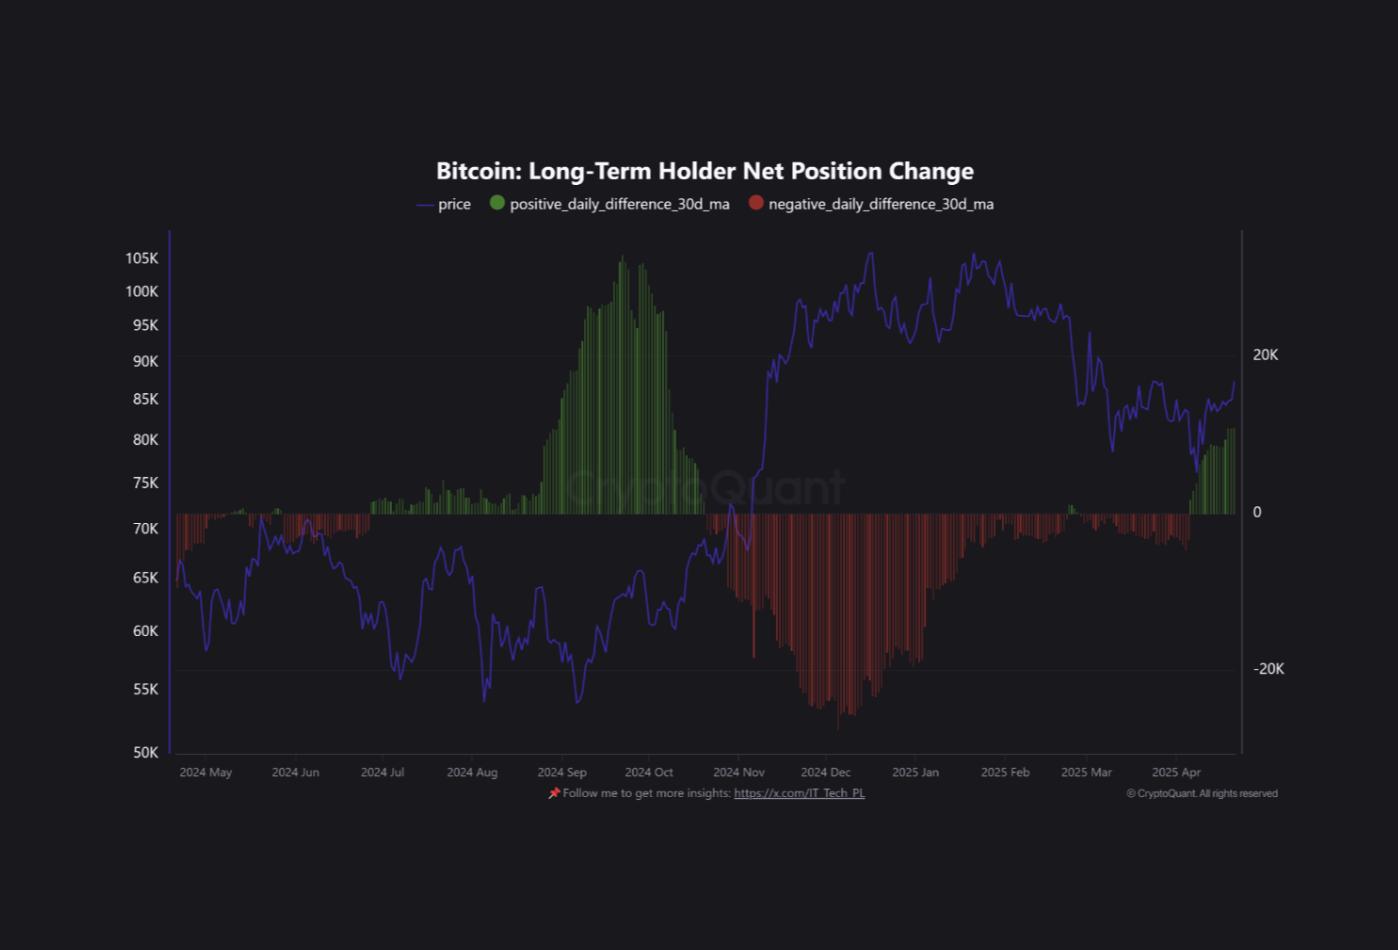 Bitcoin Long-Term Holder Net Position Change. Source: CryptoQuant
IT Tech noted that this behavioral divergence "tends to signal the early stage of a re-accumulation phase."
"Assuming long-term participants continue to increase their positions while short-term supply is eliminated. This setup could serve as a foundation for future price recovery, even if short-term price action remains volatile," the analyst said.
Bitcoin Momentum as Buying Pressure Intensifies
On the daily chart, BTC's positive Chaikin Money Flow (CMF) reflects increasing investor demand and positive cash flow momentum. This further reinforces the potential for an upward price breakout as predicted by the analyst.
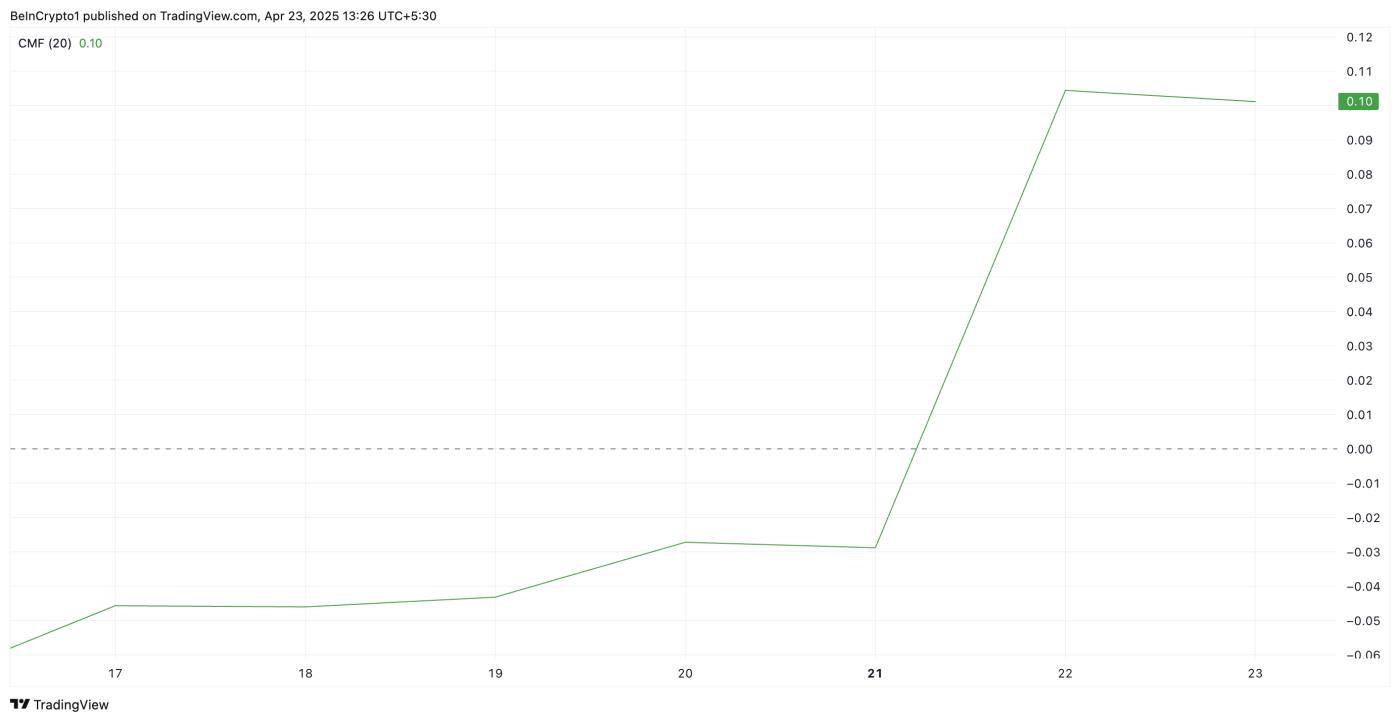 BTC CMF. Source: TradingView
At the time of writing, this momentum indicator, which measures cash inflows and outflows from an asset, is at 0.10. Such a positive CMF indicates buying pressure outweighing selling pressure among market participants and suggests a prolonged price increase for BTC.
Furthermore, the coin's Aroon Up Line is currently at 100%, reinforcing the strength of the current upward trend.
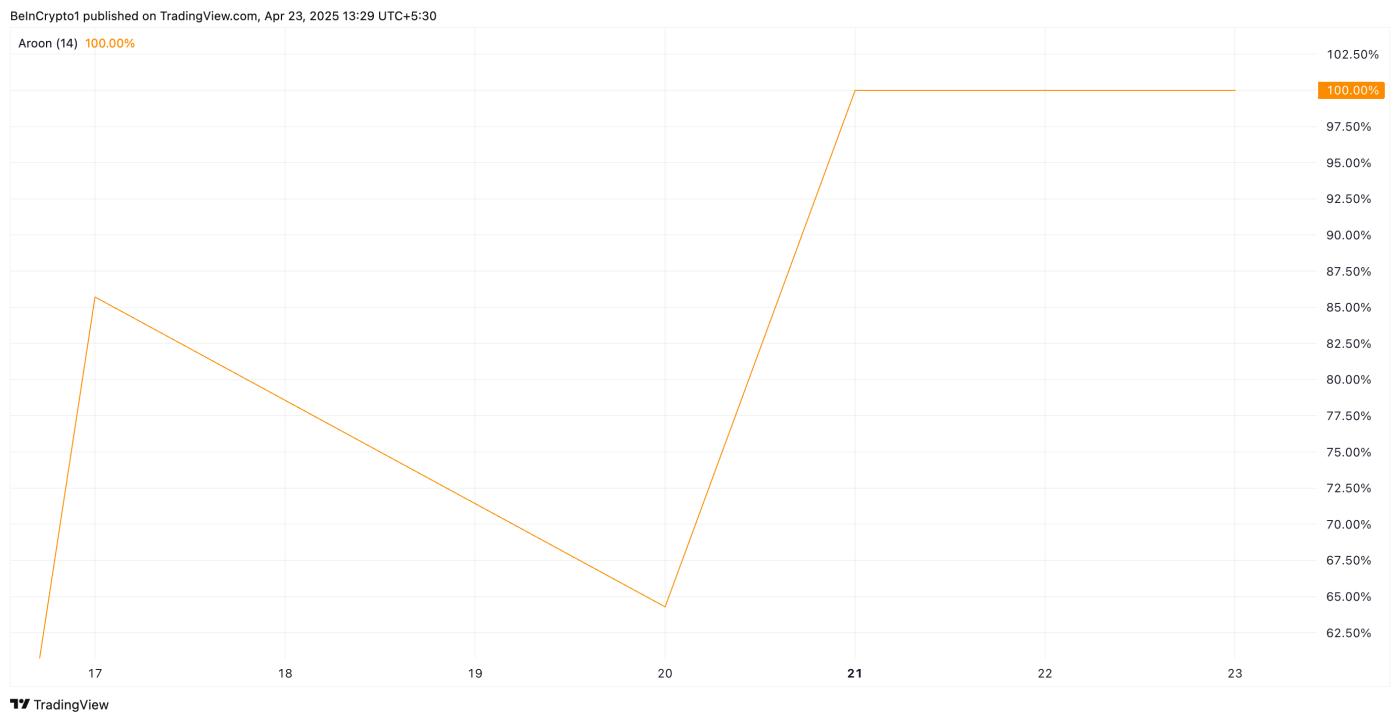 BTC Aroon Up Line. Source: TradingView
An asset's Aroon indicator measures trend strength and direction by tracking time since highest and lowest prices within a specific period. It comprises two lines: Aroon Up, measuring price increase momentum, and Aroon Down, tracking price decline pressure.
For BTC, when the Aroon Up line is at 100, it signals strong upward momentum and a prevailing price increase trend. This indicates high buying pressure, and prices may continue to rise.
BTC Investors Targeting New Highs
BTC is currently trading firmly above the critical support level formed at $91,851. If upward price pressure remains and demand intensifies, the king of currencies could continue its upward trend to trade at $95,971.
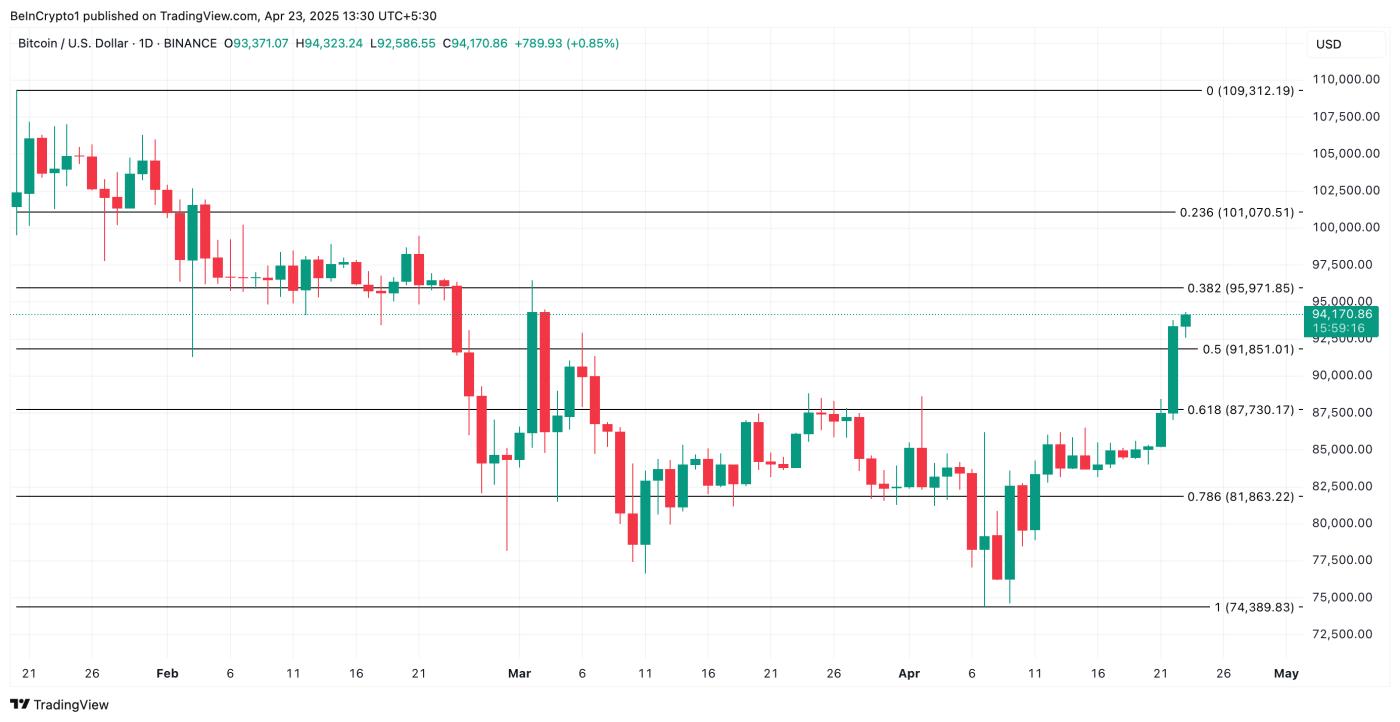 BTC Price Analysis. Source: TradingView
However, if traders continue to take profits, this price increase forecast will be invalidated. In that case, BTC price might retest support at $91,851. If unable to hold, the price could drop to $87,730.


