

TLDR
- This article will explain the basis for determining near-top conditions from an on-chain data perspective
- Historically, cycle tops have always had "2 obvious distribution stages", and currently this is the second stage
- Explaining the principle of market top formation: completion of low-cost chip distribution
- The top is expected to appear in Q1
- From a trader's perspective, explaining how to observe and dynamically adjust the trading model
I. The Underlying Principle of $BTC Market Top Formation
During each bear market phase, many participants quietly accumulate chips, commonly known as "chip absorption". As market sentiment reaches an extreme low point, trading becomes cold, and prices even drop below the average cost of long-term holders, marking the bottom.
As the bull market starts and prices surge, these chips accumulated during the bear market begin to be distributed. When distribution ends, the remaining chips on the market are held by participants who "bought at relatively high prices". Since these participants have a higher cost basis, once subsequent prices fail to continue rising or even just maintain a wide range of oscillation, their holding pressure will increase, significantly raising the likelihood of selling (compared to low-cost chips). Ultimately, once some high-price chips begin panic selling, causing price drops, it will further trigger selling of other high-cost chips, creating a chain reaction that marks the end of the bull market.
Additional note: This is more evident in the $BTC market, as in the stock market, most companies have fundamental support, with stock prices calculated by discounting future cash flows to current value.
II. Cycle Tops Always Accompany 2 Distributions
After understanding the principle of market top formation, readers can first look at the following chart:
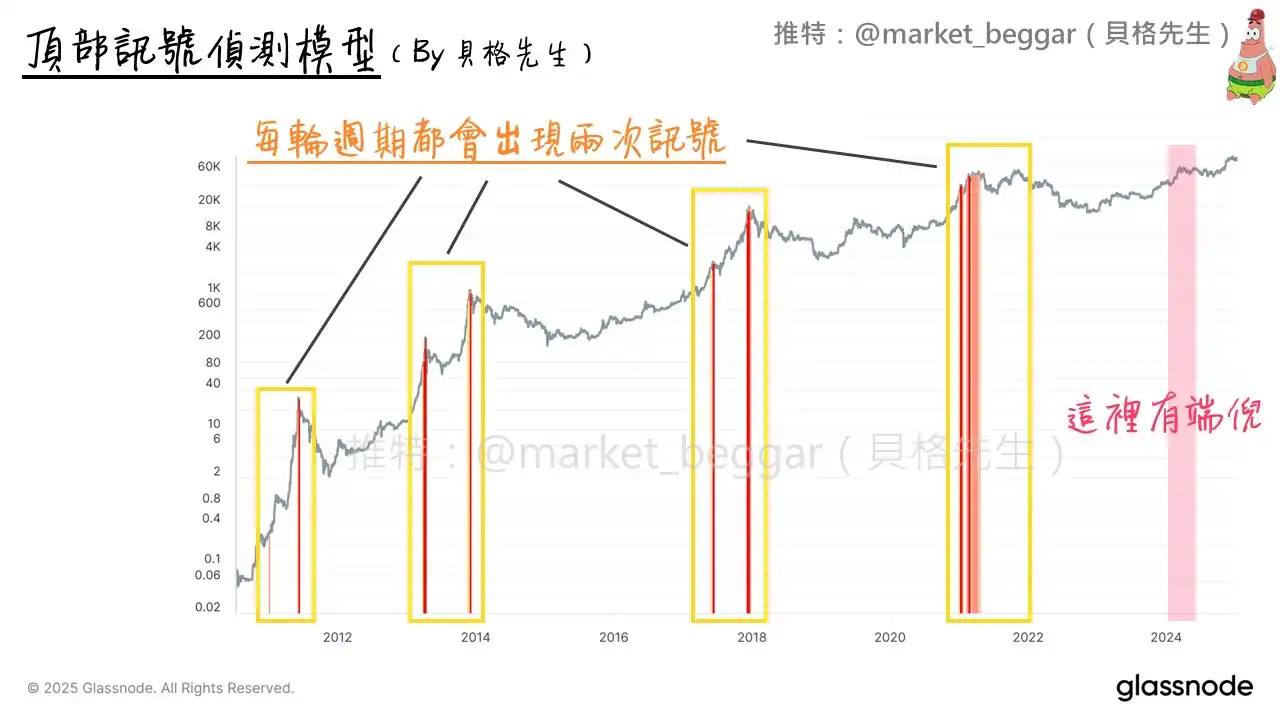
This is a top signal model designed based on on-chain data, which is included in the weekly top-escaping report. As can be seen, each historical cycle top is preceded by 2 signals.
Simply saying "because it was like this before" is certainly not sufficient.
Logically, the fundamental reason for 2 distributions is:
· The 1st distribution represents price beginning to surge, with low-cost chips starting to sell
· After the 1st distribution ends, price begins to pullback, introducing massive buy-the-dips
· Market sentiment continues to push to extreme heights, with massive buying entering, absorbing the remaining low-cost chip distribution
Due to the massive volume of low-cost chips, they typically cannot be completed in the 1st distribution, thus requiring a second distribution through the massive buying brought by bull market sentiment.
III. What Happened in This Bull Market Cycle?
Everyone can look at the top model signal chart again and should notice that this cycle hasn't actually triggered a top signal yet.
However, while designing the model and studying market dynamics, I actually discovered some "signs". I'll mark the area of discovery with a semi-transparent red mark on the right side of the chart. Next, I'll explain to readers what warning signals I've seen:
1. Realized Profit
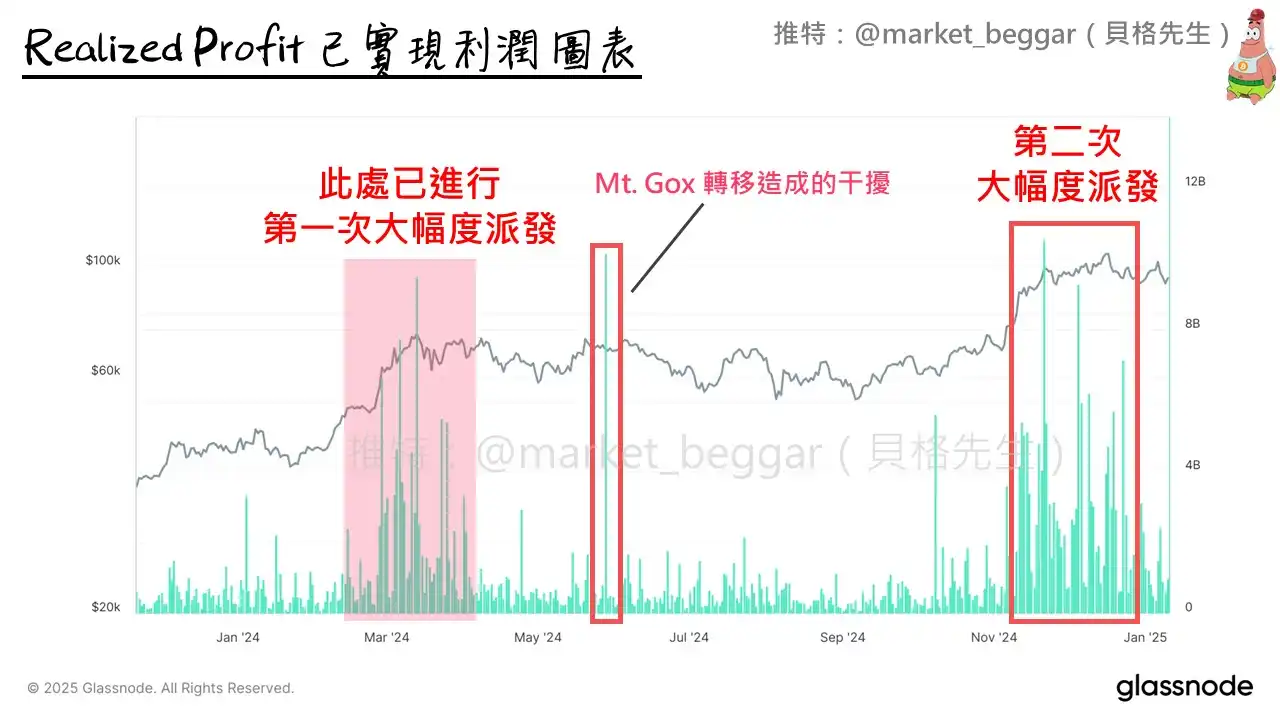
This is the Realized Profit chart, with the "suspicious area" from the first chart marked with a semi-transparent red mark.
It can be seen that in March and April 2024, when prices surged above 70k, a massive profit-taking occurred (first distribution). And in late last year, when prices broke through 100k, Realized Profit again showed massive volume (second distribution). Therefore, from the Realized Profit perspective, there have actually been 2 distributions.
2. AVIV Heatmap
The AVIV Heatmap is also content included in weekly reports, mainly to observe whether the market is currently in an "overheated" stage. AVIV value can be temporarily understood as a more precise MVRV, with detailed principle explanations to be written in a separate article in the future.
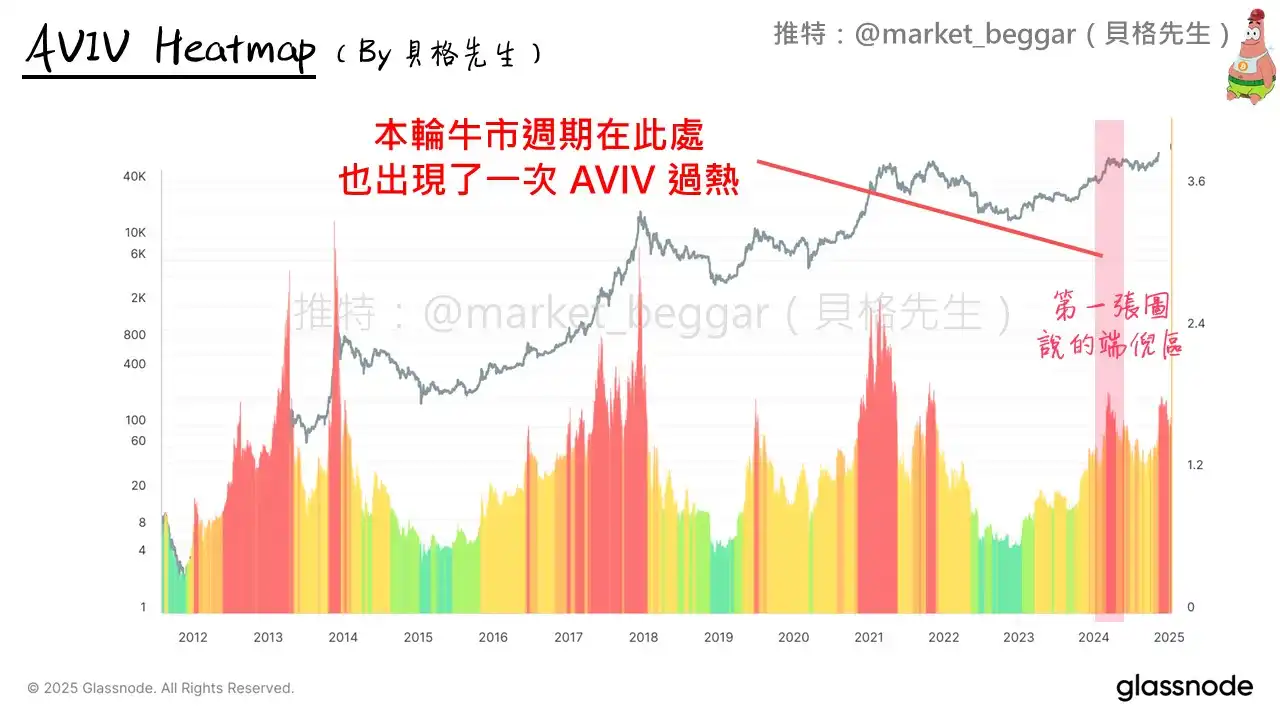
As shown in the chart, I've marked the "suspicious area", which is around March and April this year. It can be seen that there was a period of "overheating" on the AVIV Heatmap at that time, followed by about six months of wide-range oscillation that dissipated the overheated state; then when prices broke through 100k, AVIV again showed overheating.
Therefore, from the AVIV perspective, it still indicates that we are currently in the "second distribution" stage.
3. Cointime Price Deviation Top Model
I previously wrote an article on 12/27 last year explaining how I used Cointime Price to design a top screening model:
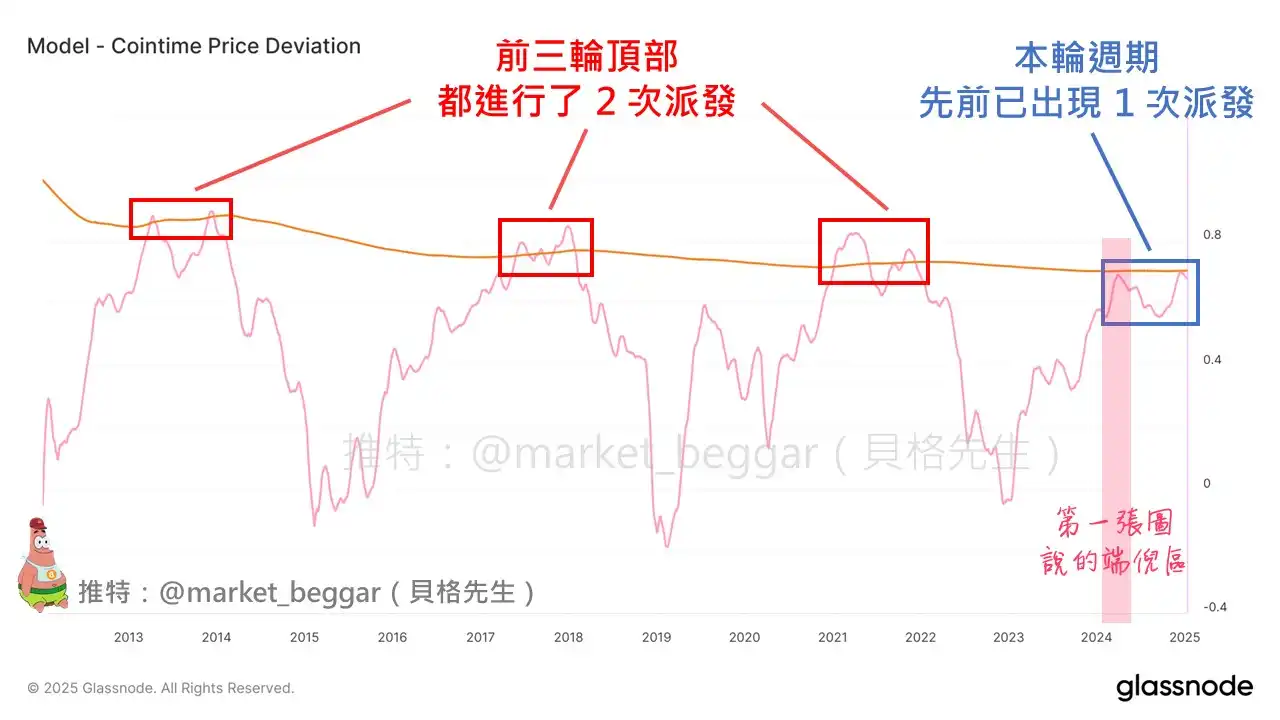
The current model status is as shown in the chart, which shows that each historical cycle top corresponds to 2 obvious peaks (2 distributions), which corroborates the concept explained in the second paragraph.
In this cycle, the first obvious peak (suspicious area) has already occurred, and we are currently at the second peak (with signs of turning).
IV. Why Didn't the Top Signal Model in Chart 1 Trigger?
Through this article, I'll also explain this issue to readers. The top signal model includes many parameters, which I subjectively set. During research and design, I actually deliberately relaxed the signal trigger conditions, but still didn't allow the distribution in March and April last year to generate a signal.
However, this is not a major issue, because as a trader, when analyzing the market, one cannot rely on a single model or signal. Especially for models with subjective parameters, I only use them as reference, and in practical judgment, I still comprehensively analyze various indicators and data together.
One last word: "This bull market is a very good opportunity to test various top signals in the market, because most top signals are simply rigid thinking with extremely high failure rates".
V. Conclusion
This article is a bit long, please forgive me. Thank you to readers who patiently read to this point, and I hope this article is helpful to you.
And after subsequent price drops, I also urgently added an article on "Right-Side Top Escaping Strategy" based on the RUP top signal content: https://x.com/market_beggar/status/1876836457555616173
If you agree with my perspective, perhaps at this moment, you should be prepared to escape the top at any time...


