

The US stock market saw a significant rise last Friday, with the three major indices rising together. The S&P 500 index performed particularly well, closing higher for the ninth consecutive trading day, creating the longest winning streak in nearly 20 years. Behind this rally, two key driving forces were at play: first, the better-than-expected non-farm employment report, which alleviated market concerns about potential economic slowdown; second, signs of easing US-China trade relations, which boosted market optimism.
According to the latest data from the US Bureau of Labor Statistics, non-farm employment in April increased by 177,000, significantly higher than the market's general expectation of 138,000. Although slightly lower than the revised 185,000 in March, it remains robust. This report effectively relieved market concerns about a potential rapid deterioration of the US economy, thereby boosting investors' risk appetite.
In addition to favorable economic data, the easing of US-China trade relations also injected optimism into the market. The Ministry of Commerce stated on Thursday that it is assessing the possibility of restarting trade negotiations with the United States, but also emphasized that the US needs to show sincerity, particularly in preparing to address key issues such as removing unilateral tariff increases.
However, based on historical experience, the next few months are often the off-season for financial markets, with many investors following the Wall Street adage "Sell in May and Walk Away". This year's market atmosphere might break past patterns, with Bitcoin potentially challenging the $98,000 mark after performing weakly in recent months, and growth stocks showing signs of recovery. Although the latest US GDP data is slightly weak, increasing recession risks, a potential Fed rate cut could bring a new round of market rebound momentum.
In the cryptocurrency market, after failing to break through the $98,000 mark on the 2nd, Bitcoin's price dropped sharply, reaching a low of $93,445. At the time of writing, it was priced at $94,334, with a decline of approximately 1.83% in the past 24 hours.
Bitcoin 4-hour chart
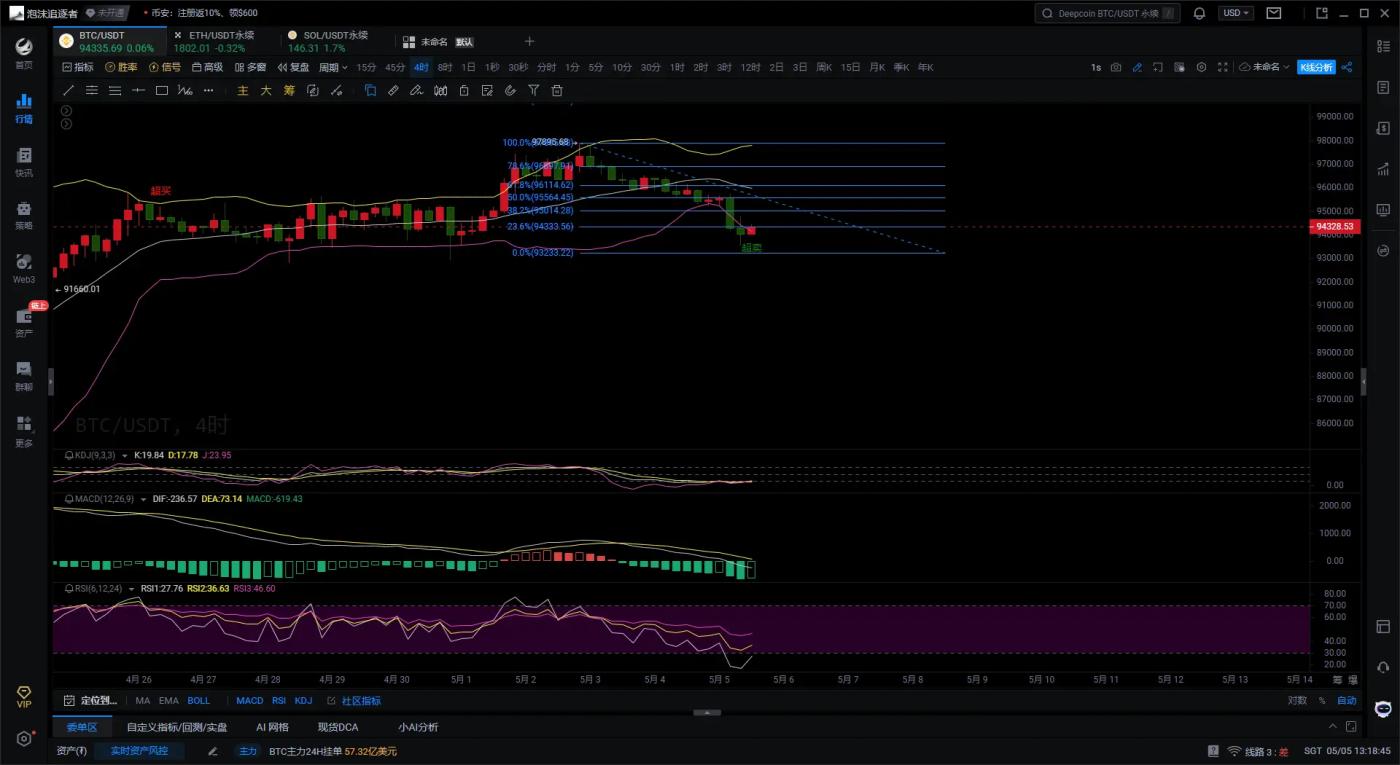
Bitcoin's price has broken below the middle Bollinger Band and is approaching the lower band, with the band's widening indicating increased volatility. If it fails to hold the lower band support, it may accelerate its decline. The KDJ indicators show oversold conditions, but the J-line's rebound suggests a potential short-term stabilization. The MACD indicator shows the DIF line far below the DEA line, with the green histogram continuing to expand, indicating a clear bearish trend with no reversal signals like bottom divergence or golden cross. Currently, the price is hovering around $94,335 (23.6% retracement level), which is a critical short-term point. If this support is lost, it may drop to $93,238 (0.0% retracement); if it holds, resistance levels are at $95,011 (38.2%) and $95,564 (50.0%). In the short term, the focus is on the $94,335 level - a breakdown could lead to further weakness.
Rather than giving you a 100% accurate suggestion, it's better to provide you with the right perspective and trend. After all, teaching someone to fish is better than giving them a fish. A suggestion can earn you money for a moment, but a strategy can earn you money for a lifetime! The focus is on the approach, on grasping trends, on market layout and position planning. What I can do is use my practical experience to help everyone, guiding your investment decisions and management in the right direction.
Writing time: (2025-05-05,13:00)
(Article - Big Immortal Talks Coins)


