

XRP has increased by 15.4% in the past 30 days but has dropped 8.6% in the recent four days, indicating increasing short-term pressure. Despite monthly profits, XRP remains the third-worst performing asset among the top 20 cryptocurrencies, only surpassing BNB and TRX during this period.
Momentum indicators like RSI are attempting to stabilize, but the formation of a red Ichimoku cloud and weakening EMA structure are causing concern. With significant resistance levels above and the potential for a death cross, XRP is facing a critical moment to determine its next direction.
XRP's RSI Index Recovers to Neutral Zone after Sharp Decline
XRP's Relative Strength Index (RSI) has recovered to 47.52, strongly increasing from yesterday's 35.18 after declining from 65.76 four days ago and reaching a recent peak of 74.22 six days ago.
This rapid oscillation reflects momentum changes after a period of strong selling pressure.
Although the RSI remains below the neutral threshold, the upward movement may indicate early signs of new interest or a short-term recovery after recent losses.
Recently, US Judge Analisa Torres denied the joint settlement request from SEC and Ripple, calling it procedurally incorrect – meaning the initial penalties and bans remain in effect.
The XRP lawsuit continues, with both parties now needing to properly file or continue the appeal process, which could impact its price in the coming weeks.
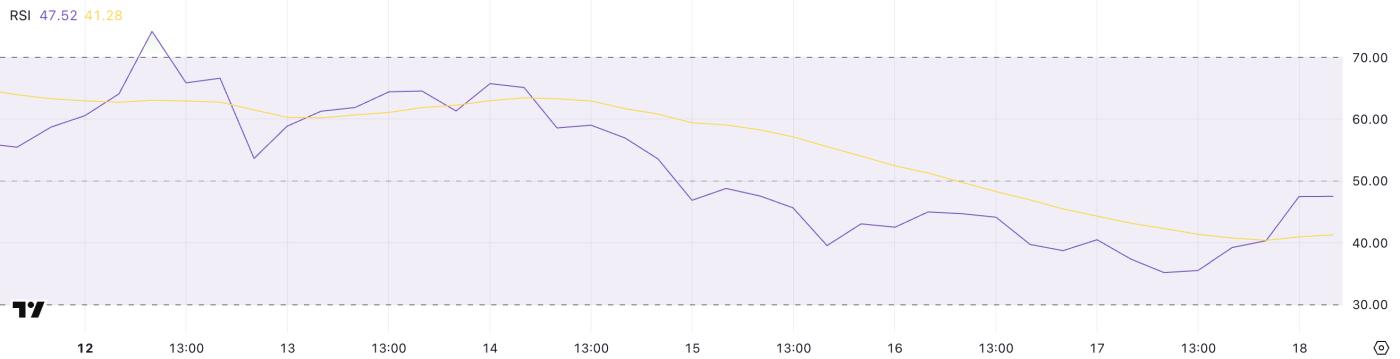 XRP RSI. Source: TradingView.
RSI is a momentum oscillator ranging from 0 to 100 and helps identify overbought or oversold market conditions.
Values above 70 typically indicate an asset is overbought and may need adjustment, while values below 30 suggest it might be oversold and ready for a recovery.
With XRP's RSI currently near the midpoint at 47.52, the asset is in a neutral zone – neither overbought nor oversold. This could mean the price will consolidate ahead, or potentially move to retest resistance levels if momentum increases.
Momentum at Risk as XRP Faces Red Cloud Formation
XRP's Ichimoku chart shows changes in market structure. After several weak sessions, the price has tested the green Tenkan-sen line.
Notably, the cloud ahead has just turned red for the first time in several days – an early warning that selling pressure may increase.
Although the current candle attempts to close above the Tenkan-sen, the broader structure is facing increasing resistance, especially as the price approaches the cloud's lower edge.
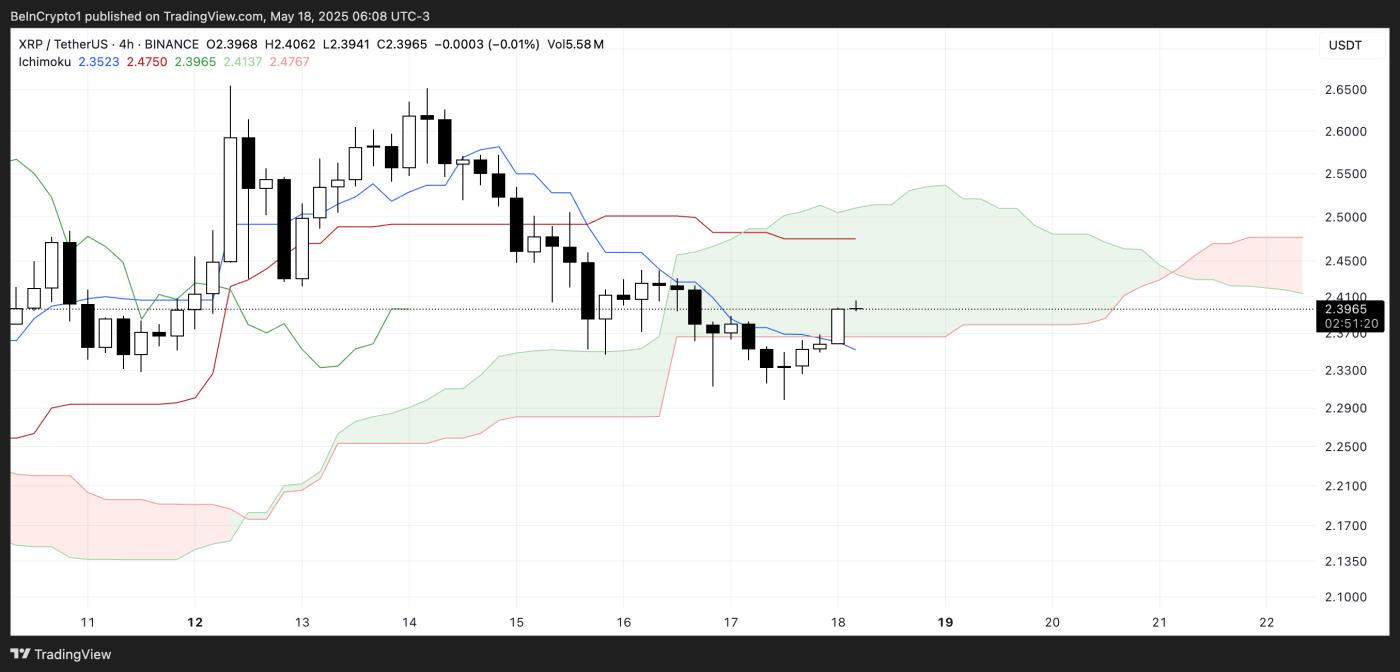 XRP Ichimoku Cloud. Source: TradingView.
The narrowing distance between the red Kijun-sen and price line further increases short-term tension, emphasizing that buyers must intervene now or risk losing momentum.
The cloud's color change suggests that price increases may be limited even if XRP enters the cloud.
If rejected here, the path of least resistance could be downward, opening possibilities for a new correction.
XRP Approaches Important Resistance as EMA Death Cross Threatens
XRP's EMA lines are signaling potential trouble ahead, with short-term averages declining sharply over the past four days.
A death cross – where short-term EMA lines cross below long-term lines – seems increasingly likely if current momentum does not reverse.
XRP's price is currently fluctuating near an important resistance zone around $2.40, where both short-term EMA lines are converging. A strong breakout above this area could neutralize the bearish setup and open a path towards a potential move to $2.65.
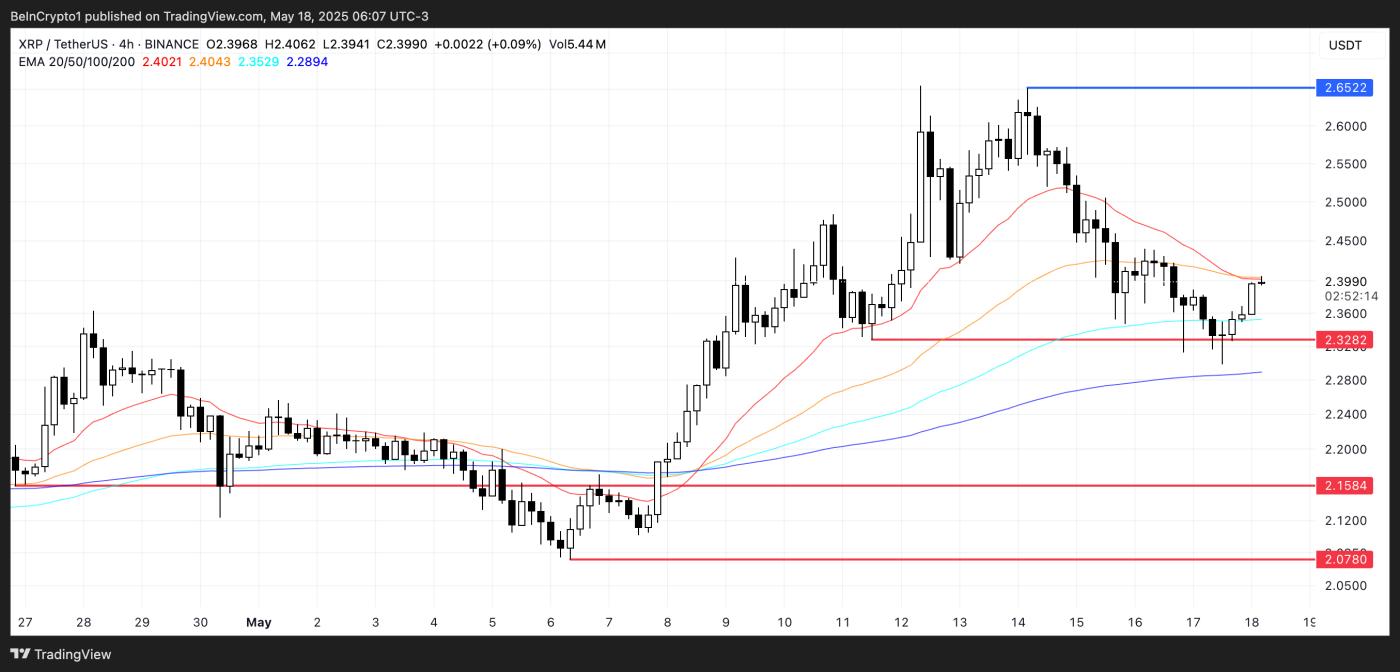 XRP Price Analysis. Source: TradingView.
However, if unable to reclaim that resistance, XRP could easily face new selling pressure.
The $2.32 level, which has served as support in recent sessions, will be crucial—if not maintained during the next retest, further downside targets will be around $2.15 and $2.07.
With EMAs declining and resistance above, XRP needs to generate significant buying pressure soon to avoid further price slippage.


