


Key Indicators: (May 12th 4 PM -> May 19th 4 PM Hong Kong Time)
BTC against USD dropped 1.5% (from $104,800 -> $103,200), ETH against USD dropped 5.3% (from $2,540 -> $2,405)
BTC Spot Technical Indicators against USD
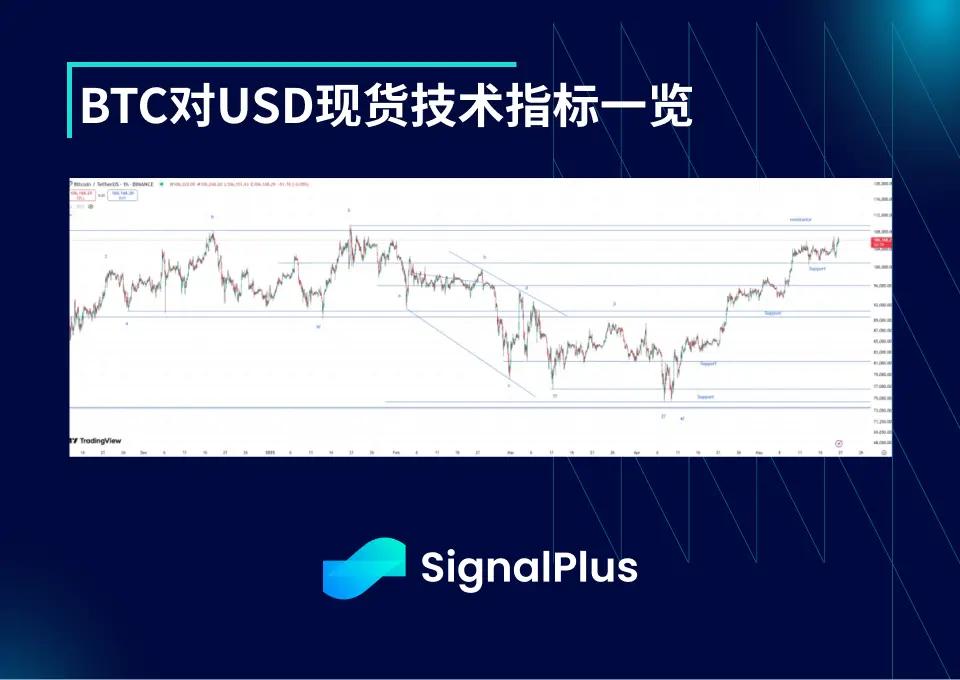
Since the price entered a higher price range (101-110 thousand dollars), market activity has shown low volatility in both high and daily frequencies. Balanced buying and selling transactions have effectively controlled the price within the range. Considering the market's consistent volatility cycle, we found that the past year and a half's volatility cycle is generally within 14-20 days and rarely exceeds 20 days, suggesting market patience may be exhausted in the next week. We will either attempt to break through the historical high again or fall to 90-95 thousand dollars for a long-term consolidation.
Although we still acknowledge potential pullbacks during consolidation, it's worth noting that the recent price trend support has been very strong. We are more confident that the push to $125,000 will arrive, and faster than initially expected. The current price trend is not yet clear, but we anticipate significant market follow-up after breaking through $110,000.
Market Themes
Last week, overall market risk sentiment warmed up, with US-China tariffs rolling back to their starting point (was it all just a nightmare?). US macro data was also market-friendly, including a slightly slowing CPI index. US stocks have completely offset the sell-off caused by the trade war and begun to eliminate the pricing reassessment caused by "US economic slowdown". Moody's downgrade of US debt rating from AAA to AA1 ultimately caused no major waves, as the stock market's "knee-jerk reaction" quickly subsided, though the US dollar and long-term US bonds did adjust their pricing accordingly. From a macro fundamental perspective, any further rise in US stocks will be challenging, with the market forced to lighten position weights or close positions at relatively cautious/pessimistic levels over the past week.
The Bitcoin market remained stable within its range as Saylor continued to actively "buy the dip" (purchasing 7,390 BTC at an average price of $103,500 last week). There are still many sell orders at 105-107 thousand dollars. The price briefly explored this level on Monday but quickly retreated to $102,000, then returned to the 101-107 thousand dollar midrange we've been trapped in for weeks. Ethereum briefly glimpsed $3,000, touched $2,800, then fell back and stabilized around $2,500.
BTC ATM Implied Volatility
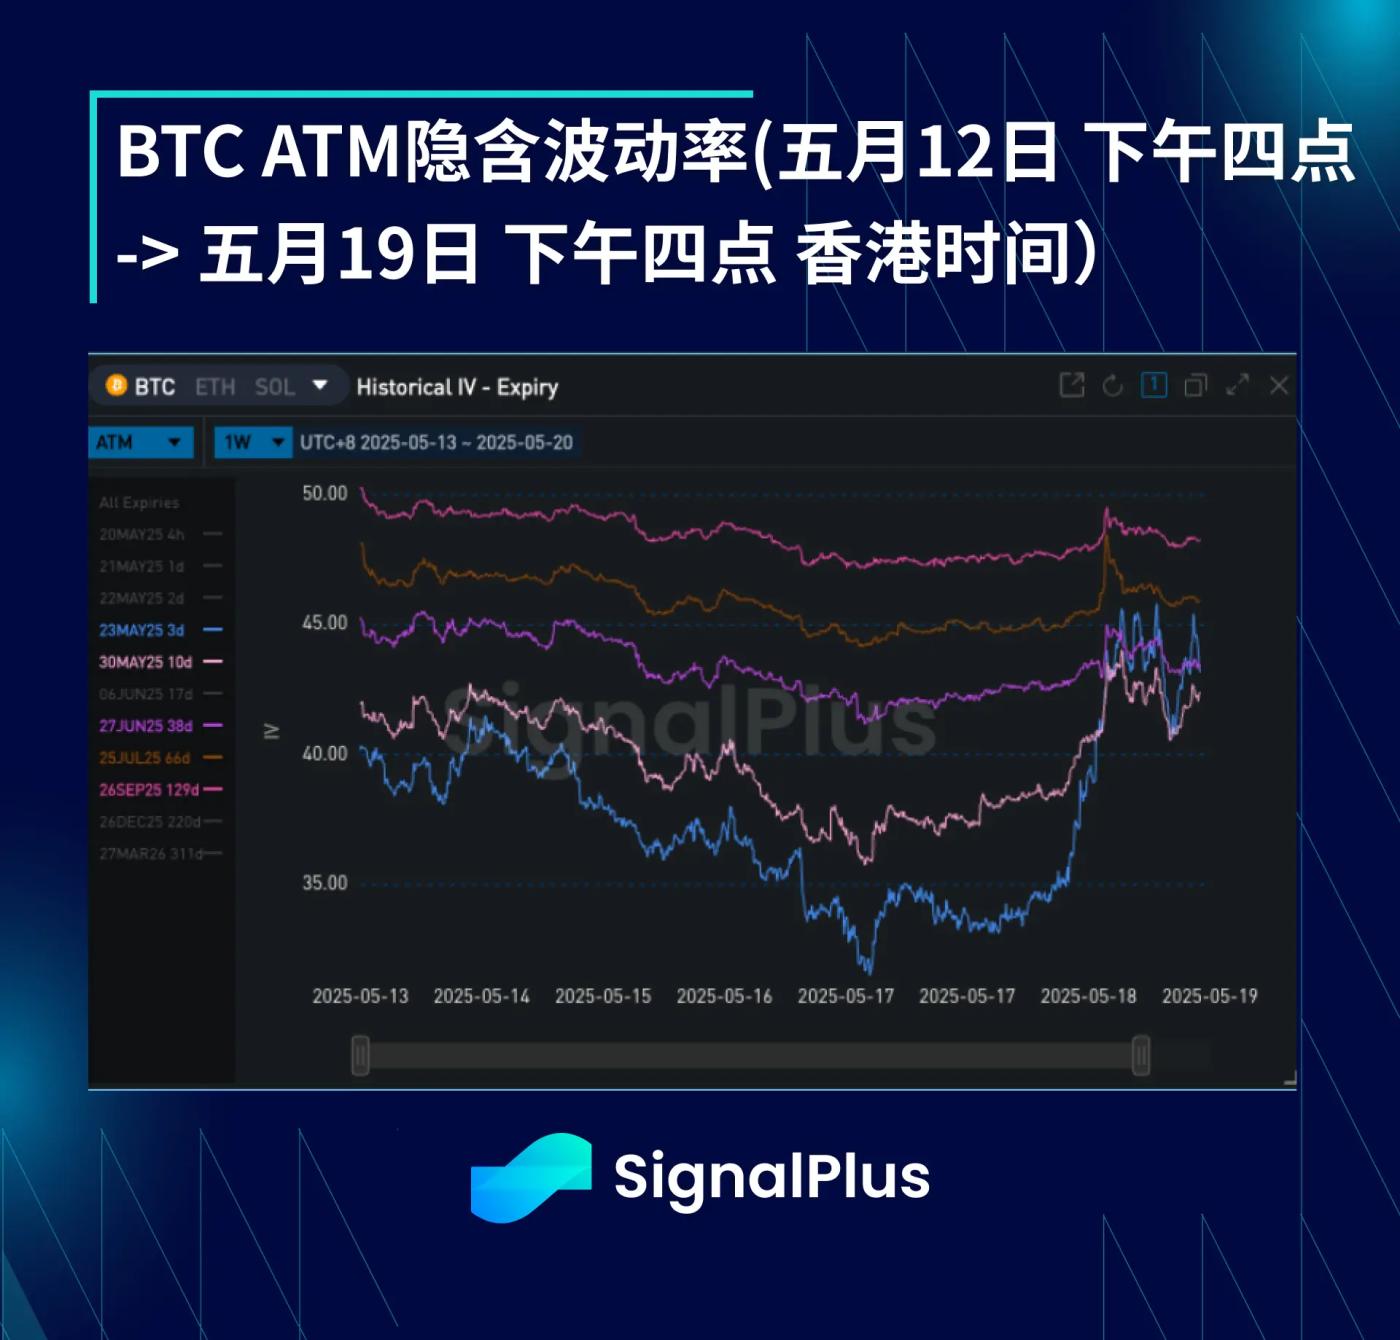
Another week of low volatility, with volatility around just over 30 before Monday's rapid price movement, causing implied volatility to continue declining last week. The Monday morning rise quickly disappeared. Overall, the market still maintains a bullish volatility stance, as there is significant selling pressure on both sides of the price movement. As we continue to be suppressed in the 101-107 thousand dollar range, options demand will remain silent.
The volatility term structure remains very steep, with June and July expiration dates declining at a 1-1.5 point rate (without considering term structure changes). This means that even holding long positions on the far end is very challenging (although absolute implied volatility levels are low). Market makers appear to hold long positions in June or July and continuously sell the front end to support the back end's losses. This is why the front end is so compressed (almost as low as actual volatility).
BTC Skew/Kurtosis
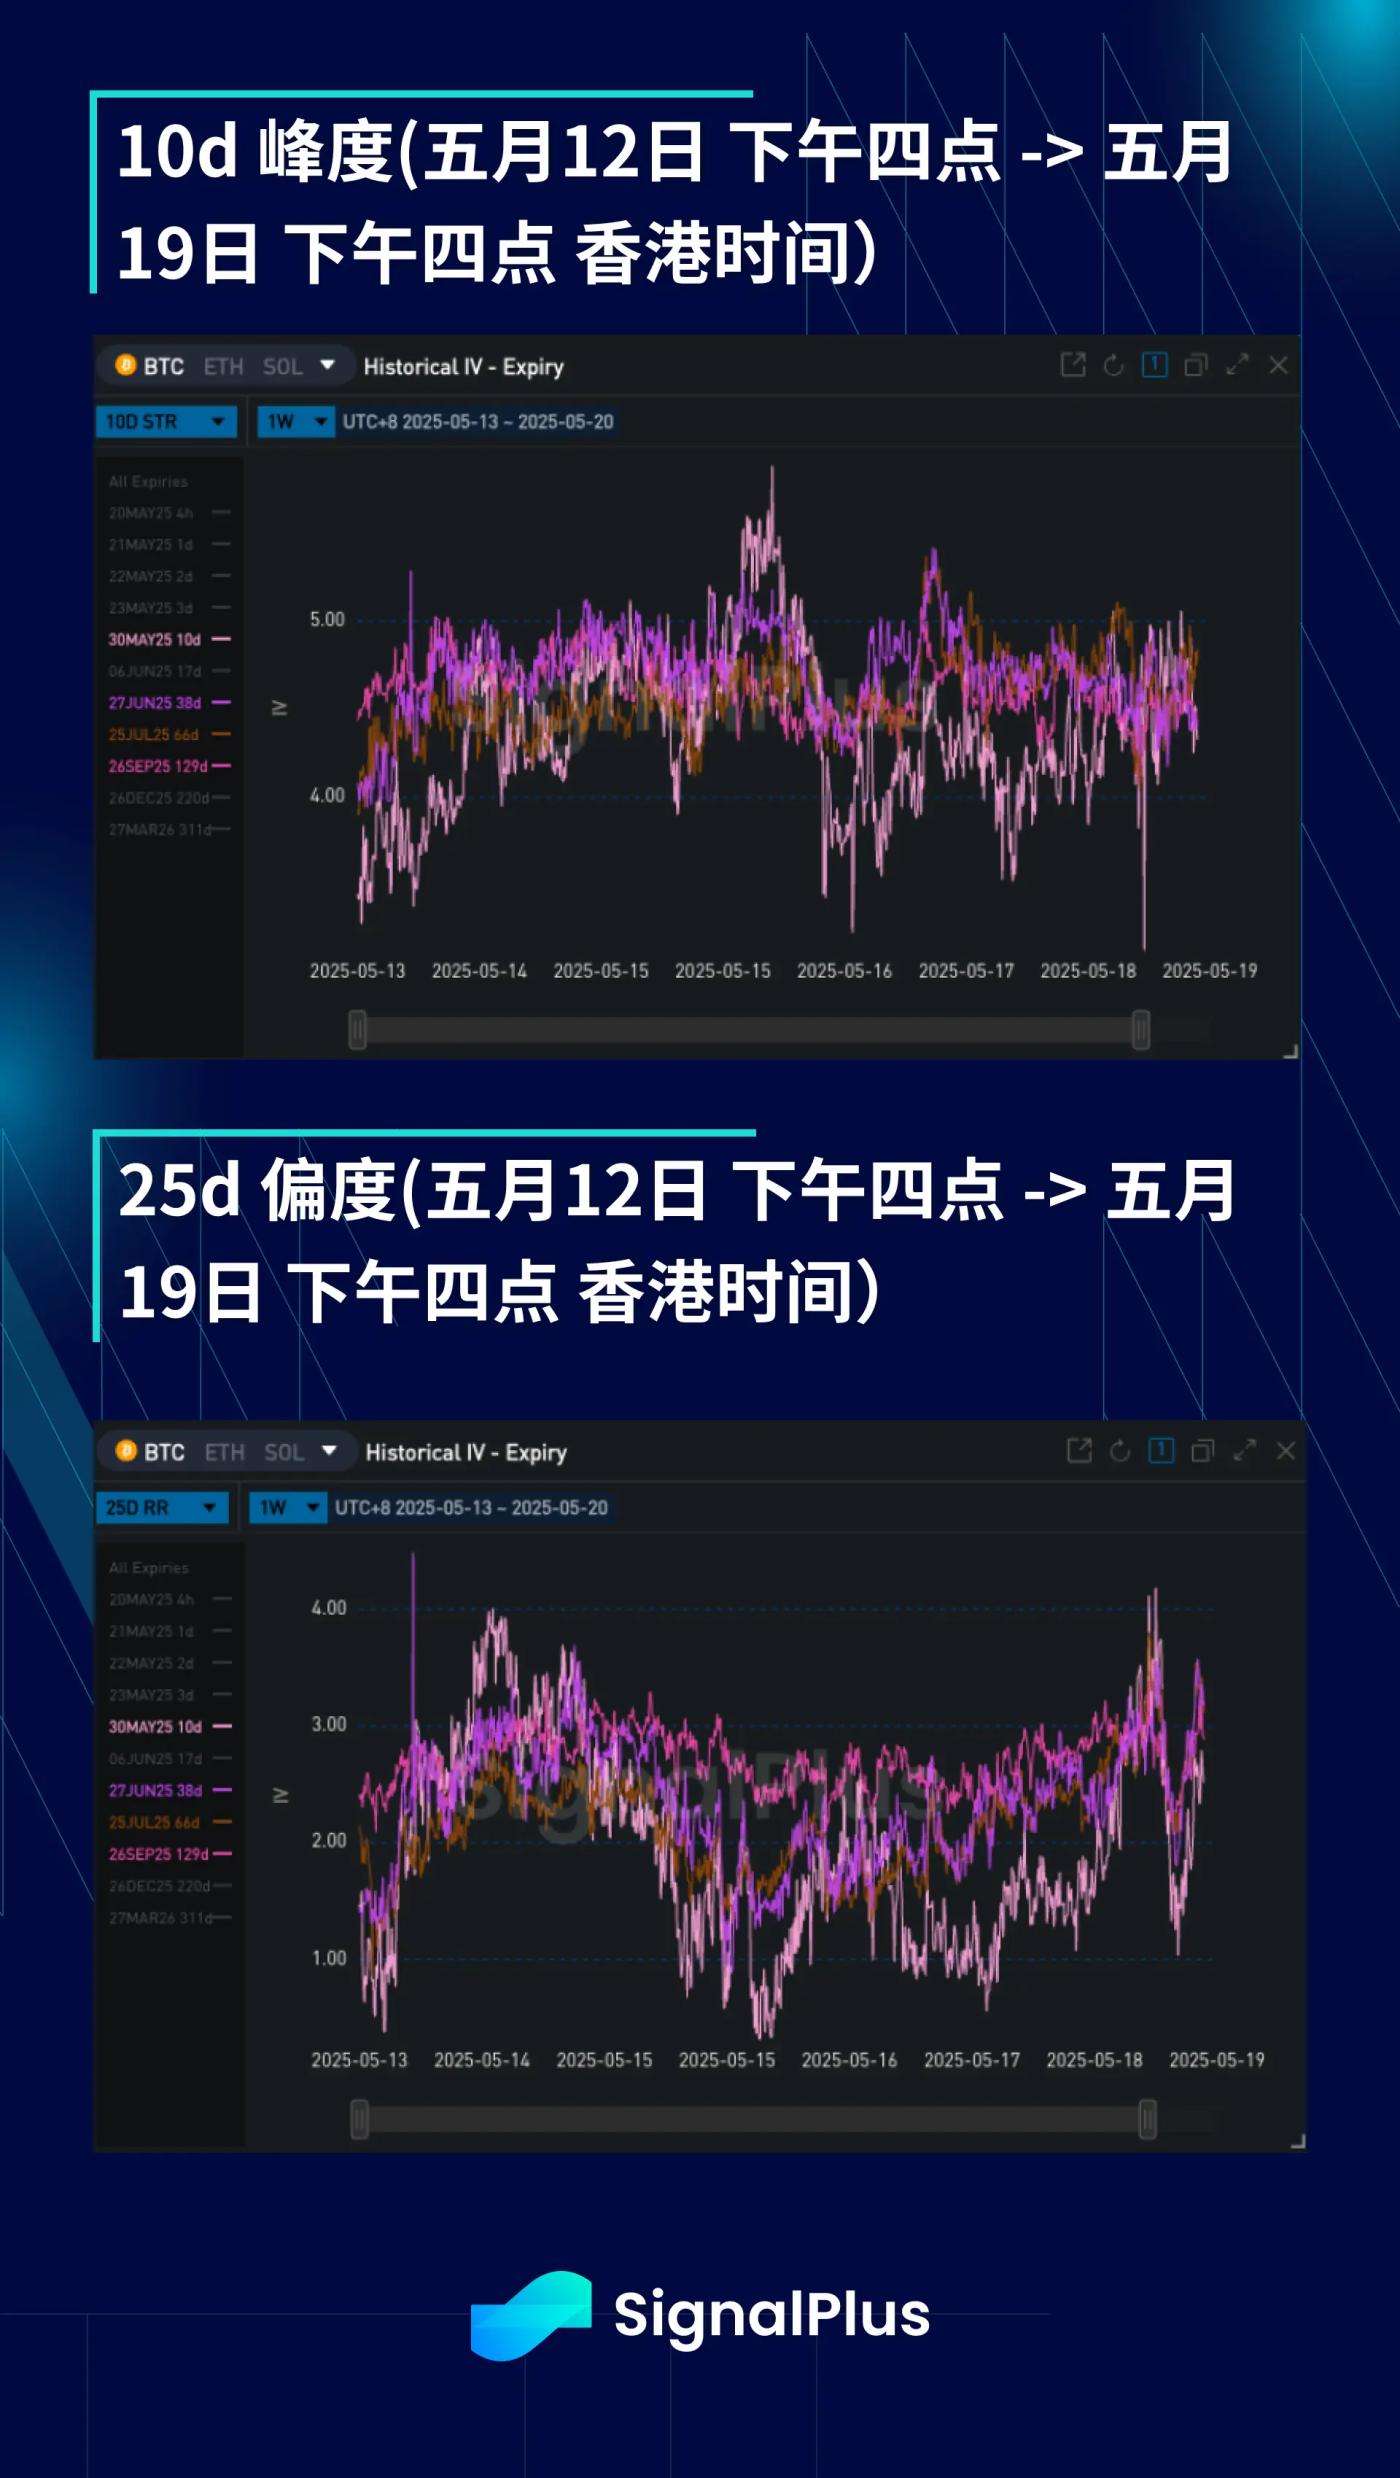
After a relatively stable week, skew sharply tilted upward on Monday morning when the price broke $106,000, but was then very volatilely pulled back to $102,000, causing skew to pullback. However, with significant buying demand at 100-101 thousand dollars, the market is increasingly concerned about potential significant upward price movement beyond historical highs, causing skew to again tilt upward.
Kurtosis remained horizontal after bouncing back from its low point, with persistent selling pressure still suppressing it. However, the market also recognizes the possibility of actual volatility surging outside the 101-107 thousand dollar range, thus reducing the willingness to sell outside this interval.
Good luck to everyone this week!


