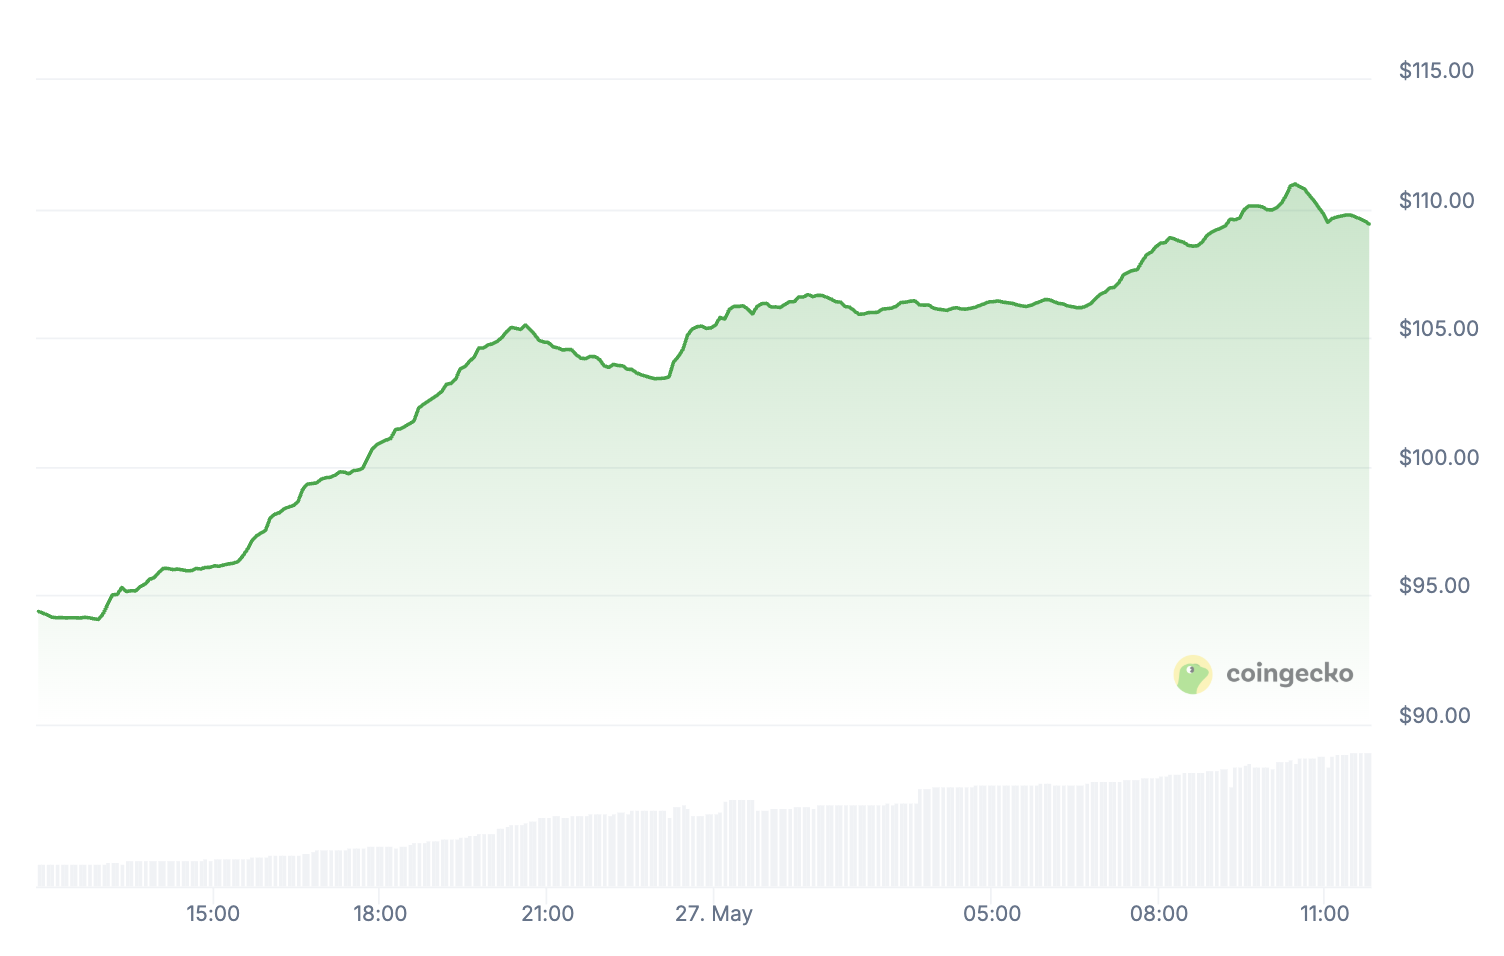
QNT is gaining momentum after revealing Overledger Fusion and Quant Flow. These two major initiatives aim to connect institutional finance and DeFi. Following the announcement, the price surged by approximately 13%, with technical indicators like RSI and Ichimoku Cloud showing a clear upward trend.
The RSI has exceeded 77, indicating strong buying pressure. With the EMA alignment of the uptrend and approaching key resistance levels, QNT is facing a critical test to determine whether the rally will extend or pause for a short-term correction.
Quant Reveals Overledger Fusion and Quant Flow, Connecting Institutions and DeFi
QNT surged by about 13% after CEO Gilbert Verdian announced Overledger Fusion. This is a new Layer 2.5 network connecting institutions, enterprises, and the DeFi ecosystem.
The network introduces a multi-ledger rollup system that enables seamless interoperability between public blockchains. It also addresses institutional compliance, privacy, and scalability issues.
Fusion will begin its launch in June 2025 and includes a trusted node program where approved operators can stake QNT and receive rewards based on transaction priority.
Simultaneously, the Quant Network is expanding the Quant Flow platform, centered around the programmable payment language PayScript®. Quant Flow automates complex financial operations, enabling rule-based payments, global remittances, and financial workflows.
Supporting both stablecoins and traditional currencies, it provides speed, compliance, and flexibility for businesses of all sizes.
Overledger Fusion and Quant Flow represent a strategic push to make blockchain infrastructure practically usable for institutional real-world applications.
QNT Shows Strong Momentum... RSI and Ichimoku Cloud Strength
QNT's Relative Strength Index (RSI) surged to 77.78 after the recent price spike and currently maintains 73.66, a significant increase from the previous day's 48.40.
This sharp momentum increase reflects strong buying pressure following the Quant team's recent announcement.
This movement pushes QNT into the overbought territory, indicating that the uptrend has accelerated rapidly and may be approaching short-term exhaustion.
The RSI is a momentum indicator measuring the speed and magnitude of recent price changes, ranging from 0 to 100. Generally, values above 70 indicate an asset is overbought, while values below 30 may suggest an oversold condition.
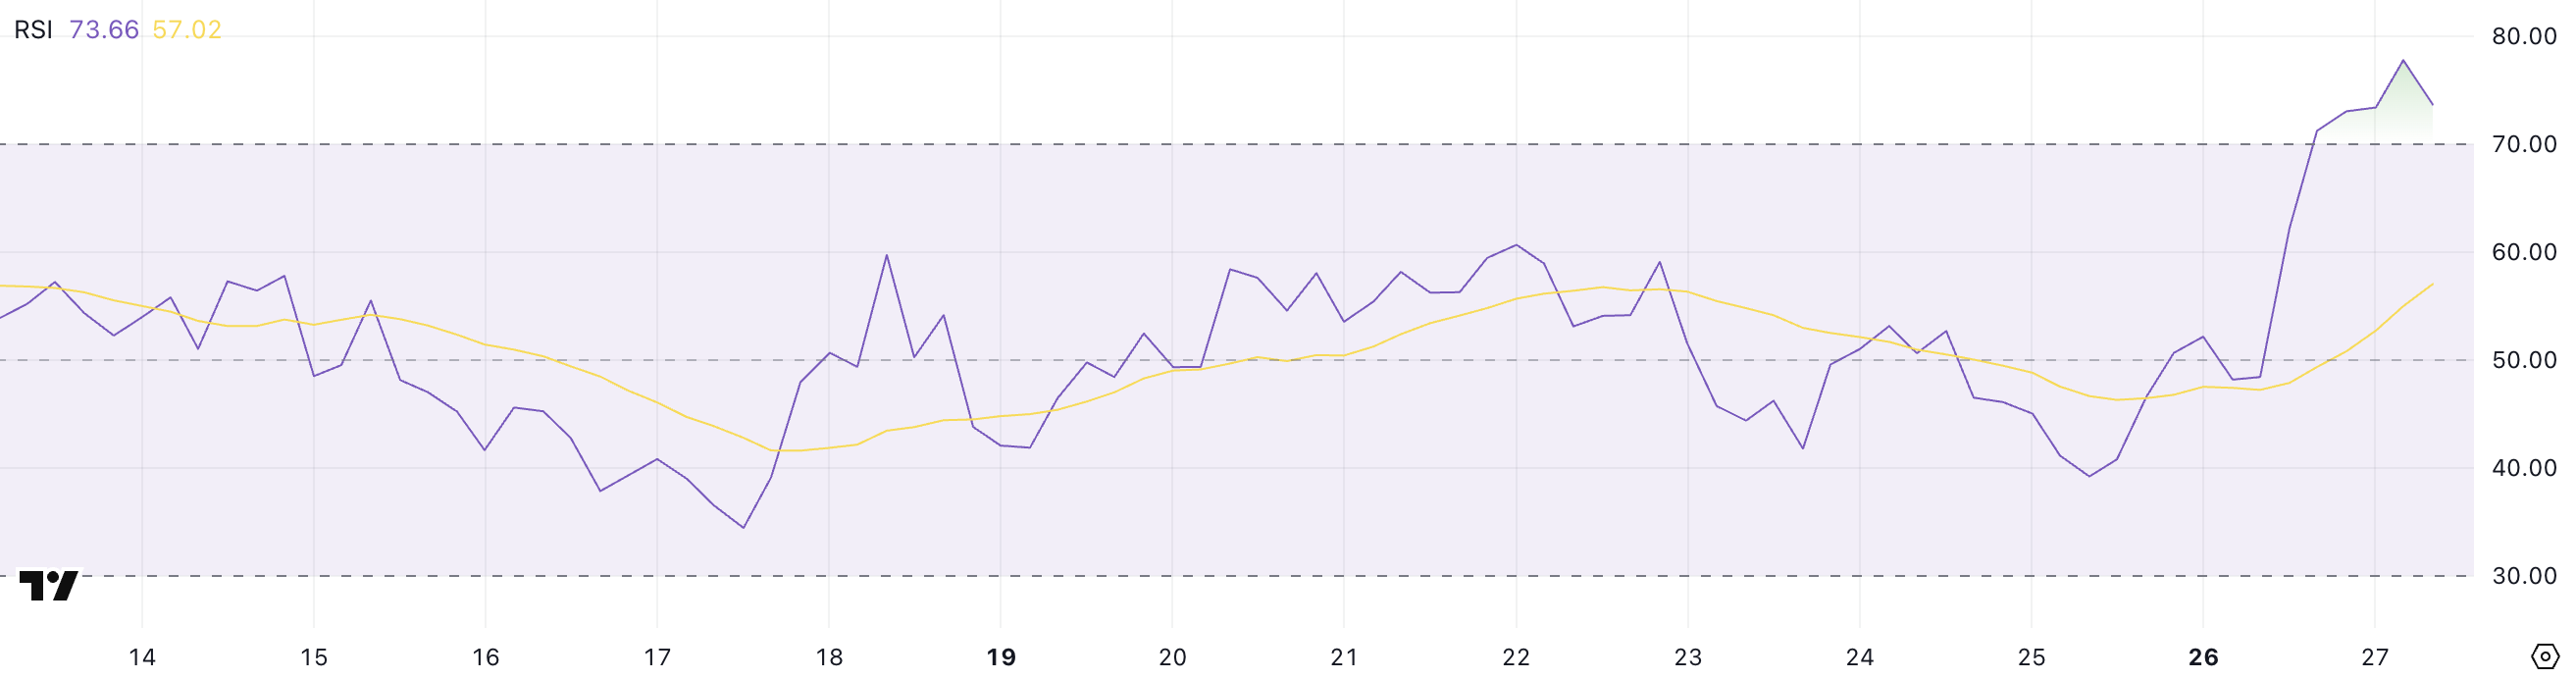
With QNT's RSI now exceeding 73, the token may enter a cooling or correction phase, especially if buyers start taking profits.
However, sustained overbought conditions can also occur during strong uptrends. Therefore, the possibility of continued upward movement cannot be ruled out.
The QNT Ichimoku Cloud chart shows a clear bullish breakout. The price is strongly positioned above the cloud, with all major indicators aligned favorably for buyers.
The conversion line (blue line) crossing above the base line (red line) confirms short-term upward momentum.
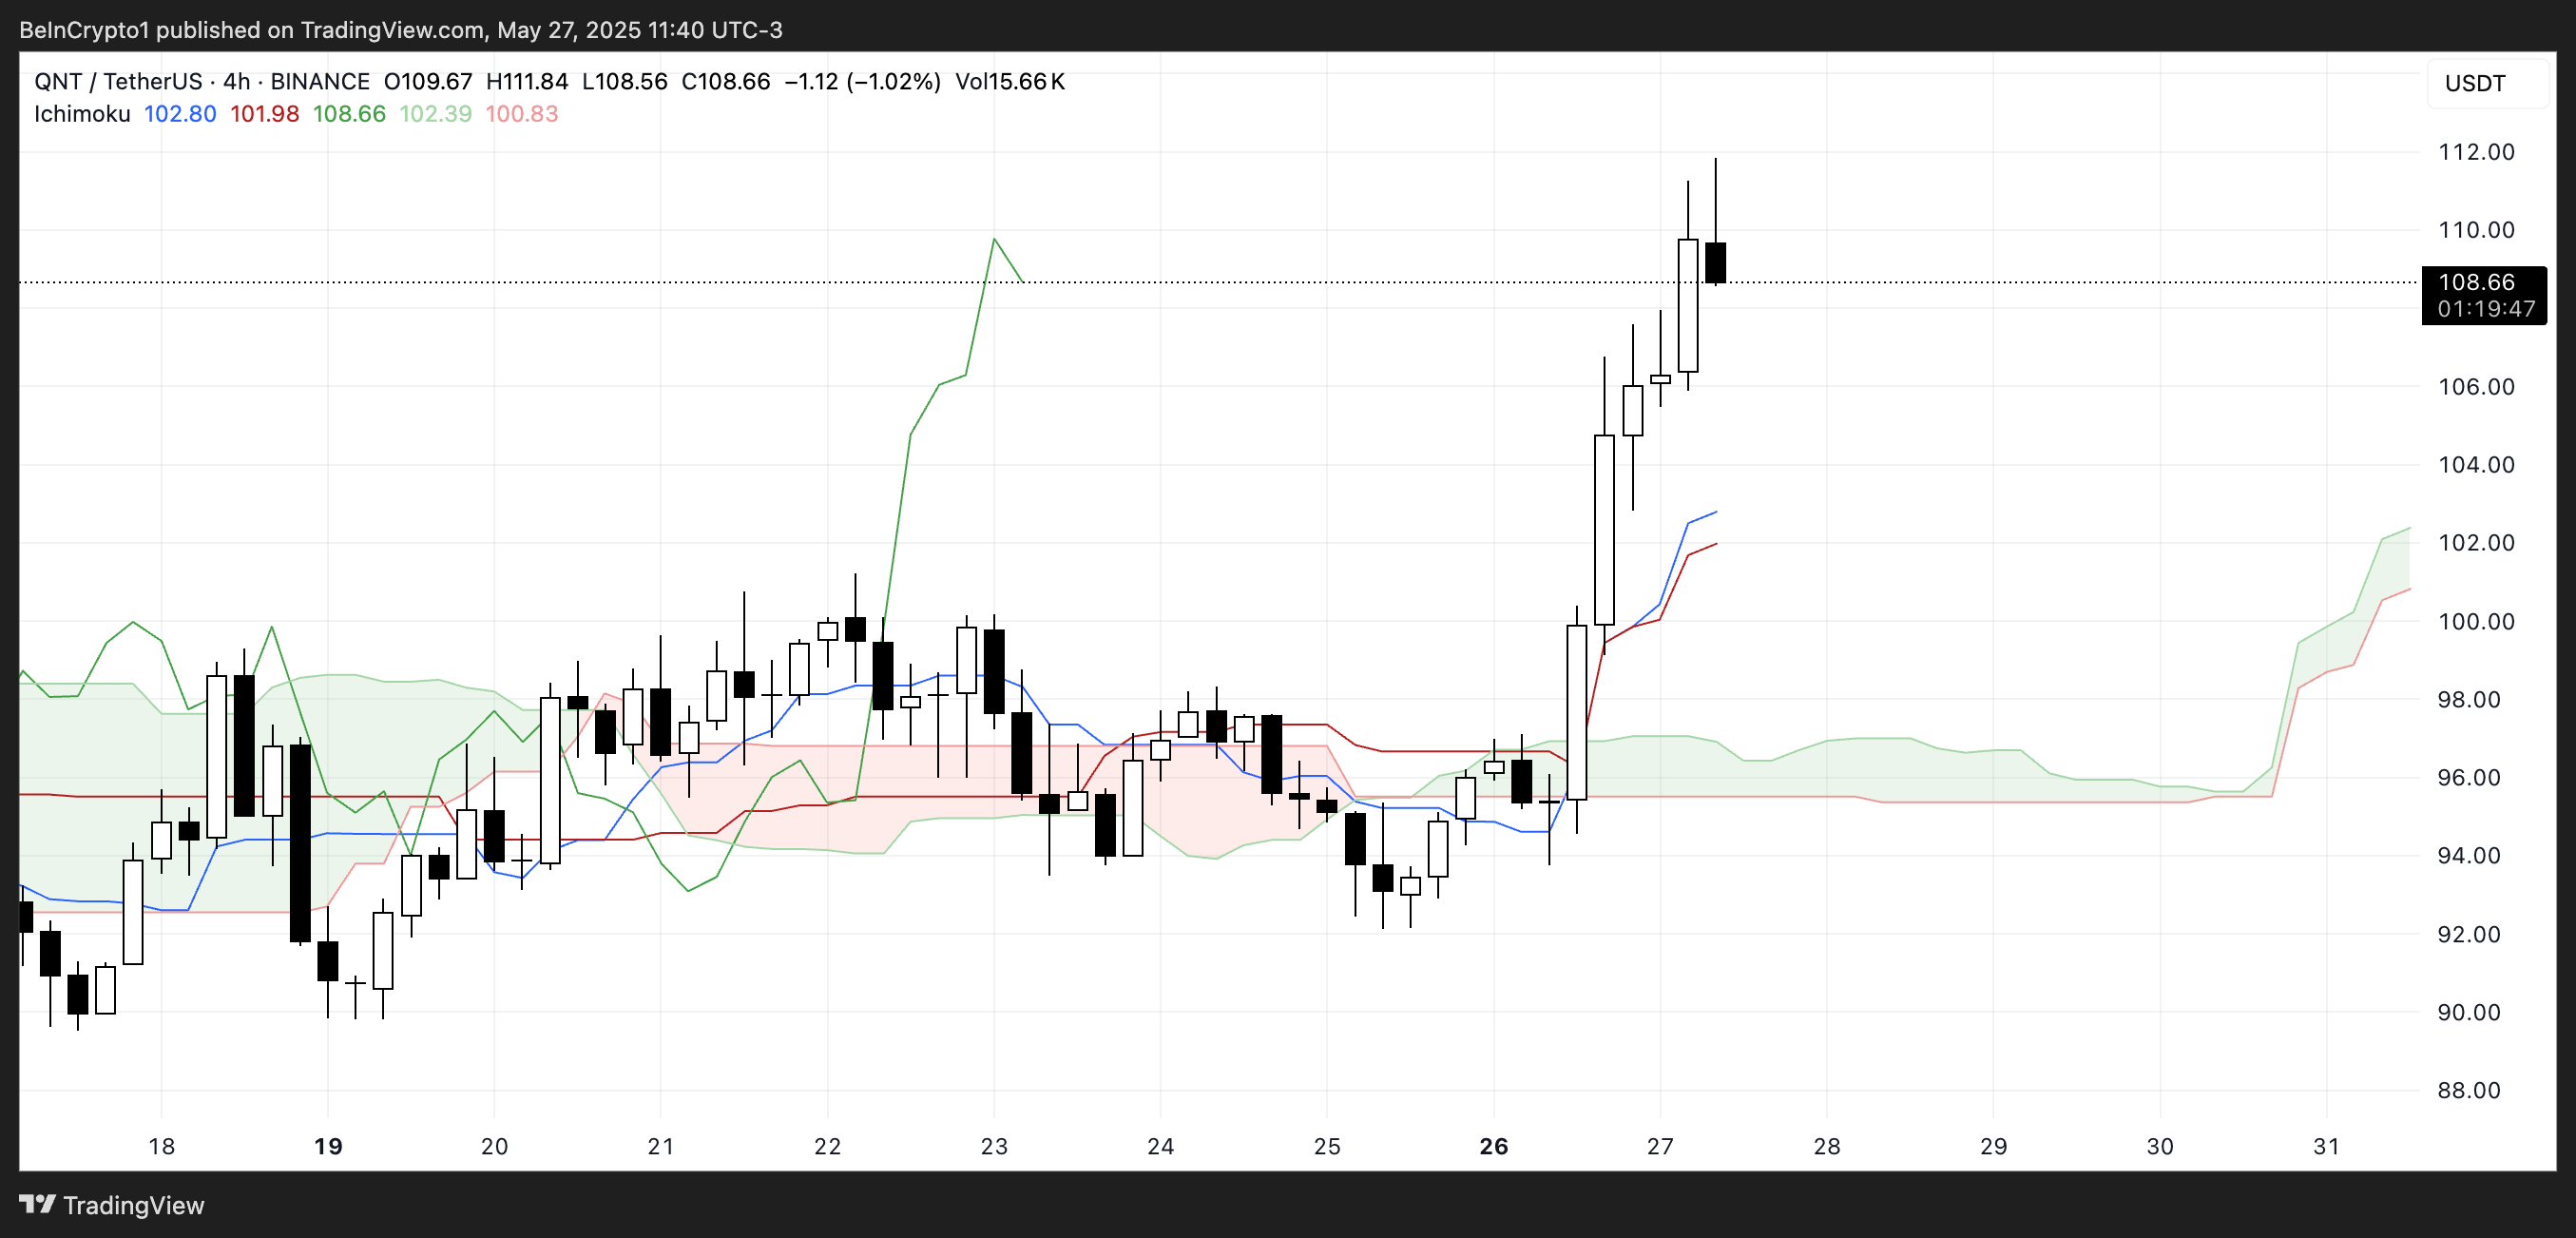
The cloud itself has turned green, with Leading Span A (green boundary) positioned above Leading Span B (red boundary), indicating the potential continuation of the uptrend.
Price movement is rapidly accelerating, leaving the cloud far behind, signaling strong buyer confidence. The lagging line is well-positioned above past price movements, maintaining high momentum.
However, the steep angle of recent movement could lead to a short-term correction or profit-taking.
While the overall structure currently indicates an uptrend, it's important to monitor the potential support of the conversion line in upcoming sessions.
QNT Targets $115... Moving Average Momentum
Quant's Exponential Moving Average (EMA) lines are currently aligned in an upward formation, supporting the strong upward momentum seen in recent sessions.
With prices rising rapidly, the next major resistance level is $111.85. If buying pressure breaks this level, QNT could extend its rally and retest the $115 zone, a level not reached since January 21st.
The uptrend continues as long as momentum is maintained and the price remains above short-term moving averages.
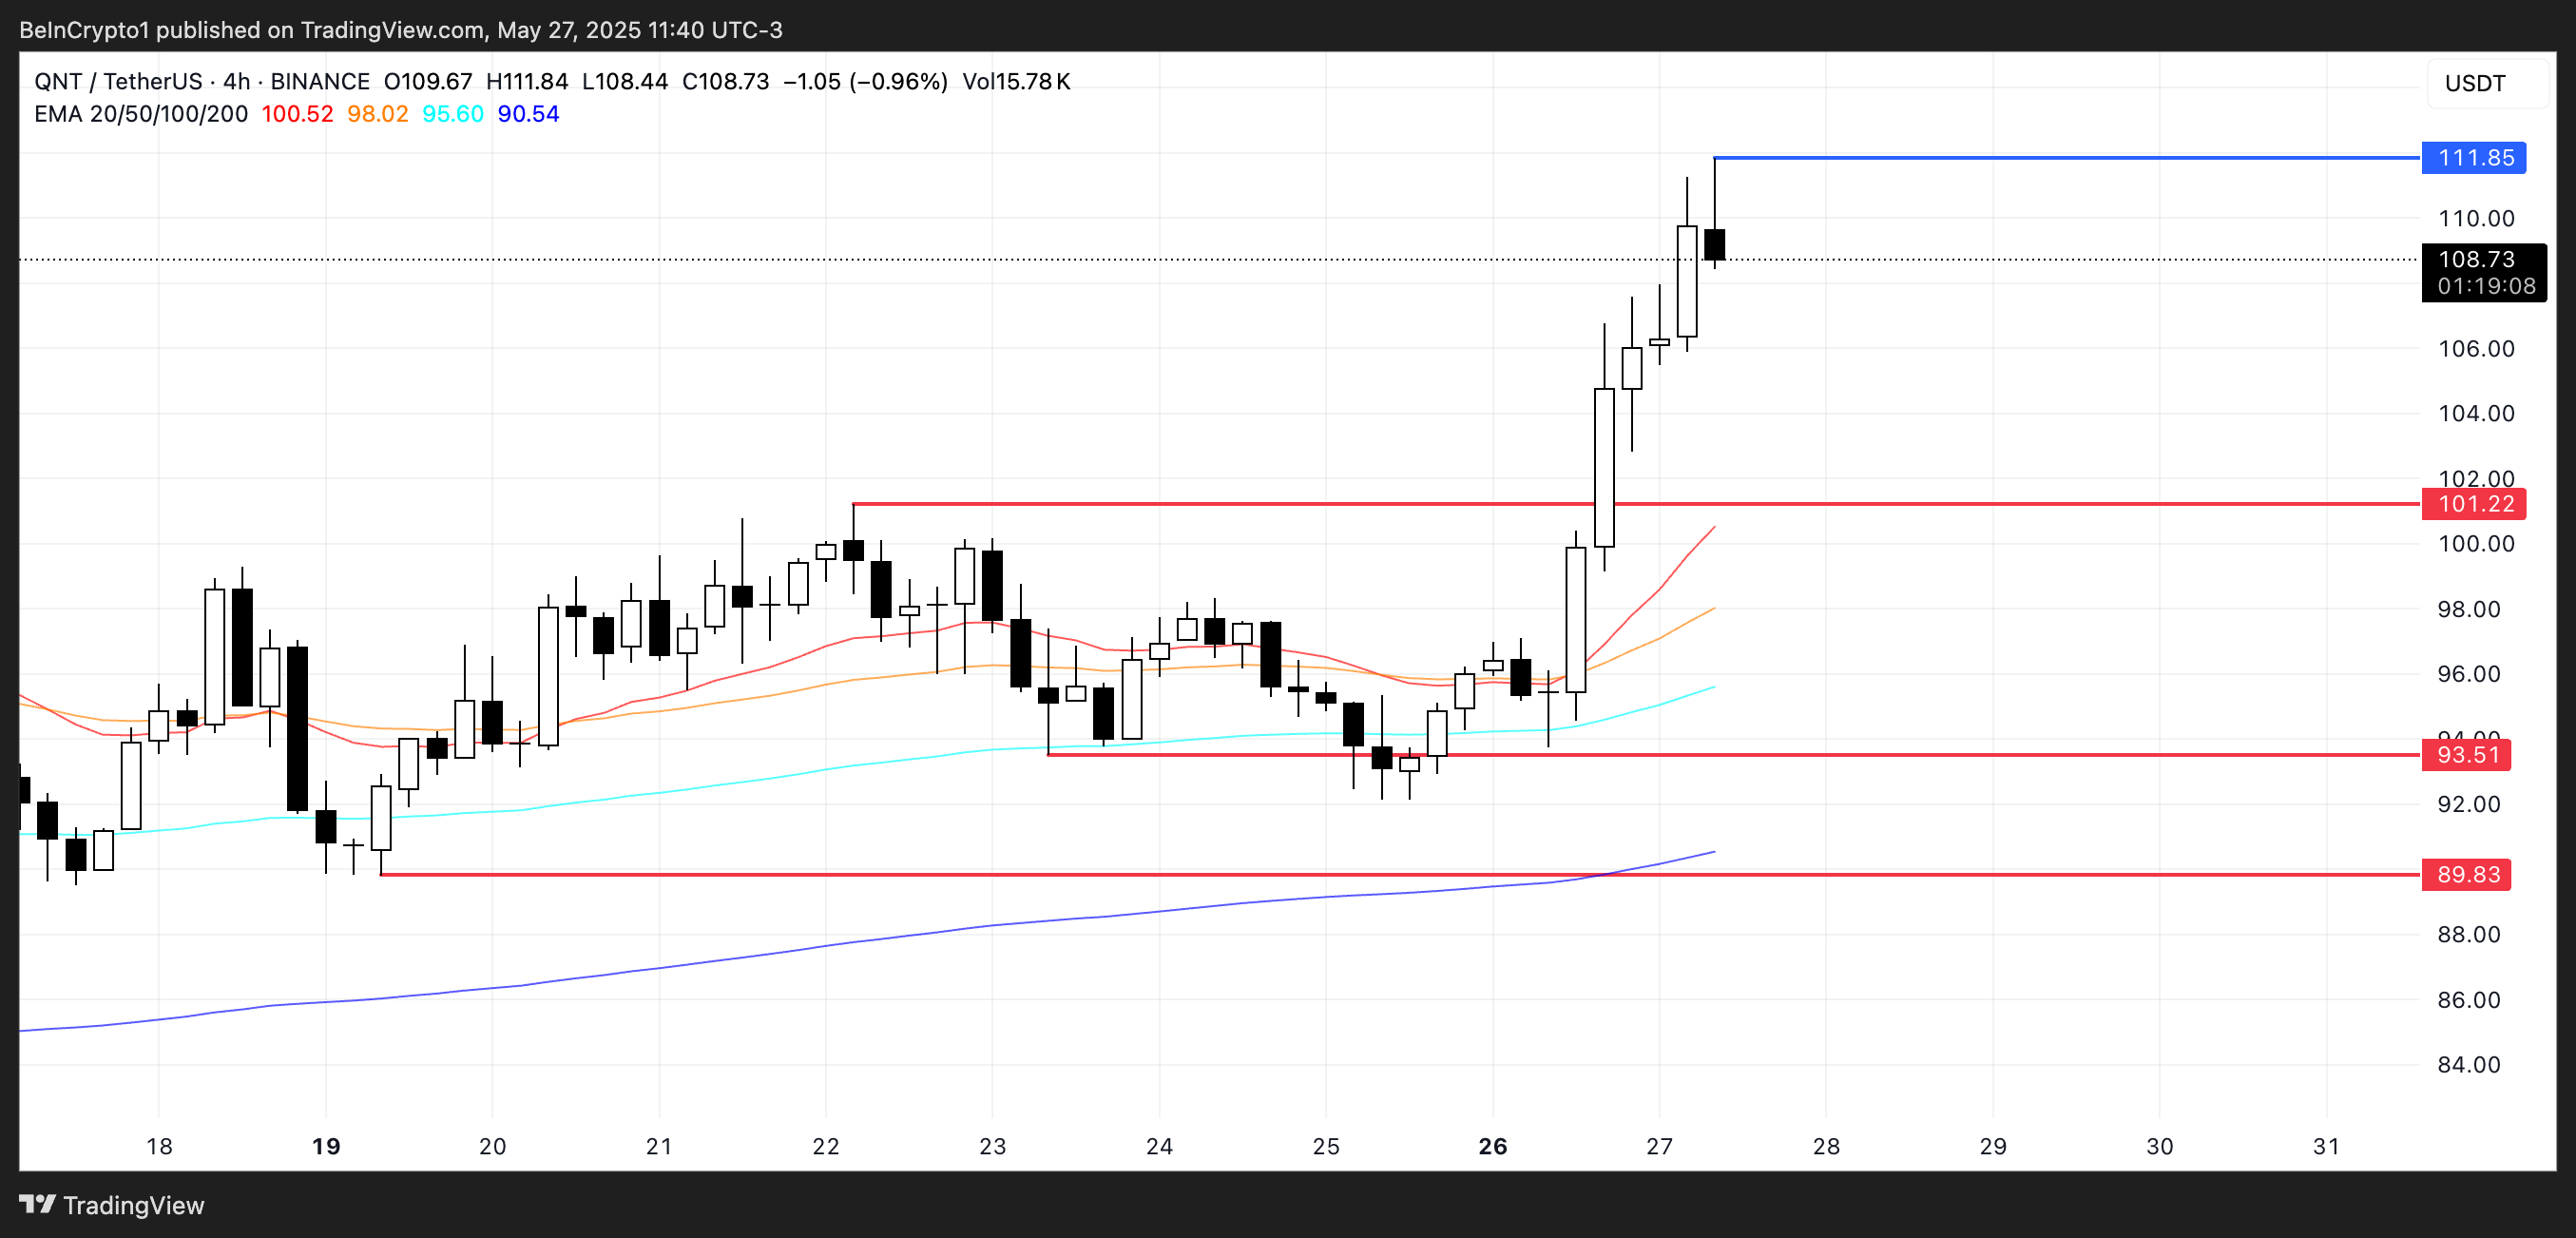
However, if momentum weakens and the trend reverses, the first major support level is located at $101.22.
A drop below this level could see QNT falling to $93.51.
If selling pressure intensifies, a further decline to $89.93 cannot be ruled out.