

Editor | GaryMa Wu Blockchain
Original Link:
https://www.placeholder.vc/blog/2025/4/16/combined-metrics-for-tracking-smart-contract-networks
Combined Metrics Scoring Panel:
https://lookerstudio.google.com/u/0/reporting/dac13f86-66d6-4251-bdd2-e9b06b04614e/page/p_rq3sjkssqd
One major advantage of blockchain networks over other digital platforms is that on-chain asset and transaction data are open to the public. This allows us to almost track the performance of various networks in real-time across multiple metrics. The most reliable method to assess the actual usage of a chain is to focus on a single metric, preferably refined to specific applications or user groups. However, this is not always achievable. With the increase in network numbers and data volume over the years, to simplify the tracking process without losing details, different forms of aggregation are needed. This article introduces a highly aggregated attempt.
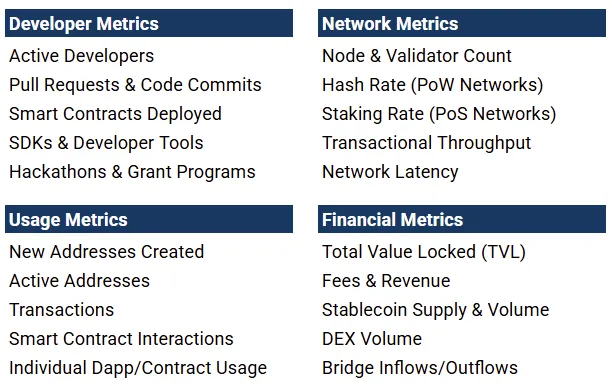
From a macro perspective, the comparison of blockchains (more specifically, smart contract networks) can be broadly divided into four categories of data: developer metrics, network metrics, usage metrics, and financial metrics. Table 1 below lists examples of each category (not exhaustive), highlighting the necessity of tracking multiple indicators simultaneously.
Table 1 Blockchain Metrics (Non-Comprehensive List)
Improving Cross-Chain Comparison Efficiency with Combined Metrics
One way to improve cross-chain comparison efficiency is to combine multiple data points, such as constructing ratios or composite indices. To demonstrate how to build such combined metrics, this article selects several currently popular financial data points denominated in US dollars:
● TVL (Total Value Locked, also known as Total Value Secured)
● Fees
● Stablecoin Market Cap
● DEX Volume
● Net Bridge Flows (Assets entering the bridge minus assets exiting the bridge)
Important Disclaimer:
Any combined metric is essentially an abstraction and should only be used with a full understanding of its purpose and limitations. The purpose of "merging five indicators into one" here is not to replace tracking individual indicators, but to quickly detect significant fluctuations in the network's "economic pulse" and relative share, eliminating the need to constantly check raw data. Specific limitations will be detailed in the last section.
Method and Results
Given the daily volatility of these indicators, it is advisable to extend the time window when comparing and simultaneously examine absolute values and growth rates. The window length depends on the research objective: tracking long-term trends or focusing on short-term changes. This article focuses on the short-term, therefore:
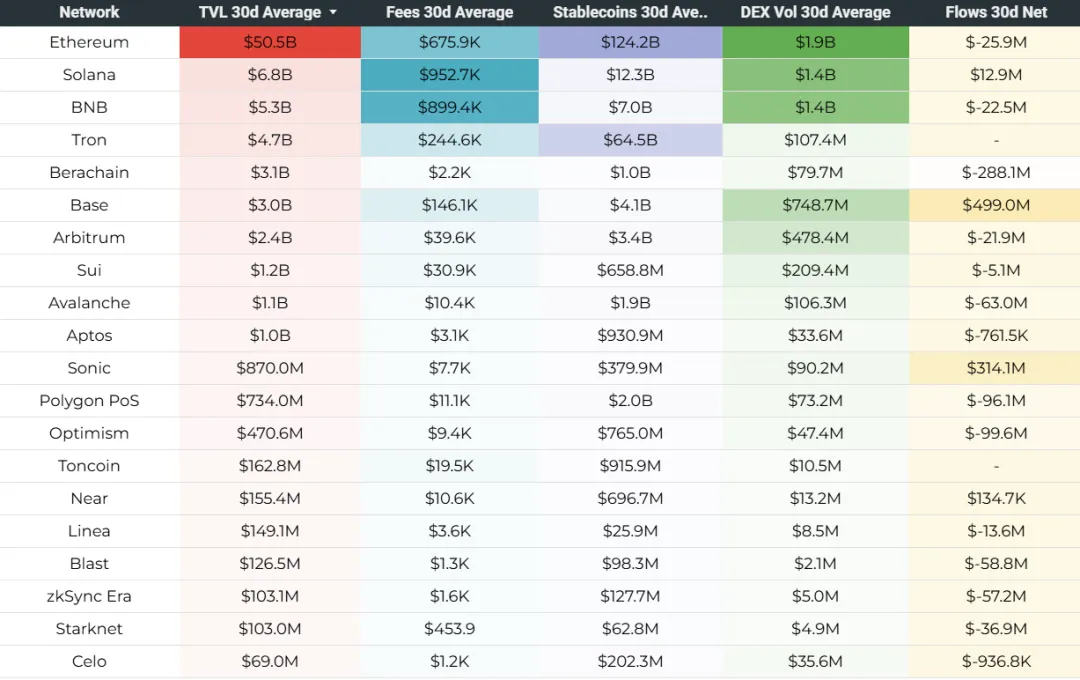
● Table 2 provides 30-day averages (first four indicators) and 30-day net cross-chain bridge flow as of 2025-04-07.
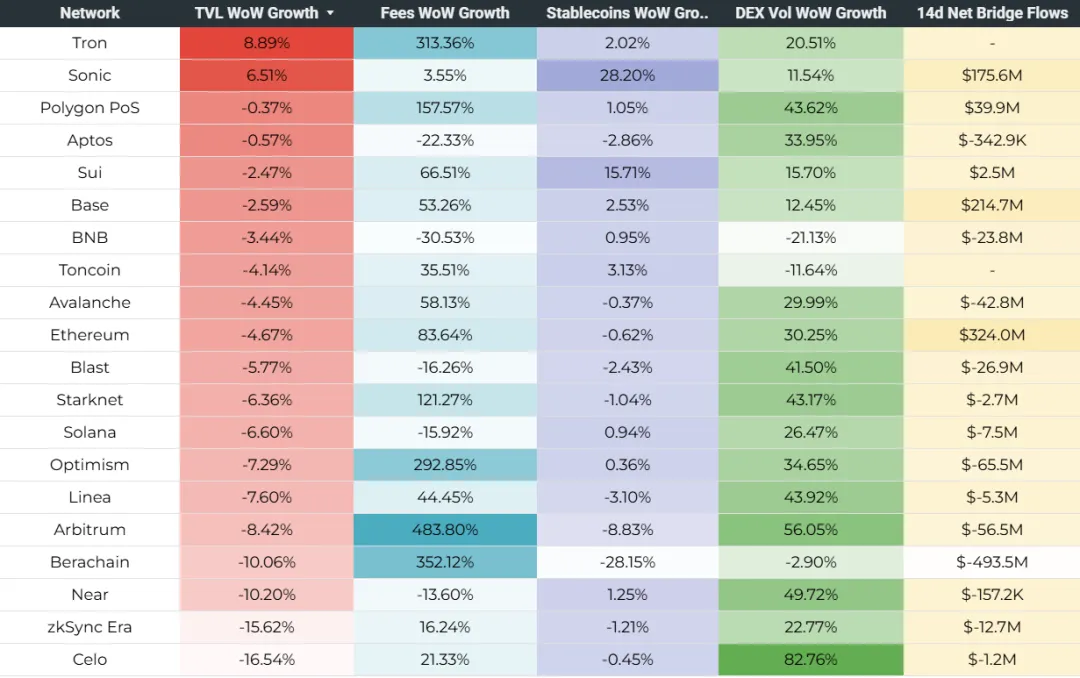
● Table 3 shows week-on-week (WoW) growth rates: 7-day averages for the first four items, 14-day net flow for cross-chain bridges.
● Data sources are daily snapshots from Artemis or defillama.
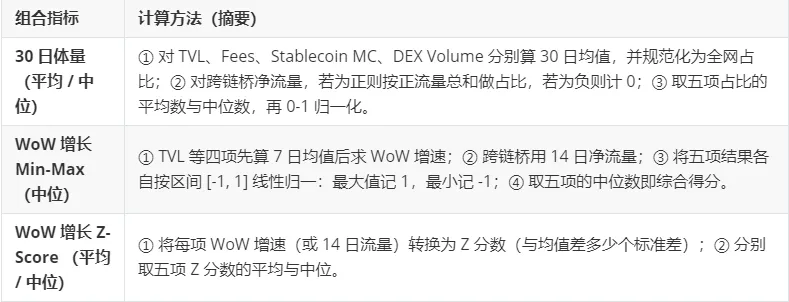
Constructing Composite Scores
To easily determine the relative positions of various networks in terms of 30-day "size" and week-on-week growth, this article converts the five data points into three composite scores; using the dates 2025-01-13 and 2025-04-07 as examples, showing that the "size" ranking remains relatively stable while WoW growth is more volatile.
Tables 4 and 5 display the composite scores on these two dates.
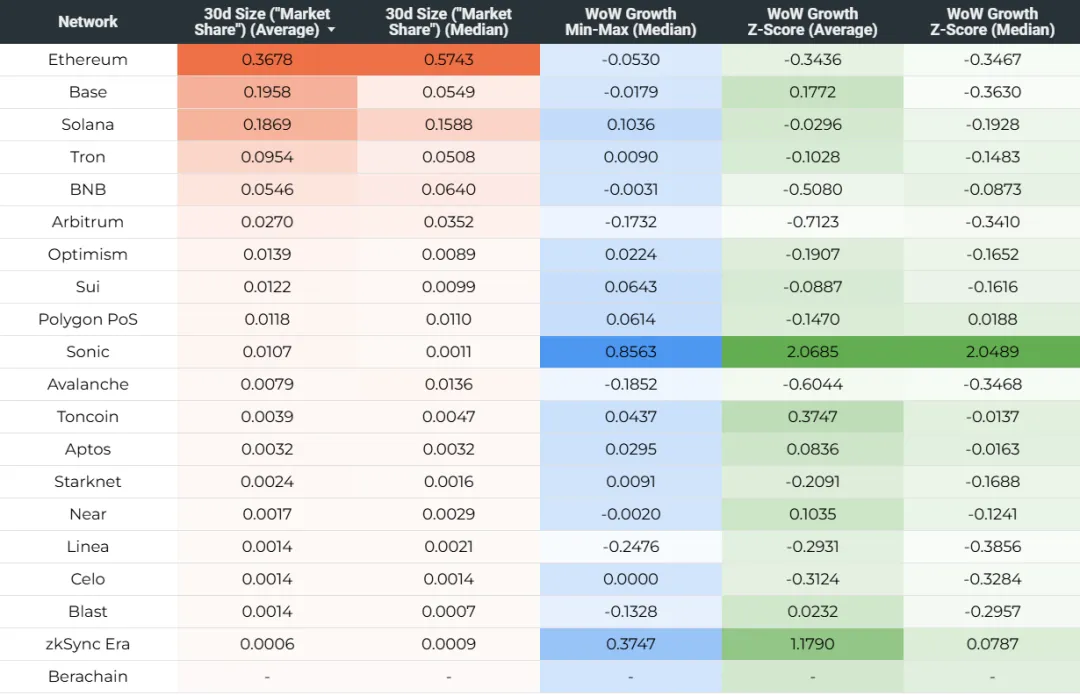
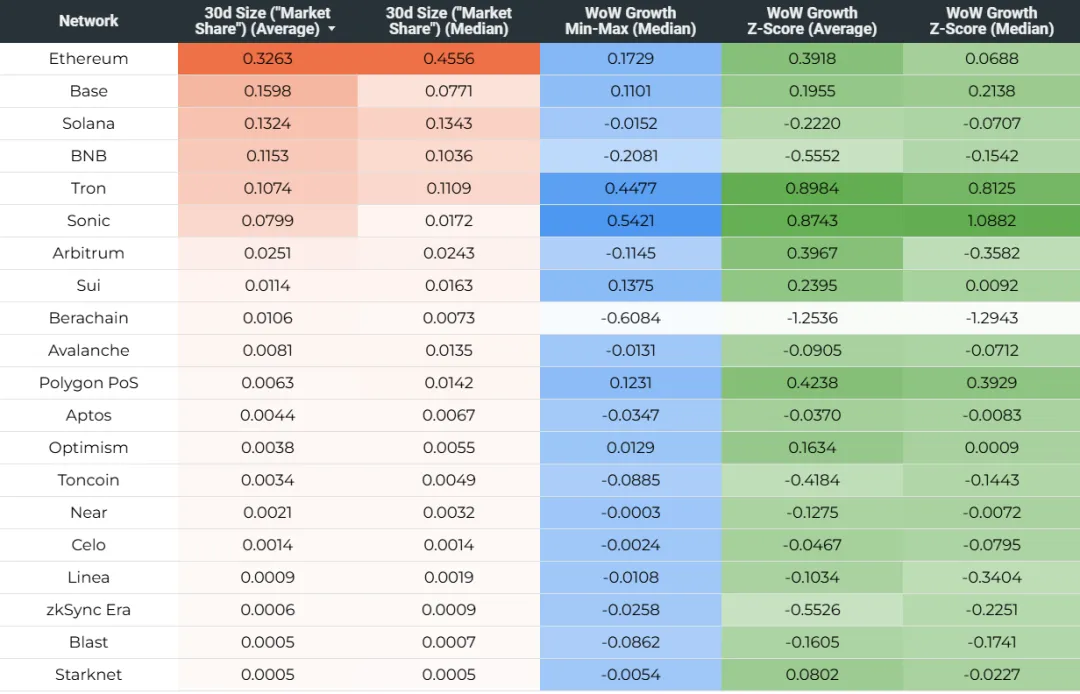
How to Interpret These Scores
30-Day Size
● By definition, equivalent to the "average market share" of each network in the five indicators combined.
○ Score 1 → 100% share in all five indicators;
○ Score 0 → 0% in all five indicators.
● For the first four indicators like TVL and stablecoin market cap, Ethereum, Solana, Base, BNB, Tron typically account for over 90% combined;
● Net bridge flows are highly volatile: mainstream chains often experience net outflows, while emerging chains (like Berachain, Sonic) can achieve net inflows through incentives, thus raising their 30-day size score.
● Need to pay attention to native token prices of the chain: Although not directly included in the calculation, almost all indicators (TVL, Fees, etc.) are highly sensitive to token prices. If a chain's token significantly outperforms or underperforms, it will amplify or reduce its score.
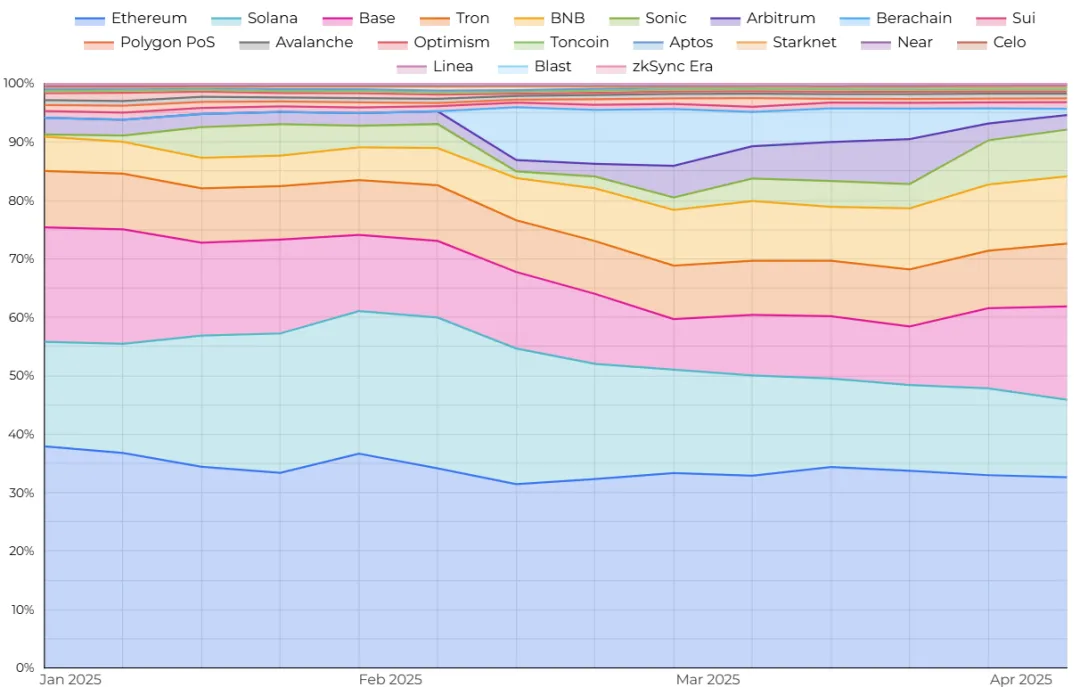
Through weekly snapshots, the 30-day size score curve over time can be depicted (below). For example, in Q1 2025, the average share of the top three chains slightly decreased, affected by overall market cooling and factors such as BNB's share increase and initial bursts from Sonic and Berachain.
WoW Growth
● Min-Max Median Score: Quickly identify which chain shows mostly positive growth (expansion) or negative growth (contraction).
○ Score 1 → Mostly first place in five indicators;
○ Score -1 → Mostly last place;
○ Positive value ⇒ Overall expansion; Negative value ⇒ Overall contraction.
○ Drawback: Cannot reflect distribution and variance.
● Z-Score Average / Median:
○ The further from 0, the greater the average over/underperformance;
○ Usually |Z| > 1 indicates outstanding or poor performance, |Z| > 1.5 is significant.
○ Often dominated by a single extreme value (mostly cross-chain bridge flow).
Limitations and Future Improvements
1. Equal Weight Assumption: Currently, the five indicators have equal weights, but their actual importance may differ, which could be considered for weighting.
2. High Short-Term Volatility: Week-on-week changes are significantly affected by base effects, short-term market conditions, or token prices, making it difficult to represent long-term health. Multiple week sequences or extended windows could be compared.
3. Limited Sample Chains: Only networks with good data source coverage are included. Adding more chains would dilute the scores overall. The ideal approach is to cover all major smart contract platforms.
4. Indicator Selection: Additional dollar-denominated data with low correlation to existing indicators could be added (such as stablecoin transfer volume, validator tips, inflation rewards).
5. Method Example: This article is merely a starting point, and discussions on improvement proposals are welcome, especially on how to further integrate "market share" and "growth rate" into a single indicator.


