

Pi Network (PI) has decreased by 14% in the past 30 days, with market capital falling below 5 billion USD and tokens trading under 1 USD since May 14.
Technical indicators continue to show downward momentum, with PI struggling to overcome important resistance levels. The Ichimoku Cloud, BBTrend, and EMA lines all indicate continuous weakness and lack of price increase confirmation. Unless momentum changes soon, PI may face further price decline before a significant recovery.
Pi Network Faces Strong Resistance
The Ichimoku Cloud shows Pi Network (PI) is still under strong downward pressure. Price continues to trade below the red cloud, indicating downward momentum remains dominant.
The Leading Span A (green line) remains below the Leading Span B (red line), reinforcing the price decline structure ahead.
The wide and declining cloud suggests any potential reversal may encounter significant resistance early.
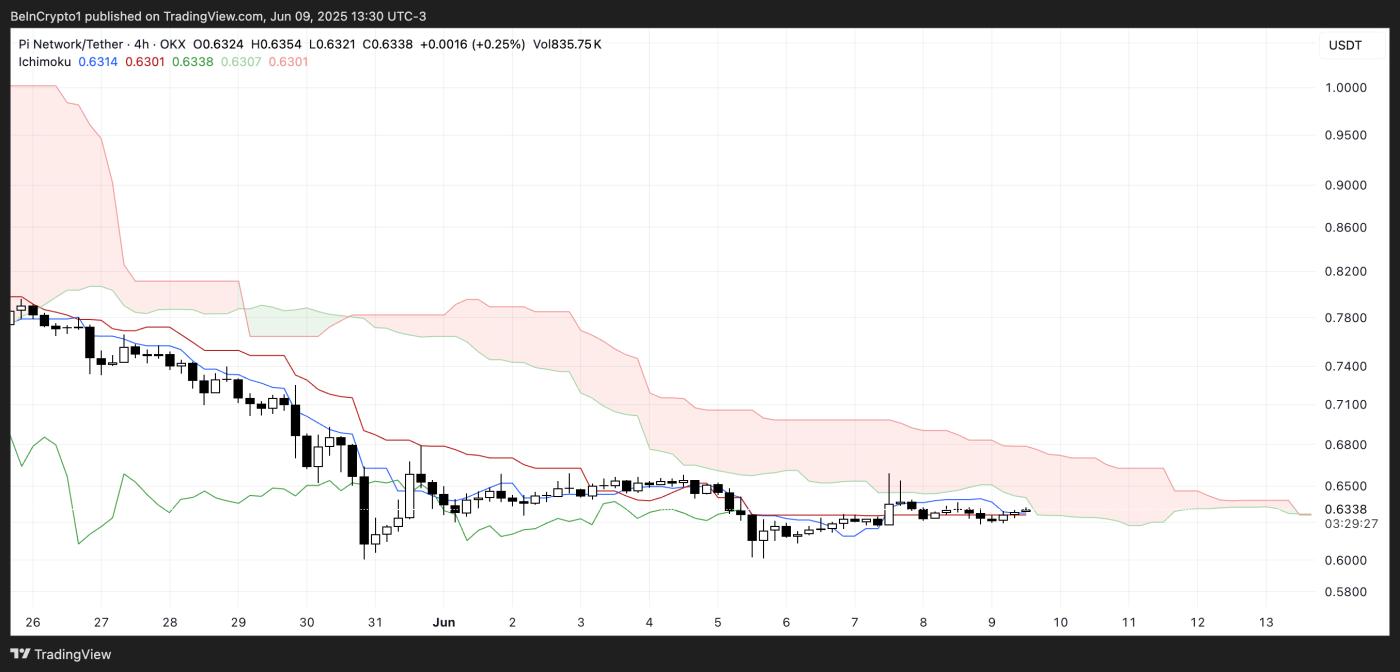 PI Ichimoku Cloud. Source: TradingView.
The Tenkan-sen (green line) is flat and hovering near the Kijun-sen (red line), indicating weak short-term momentum and market hesitation.
Additionally, price candles are compressed in a narrow range, showing consolidation without a clear breakout.
The trend remains negative until price moves decisively above the cloud and lines turn bullish.
PI BBTrend Stable, But Decline Conditions Persist
Pi Network continues to show weak momentum, with the BBTrend indicator at -2.21, almost unchanged in the past two and a half days.
This indicator has maintained a negative zone for the past 14 days, with a sharp decline peak of -18.7 recorded a week ago.
Despite recent stability suggesting the downward trend might be losing strength, PI has not shown signs of a significant bullish reversal.
 PI BBTrend. Source: TradingView.
BBTrend (Bollinger Band Trend) measures price strength and direction relative to Bollinger Bands.
Positive values indicate upward momentum when price pushes to the upper band, while negative values indicate decline conditions with price near the lower band.
PI's current BBTrend at -2.21 reflects a mild decline—less extreme than before, but still lacking upward pressure. The indicator needs to cross into the positive zone and maintain it to change market sentiment.
PI Breakout Could Trigger 37% Increase
PI price remains in a technical decline structure, with EMA lines showing short-term average below long-term average.
This arrangement confirms the continuation of the decline unless momentum changes significantly.
If downward pressure increases, PI may retest important support levels, and a breakout would mark the first time the asset falls below a critical historical threshold—increasing downside risk.
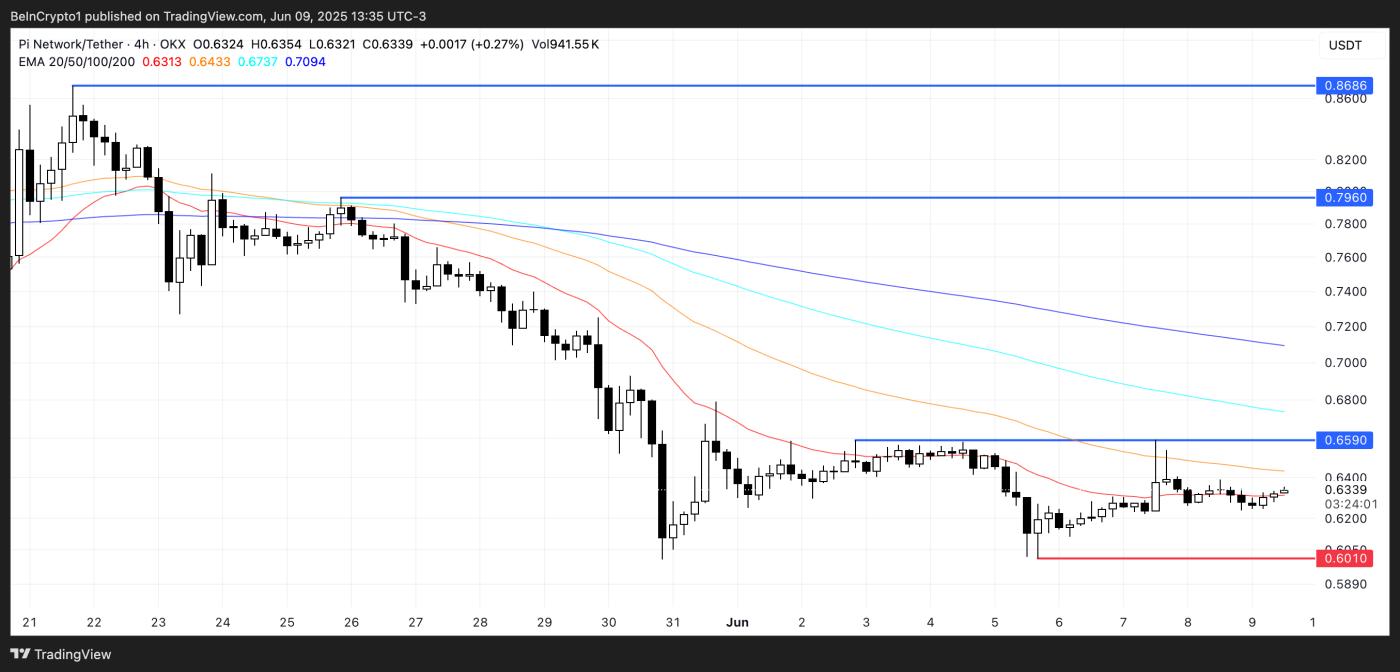 PI Price Analysis. Source: TradingView.
However, if buying pressure increases, PI may test resistance at the next important EMA zone.
A successful breakout above that level, supported by strong momentum, could open up broader recovery opportunities.
In a bullish scenario, PI could climb to higher resistance targets, providing potential price increases over 35%.


