July was a tough month for Pi Coin (PI). But why stop there? Over the past year, this token has lost more than 60% of its value. Most traders have cut off their interest. However, something changed in the first week of August.
PI rebounded by 4.6% from its all-time low. For the first time since July 30th, two short-term upward movements appeared, suggesting a potential emotional shift.
First Bull Stretch in August
The first notable signal came from the 4-hour bullish-bearish power chart. A green bar flickered after more than 40 sessions. This is significant. The last time strength was registered on this chart was in July, after which sellers completely dominated. The green bar indicates that buying pressure briefly exceeded selling pressure for the first time in weeks.
Token Technical Analysis and Market Update: Want more of such token insights? Subscribe to editor Harshi Notariya's daily crypto newsletter here.
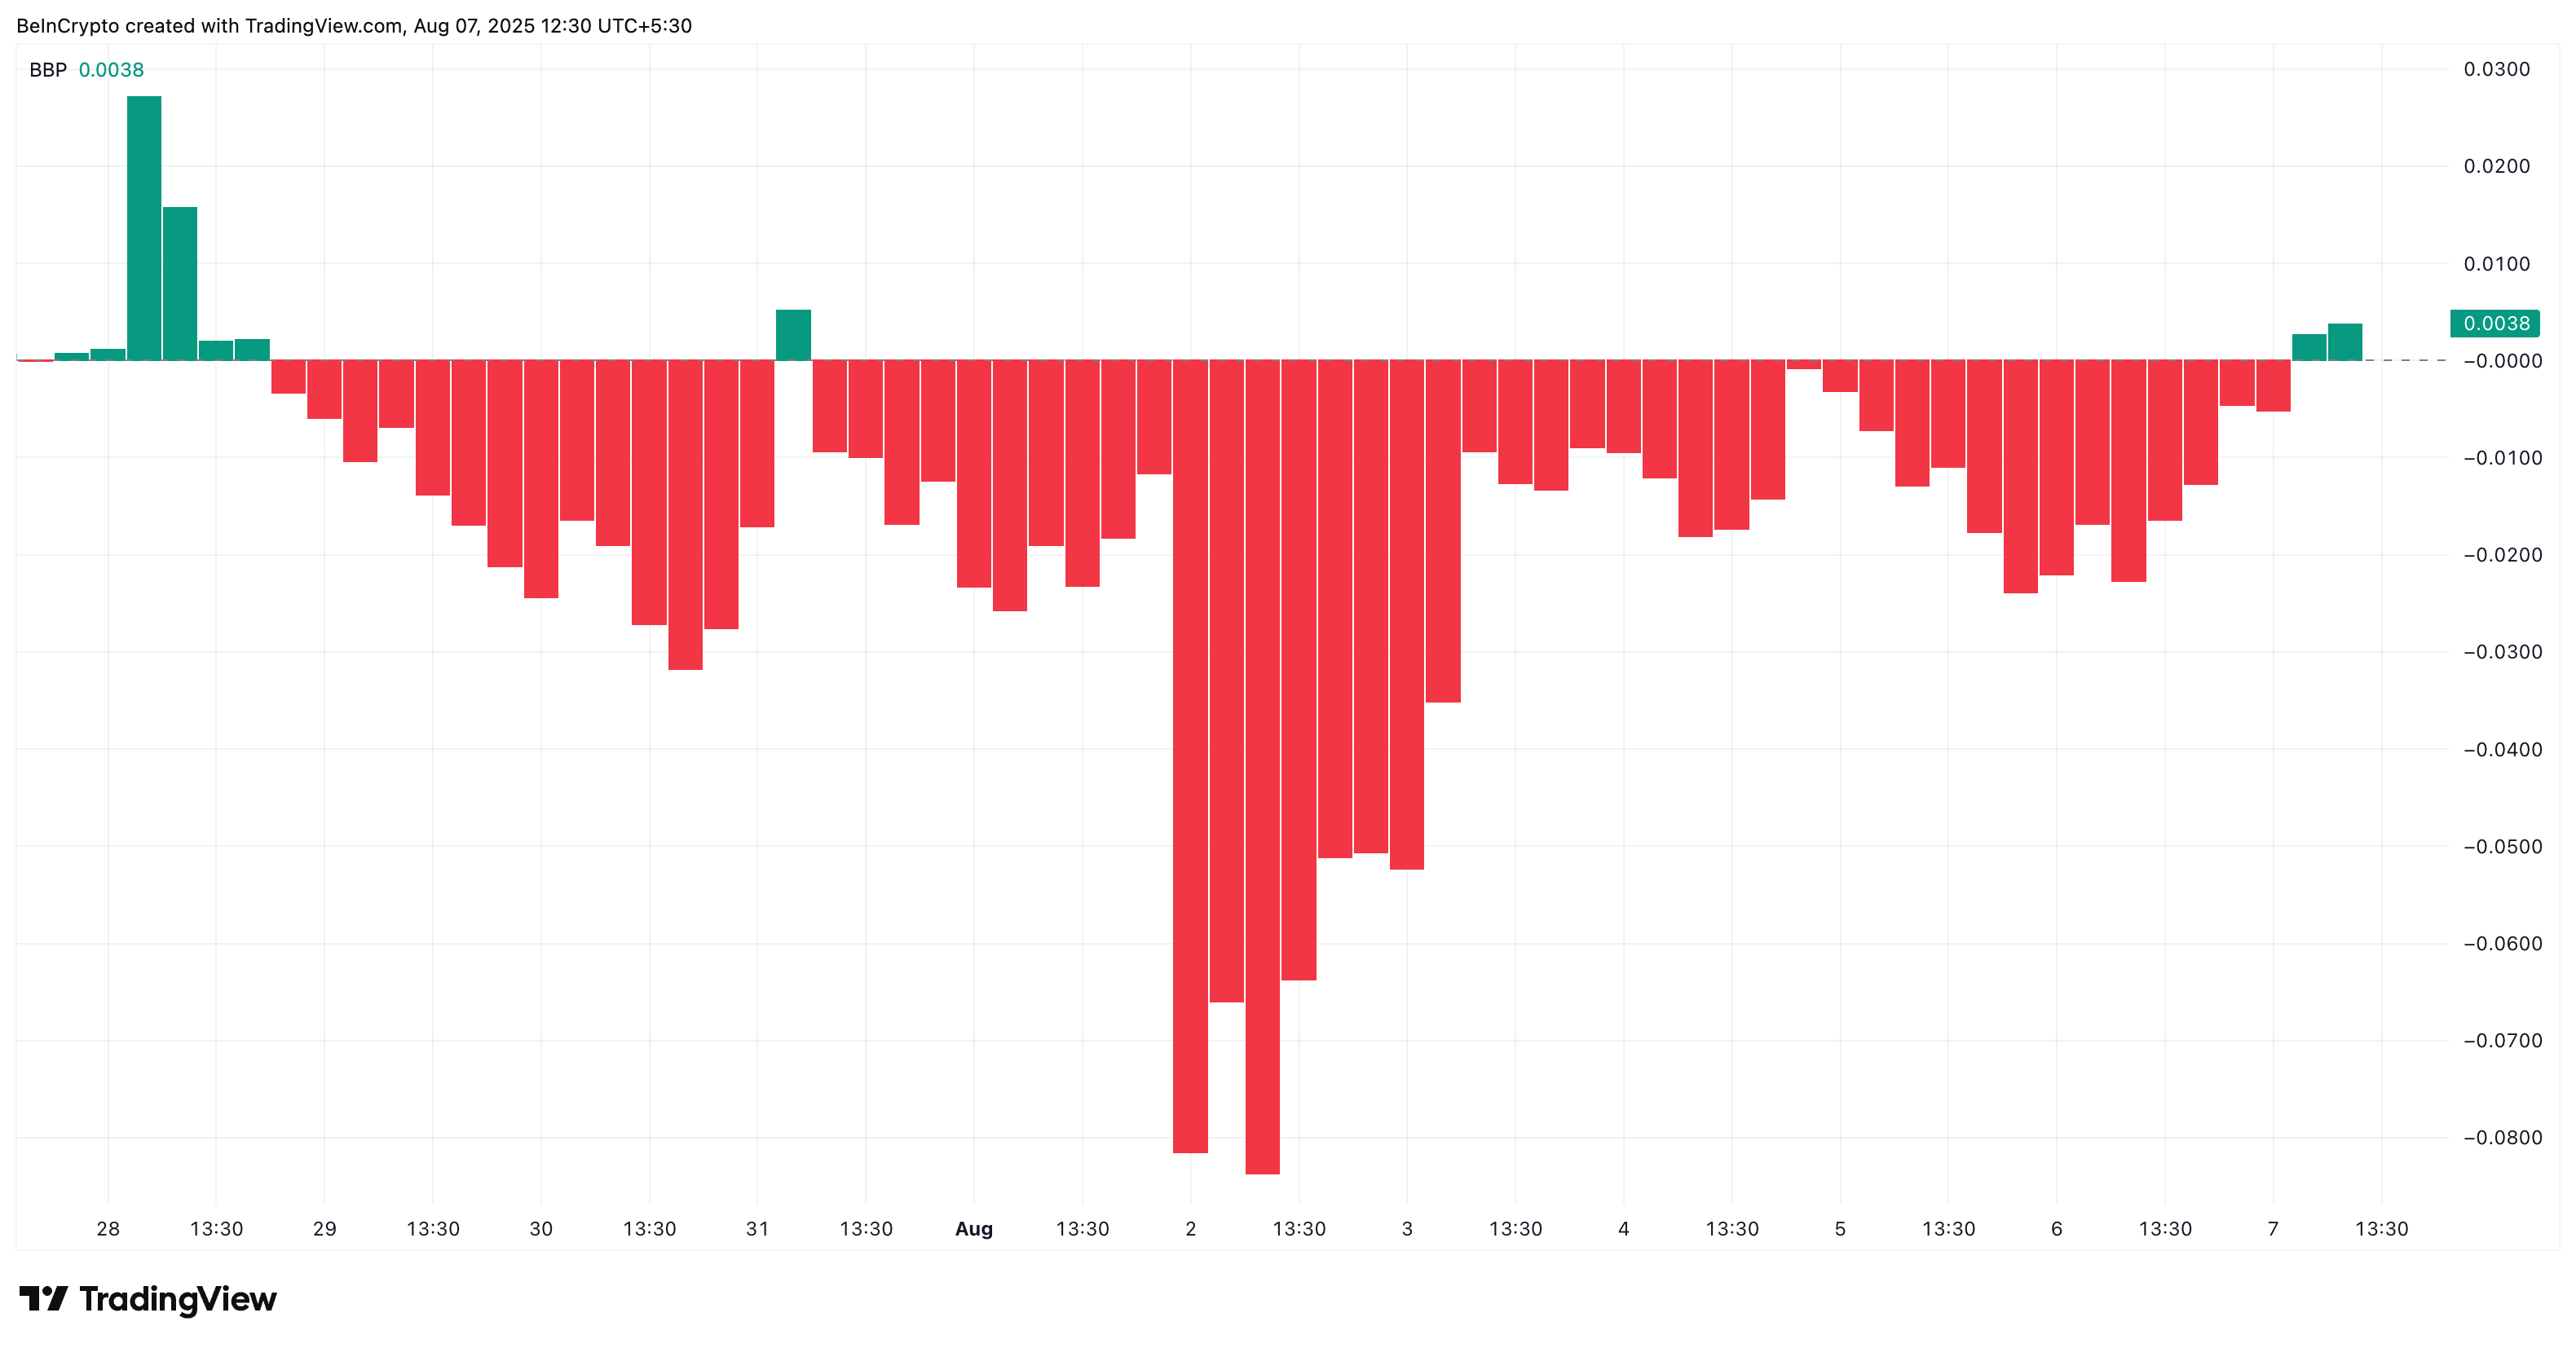
The bullish-bearish power index tracks the difference between intraday highs and lows relative to the moving average. When a green bar appears, it indicates an attempt by bulls to take control, which is often a subtle but initial accumulation signal.
2-Hour Chart, PI Coin Trend Reversal EMA Crossover
While the 4-hour chart showed the first signs of buying pressure with lack of directional clarity, we switch to the 2-hour chart to capture initial trend change and momentum increase. This might be blurred in larger time frames.
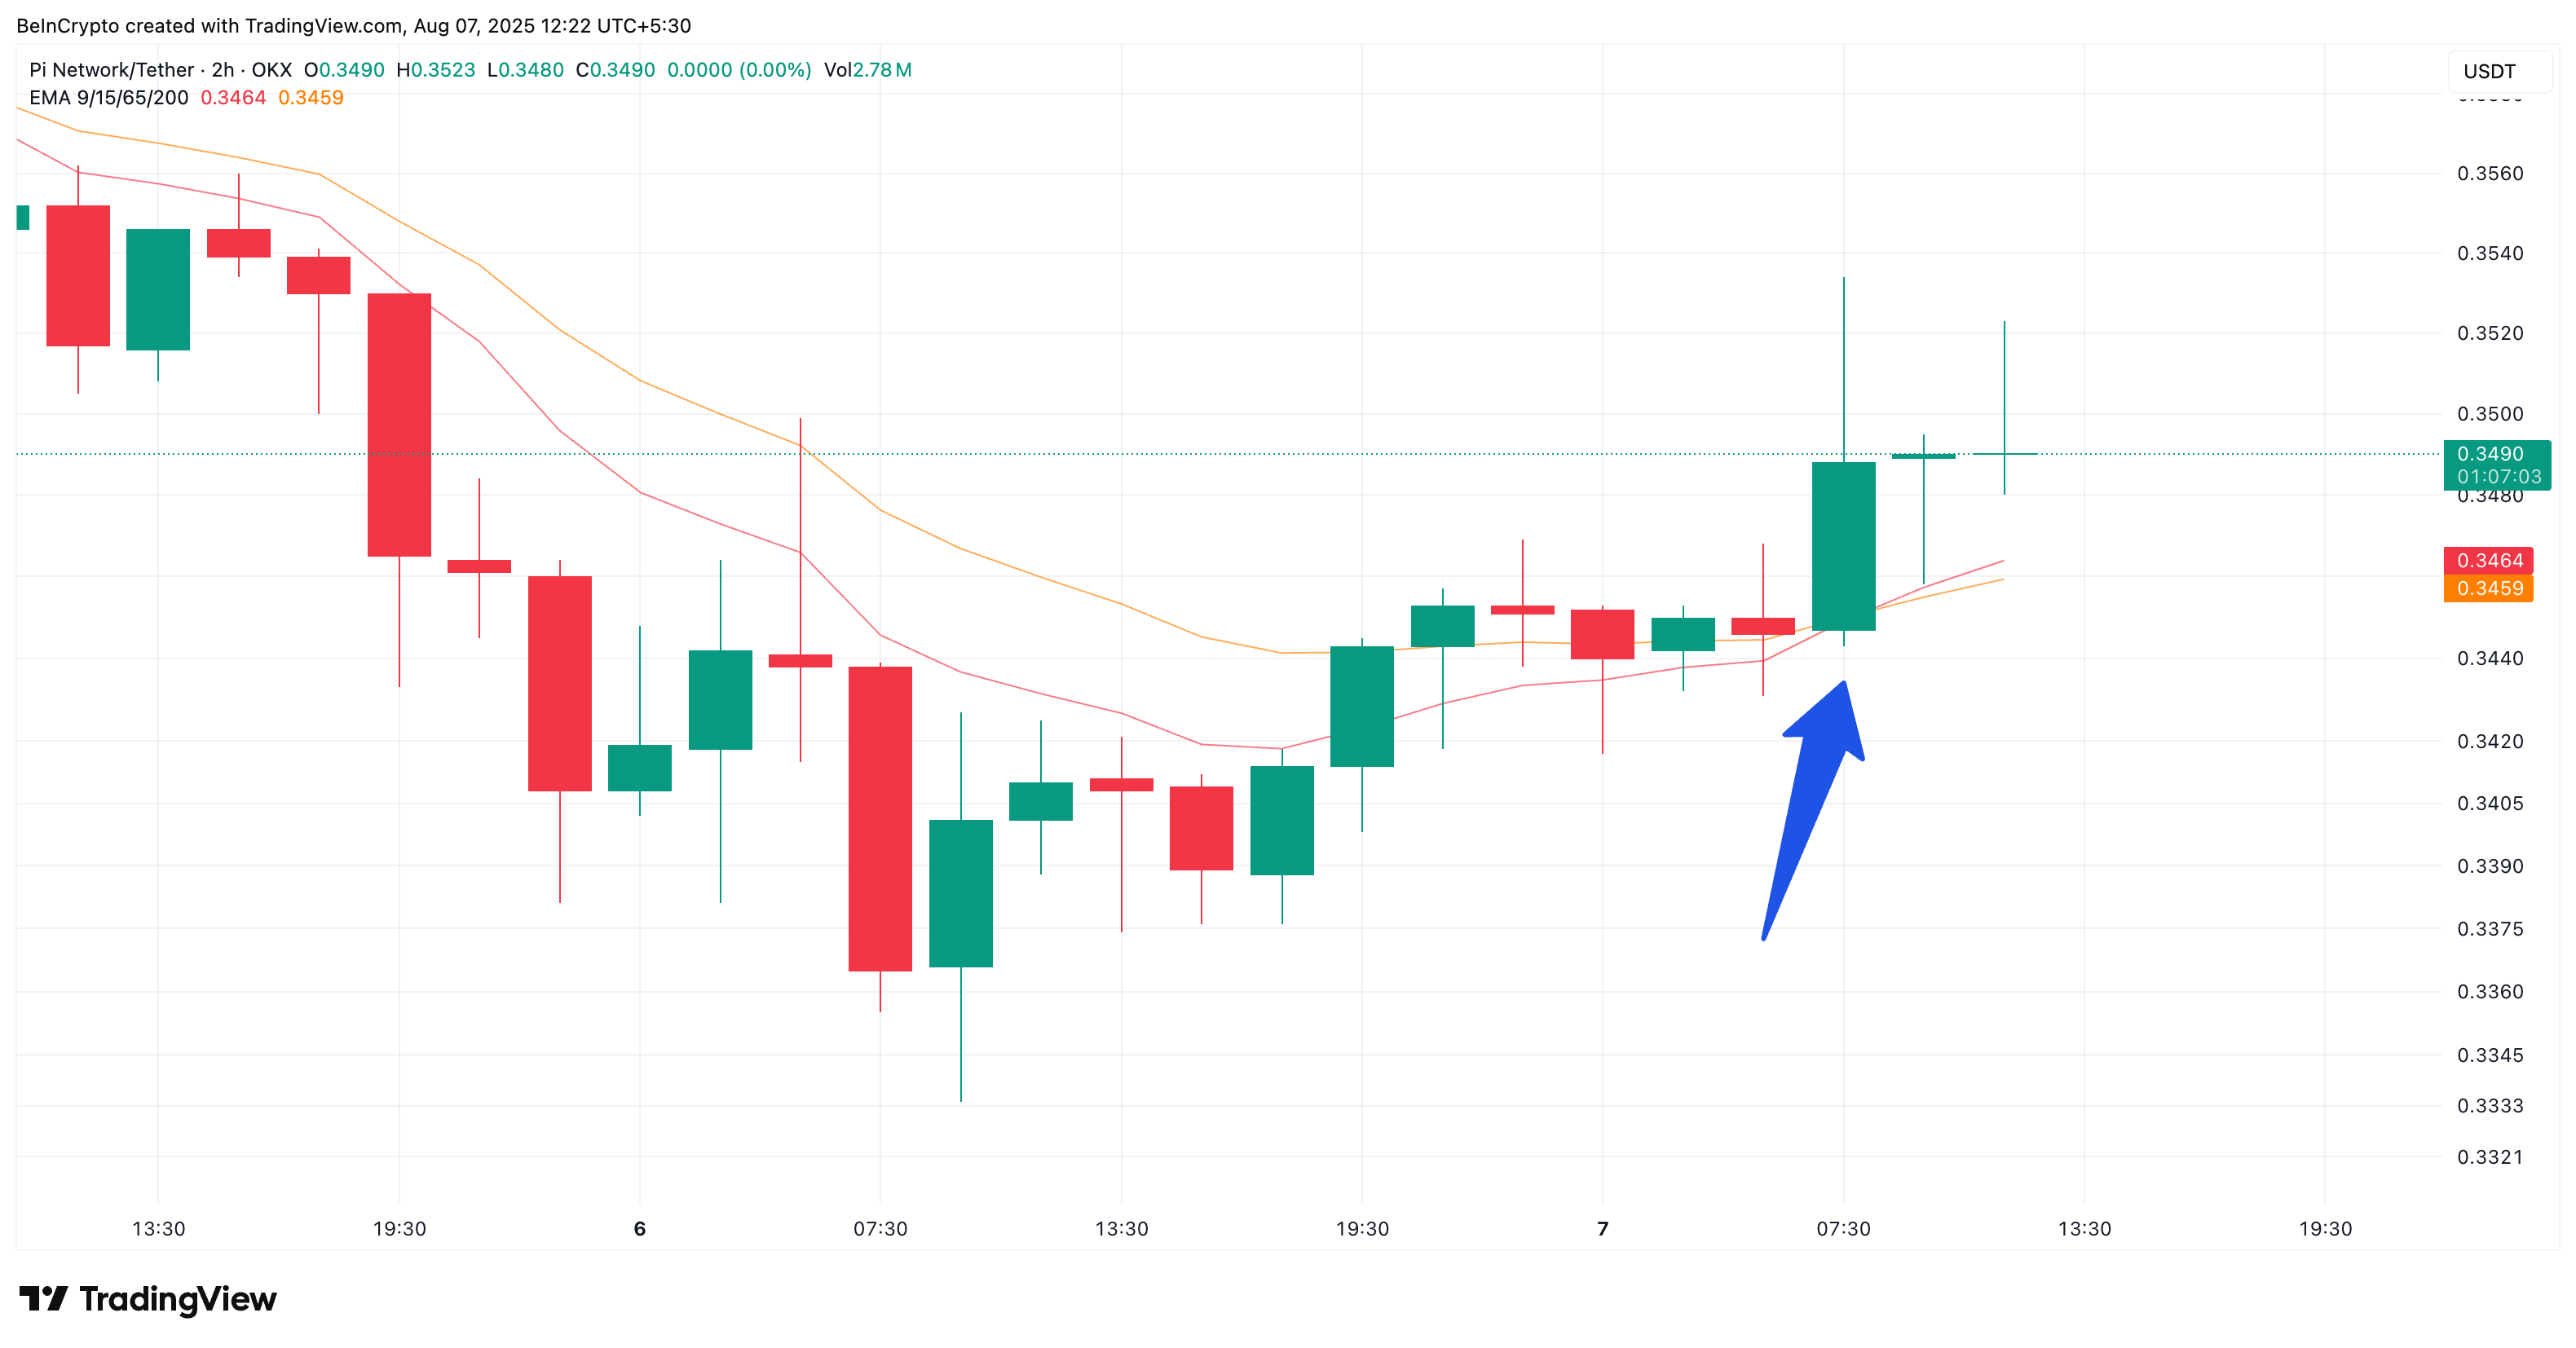
A 9/15 period Exponential Moving Average (EMA) crossover just occurred in this lower time frame. The faster-moving 9-EMA (red line) crossed above the slower 15-EMA (orange line). This suggests buyers are beginning to take control of short-term price action for the first time in August. The 9/15 EMA is often used to identify initial momentum changes before appearing in higher time frames. This crossover is a relevant bullish signal.
Compared to the more commonly used 20/50 period EMA, the 9/15 crossover responds more quickly to smaller price movements. This makes it more effective at capturing momentum changes before becoming apparent in longer time frames. However, while providing faster signals, it is more sensitive to noise, so price structure and volume confirmation remain essential.
PI Coin Price, Flag Pattern and Key Breakout Levels
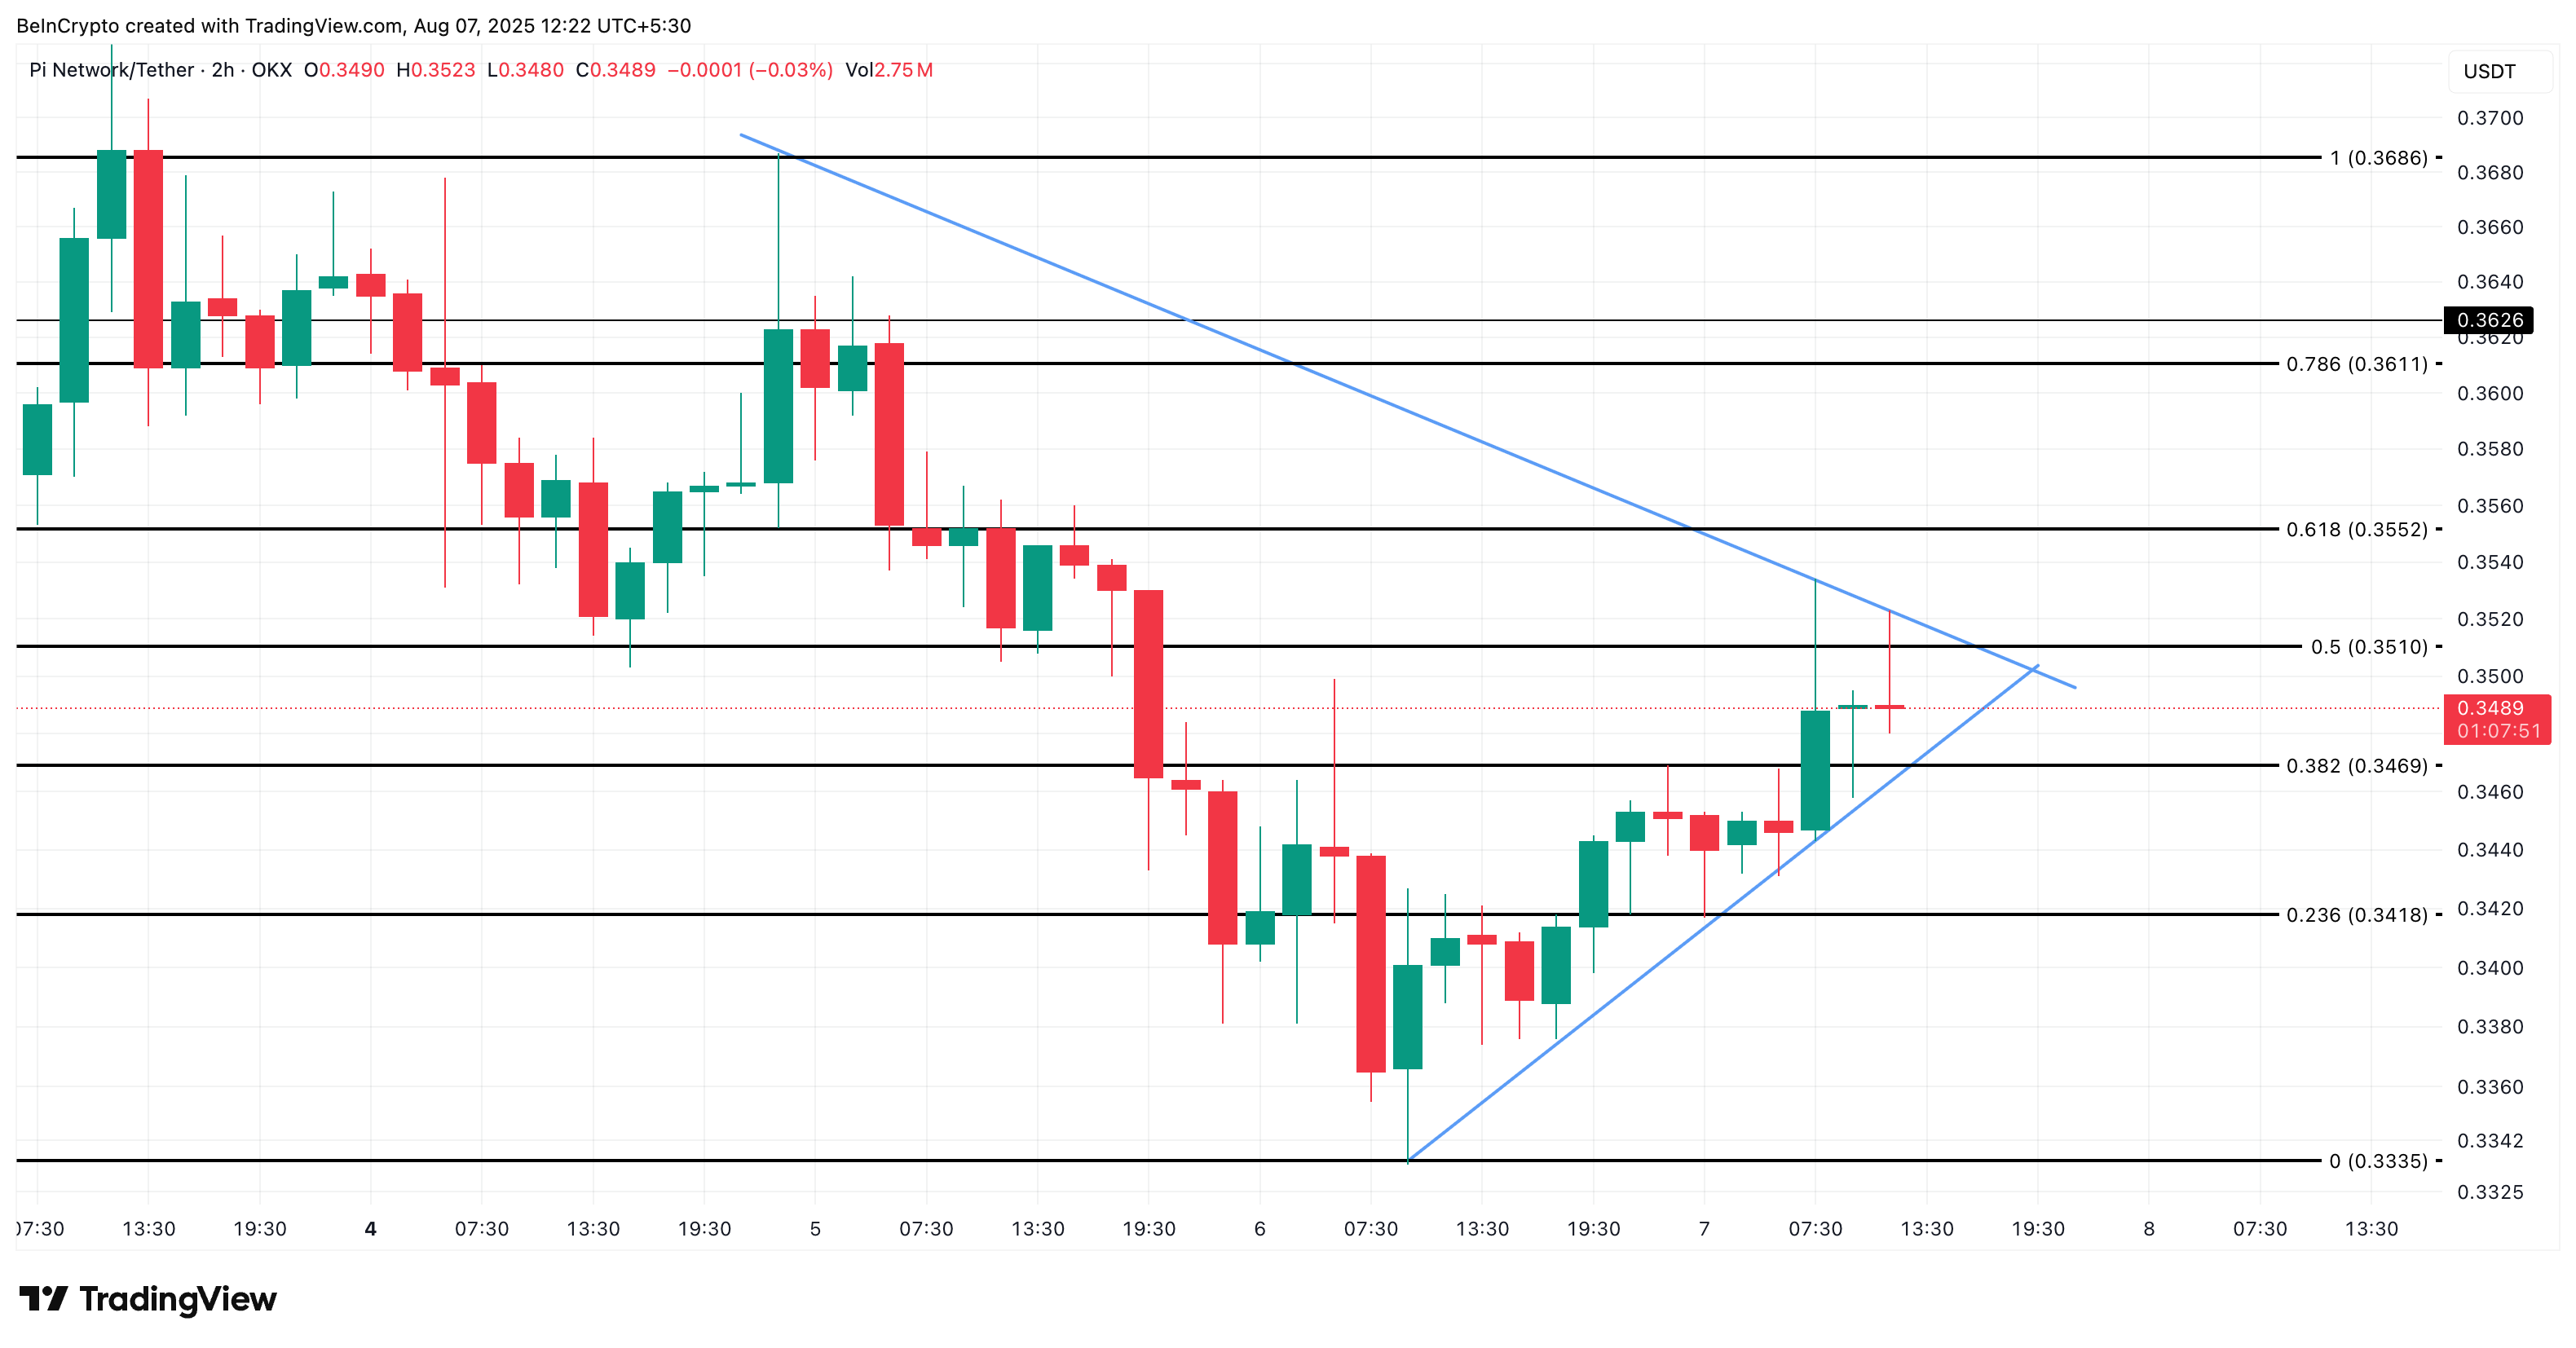
On the same 2-hour chart, PI price is confronting the upper trend line of a bullish flag. It is consolidating near $0.35. A clean candle close above that level could unlock a short upward movement with a short-term target near $0.36.
Daily Pi Coin price chart confirms these levels as a major resistance zone. The $0.36 mark aligns with the upper boundary of previous rejection, with the next level at $0.39.
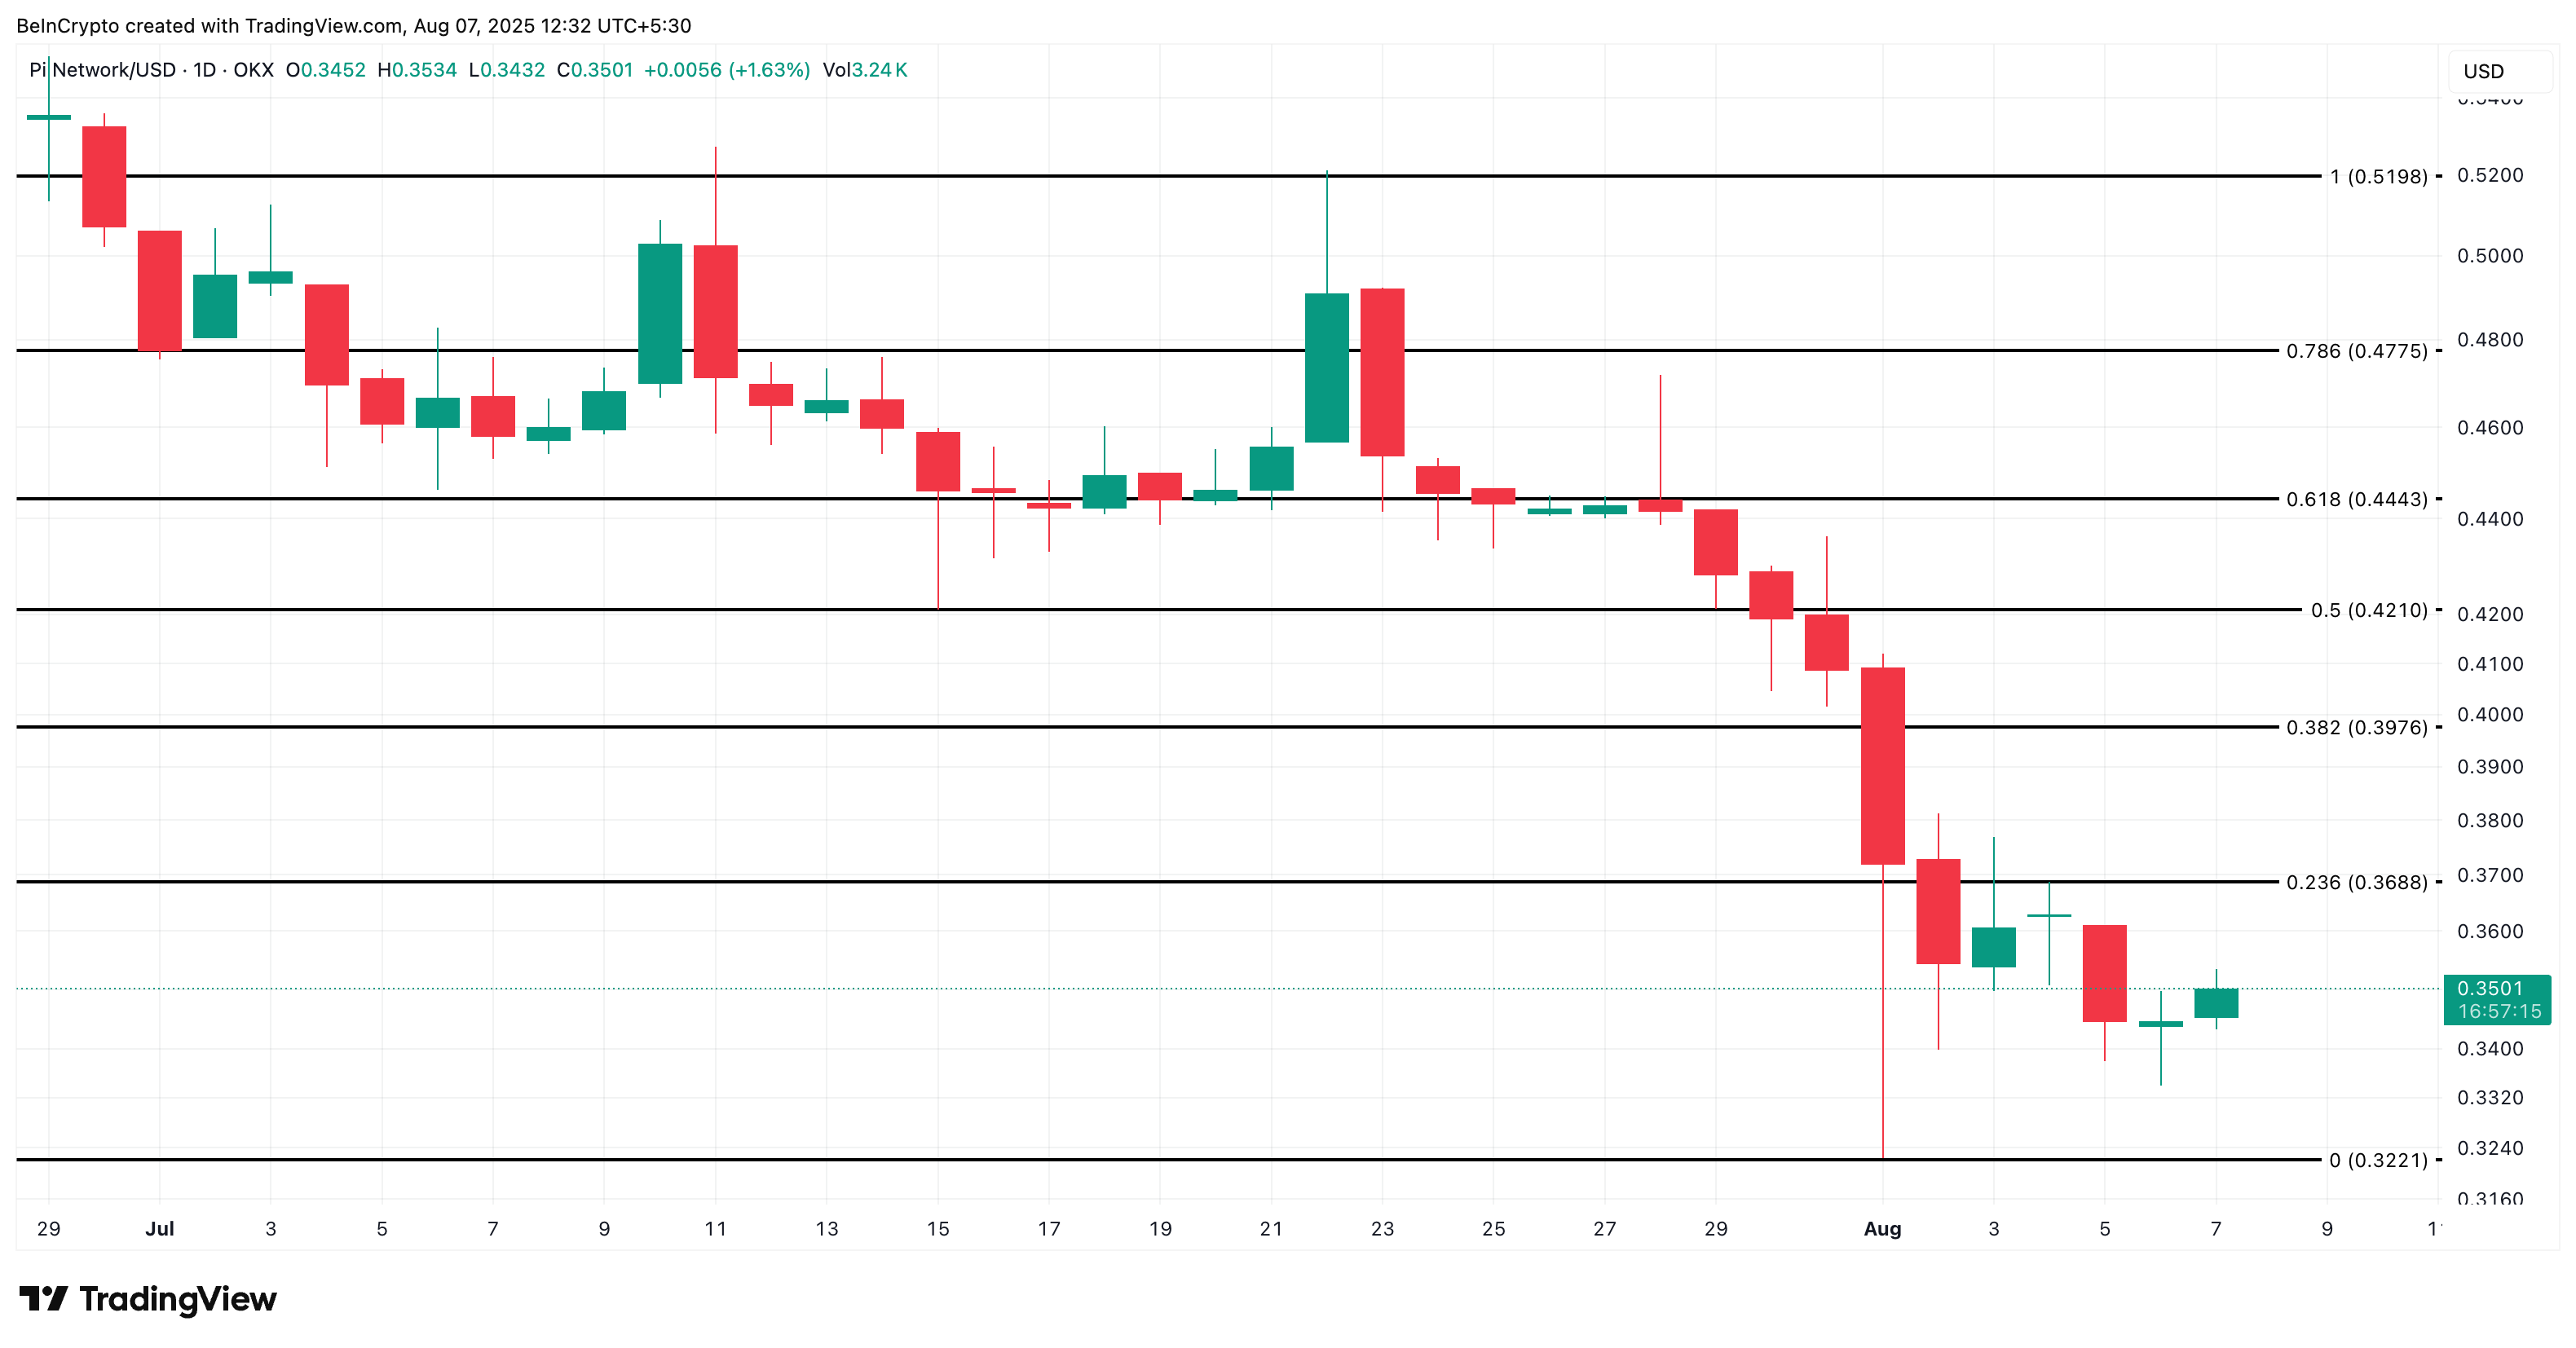
PI price invalidation is near $0.32. If that level breaks, the current pattern would fail, and a new low would be expected.