Pi Coin price has increased with the overall market trend, rising nearly 15% in the past 7 days; a pace that traders have not seen in over a month.
August started with strong signs, and currently, three important technical indicators are pointing in the same upward direction. When multiple signals appear simultaneously, the likelihood of a strong movement increases, but only with continued momentum.
ADX increase shows Pi Coin's trend is strengthening
Average Directional Index (ADX) measures the strength of a trend, not whether it is increasing or decreasing. A low index means the market is declining; a rising index indicates momentum is being built.
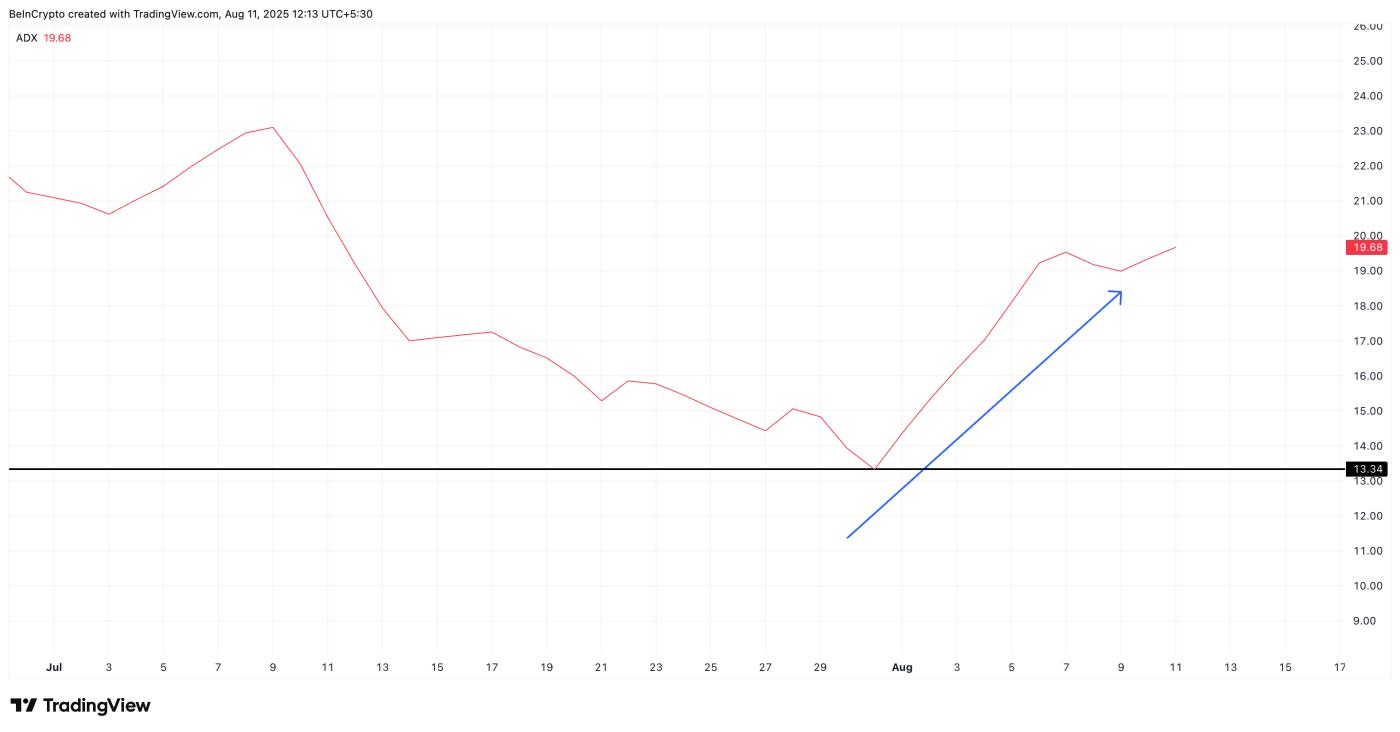 PI price and rising momentum: TradingView
For Pi Coin price, ADX was near 13.3 on 31/07/2025, considered a weak trend. Currently, it has risen to 19.6, indicating the current upward trend is beginning to gain real attraction.
ADX strengthening in a price uptrend means buyers are pushing more, and the market is committing more volume to this movement. This makes the next resistance tests of Pi Coin more meaningful.
For TA and token market updates: Want more detailed information about such tokens? Subscribe to the Daily Crypto Newsletter by Editor Harsh Notariya here.
Daily RSI price divergence shows small investors are quietly creating buying pressure
Relative Strength Index (RSI) measures whether an asset is overbought or oversold by tracking the speed and size of price changes. A price divergence occurs when price creates lower peaks, but RSI creates higher peaks, indicating buying pressure is increasing even as price slows down.
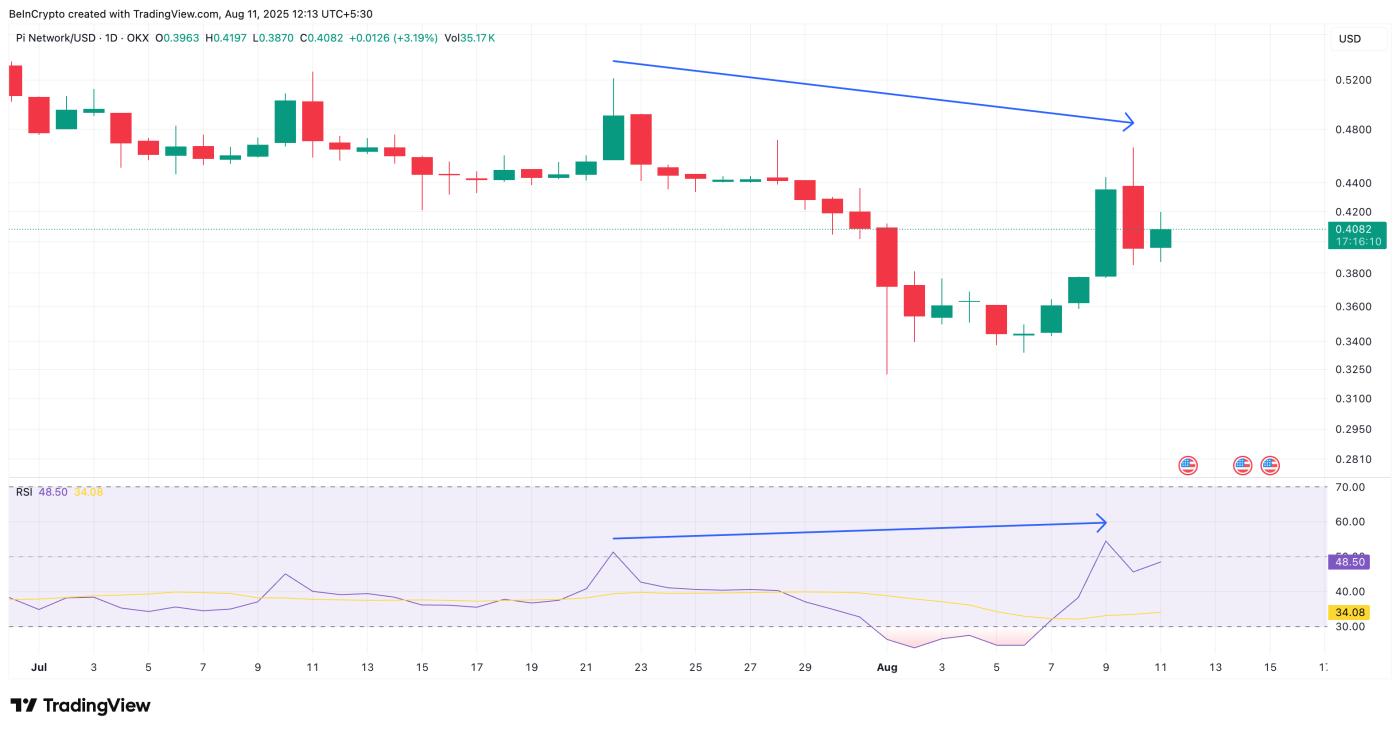 Pi Coin price and bullish RSI divergence: TradingView
For Pi Coin, on 22/07/2025, the price was around 0.52 USD with RSI at 51. By 10/08/2025, the price had dropped to 0.46 USD, but RSI increased to 54. This mismatch indicates sellers are losing control, and buyers are gradually gaining the upper hand. And this is our first bullish indicator.
Increasing ADX combined with bullish RSI divergence means the upward trend is not only stronger but also supported by improving momentum beneath the surface.
4-hour chart keeps Pi Coin price in an upward structure
On the 4-hour chart, Pi Coin is maintaining an ascending triangle, a continuation pattern that is our second bullish indicator. Pi Coin price remains above the 20-period exponential moving average (EMA) or red line and the 100-period EMA (blue), indicating short-term and medium-term trend strength.
But that's not all. A bullish "Golden" crossover is nearly occurring, with the 20-period EMA approaching the 100-period EMA. Although the lines have touched, all that remains is the crossover. That is our third bullish indicator.
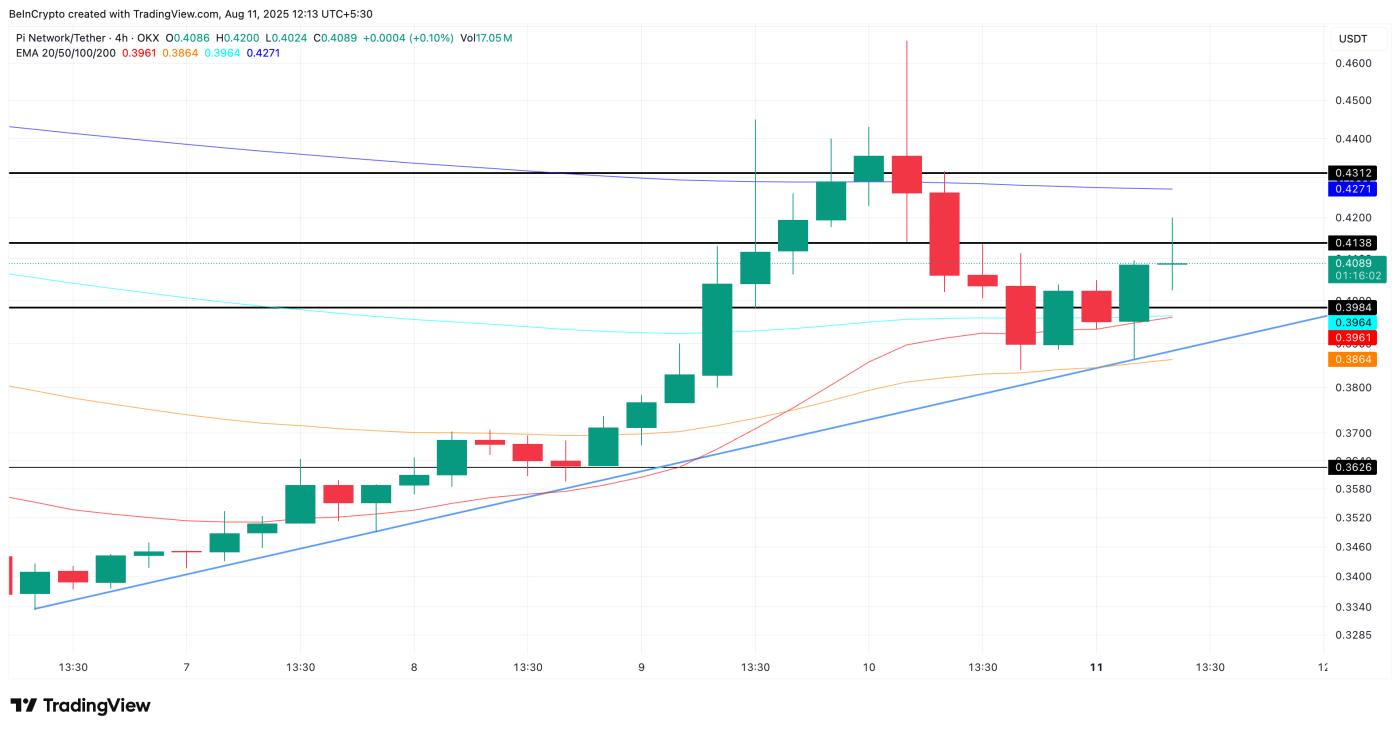 Pi Coin price analysis: TradingView
Key factors from the chart to watch when the crossover occurs:
- Bullish breakout: A move above 0.41 USD and 0.43 USD could open opportunities for a stronger surge.
- Support: 0.39 USD is the first strong floor, followed by the 20-period and 100-period EMAs.
- Bearish reversal: The structure only shifts to short-term decline if price drops below 0.38 USD (50 EMA).
If ADX continues to increase and RSI maintains bullish divergence, a breakout from this pattern becomes more feasible and could drive the "big move" traders are waiting for. However, if the price drops below 0.38 USD, the bullish prospect will be nullified.