

PUMP has dominated the conversation on Solana ’s meme coin market, rising more than 120% in a month. But after whales sold $8.26 million worth of Token in the past 24 hours, the price of PUMP has dropped about 5%.
Selling pressure is real, but the chart and flow show that the structure of the PUMP rally is still intact.
Selling pressure increases, but smart money and retail investors remain firm
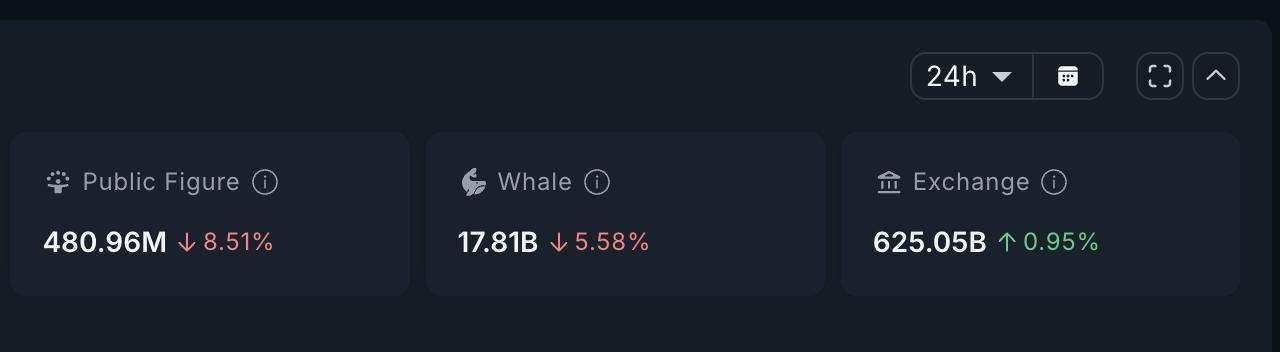
Over the past 24 hours, whales have reduced their holdings by 5.58%, leaving them with 17.81 billion Token. At the current price of $0.00775, that's about $8.26 million sold.
Exchange balances also increased by about 5.88 billion to 625.05 billion, indicating that retail investors are selling, or rather taking profits. Even celebrity wallets joined in, reducing their holdings by 8.51% to 480.96 million.
In summary, PUMP has recently experienced nearly $55 million in selling pressure as key groups sell.
 PUMP Selling Intensifies: Nansen
In theory, that explains the 5% drop. But two signals suggest the sell-off may not derail the larger rally.
Want more information on Token like this? Sign up for Editor Harsh Notariya's daily Crypto Newsletter here .
First, the smart money flows have not reversed. Wallets labeled as sharp traders are still higher than they were in early September, indicating that experienced players have not left. The recent stability in smart money flows looks similar to late August, when the PUMP went sideways before continuing to climb.
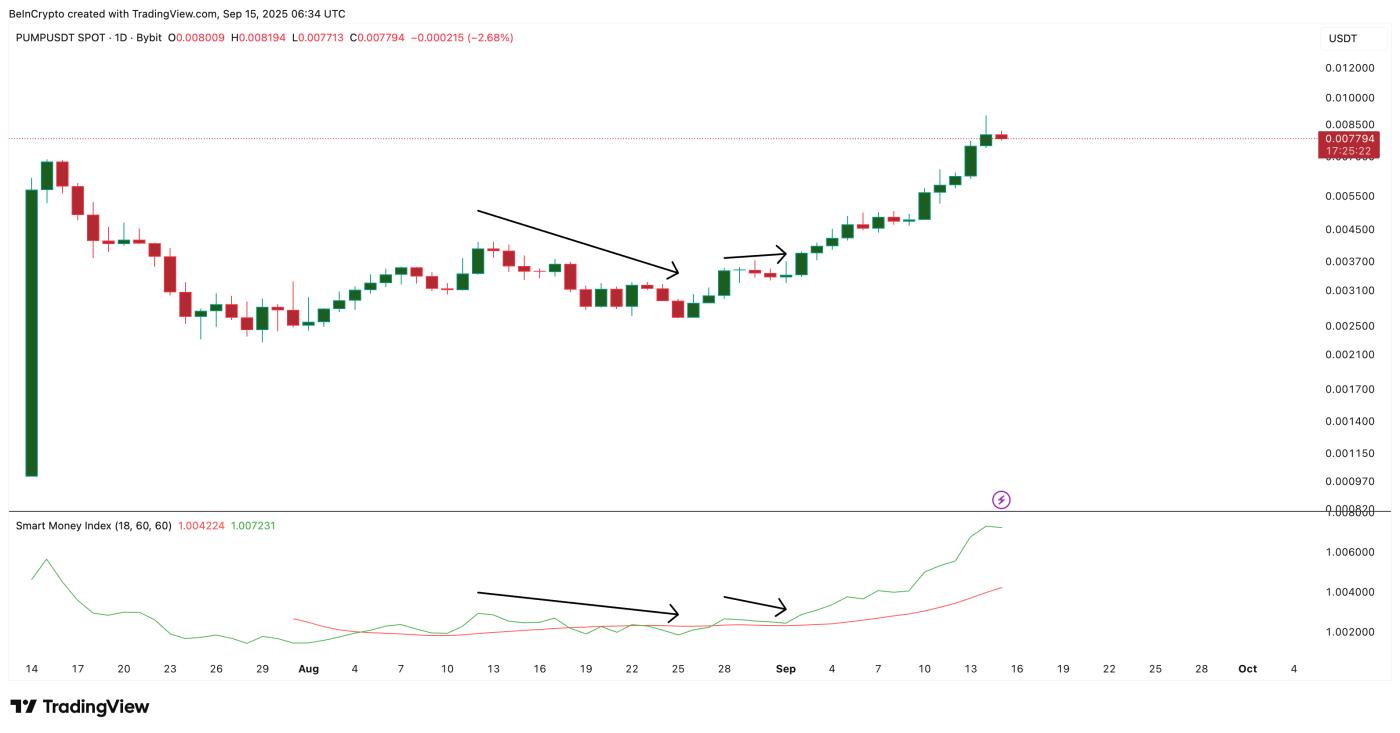 PUMP Price Gets Smart Money Boost: TradingView
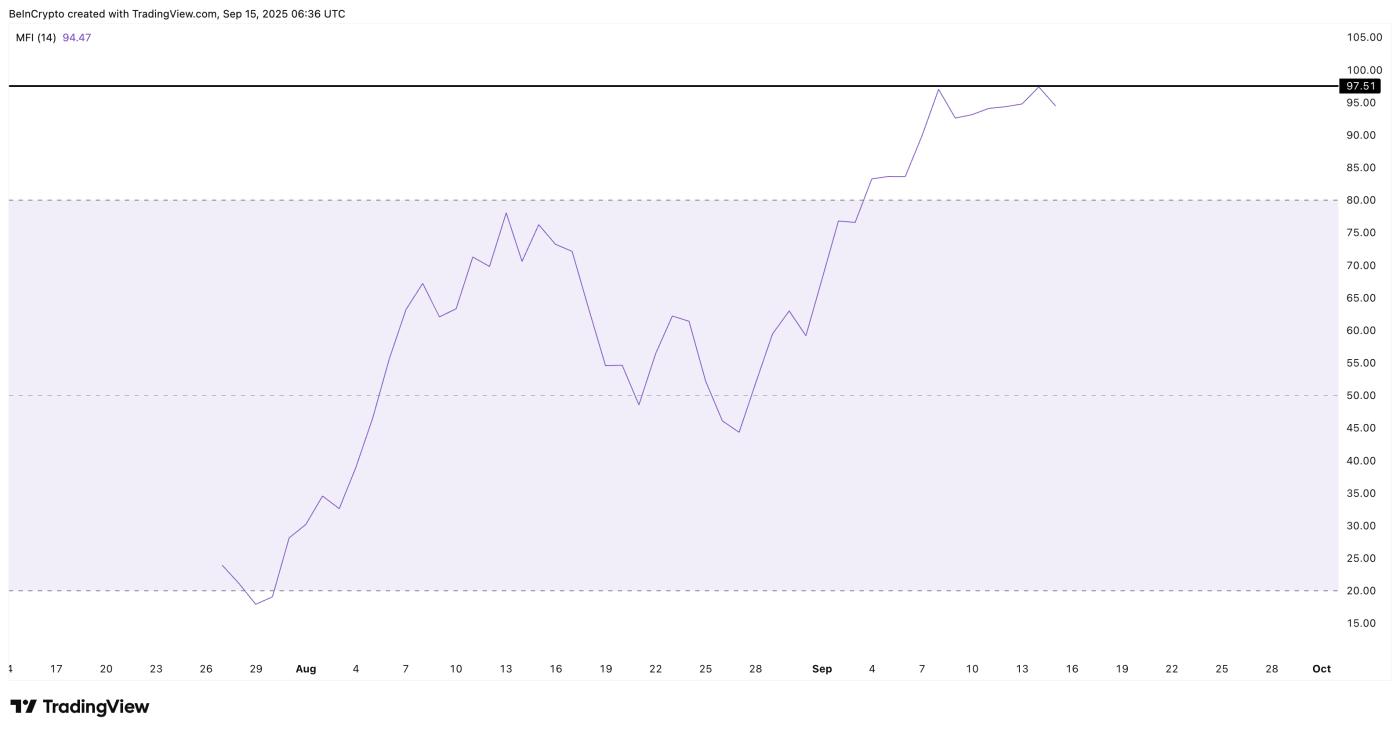
Second, retail demand remains. The Money Flow Index (MFI), which measures buying pressure by combining price and volume, hit a new high of 97.5. That was above the September 8 peak, before the 65% rally.
MFI rising even as whales sell shows that buyers are jumping in as prices fall.
 Money Flow Continues Into PUMP: TradingView
Taken together, the combination of whale selling and retail investor absorption sets the scene for a correction rather than a crash.
Channel pattern and bullish-bearish signals show that PUMP price line is still rising
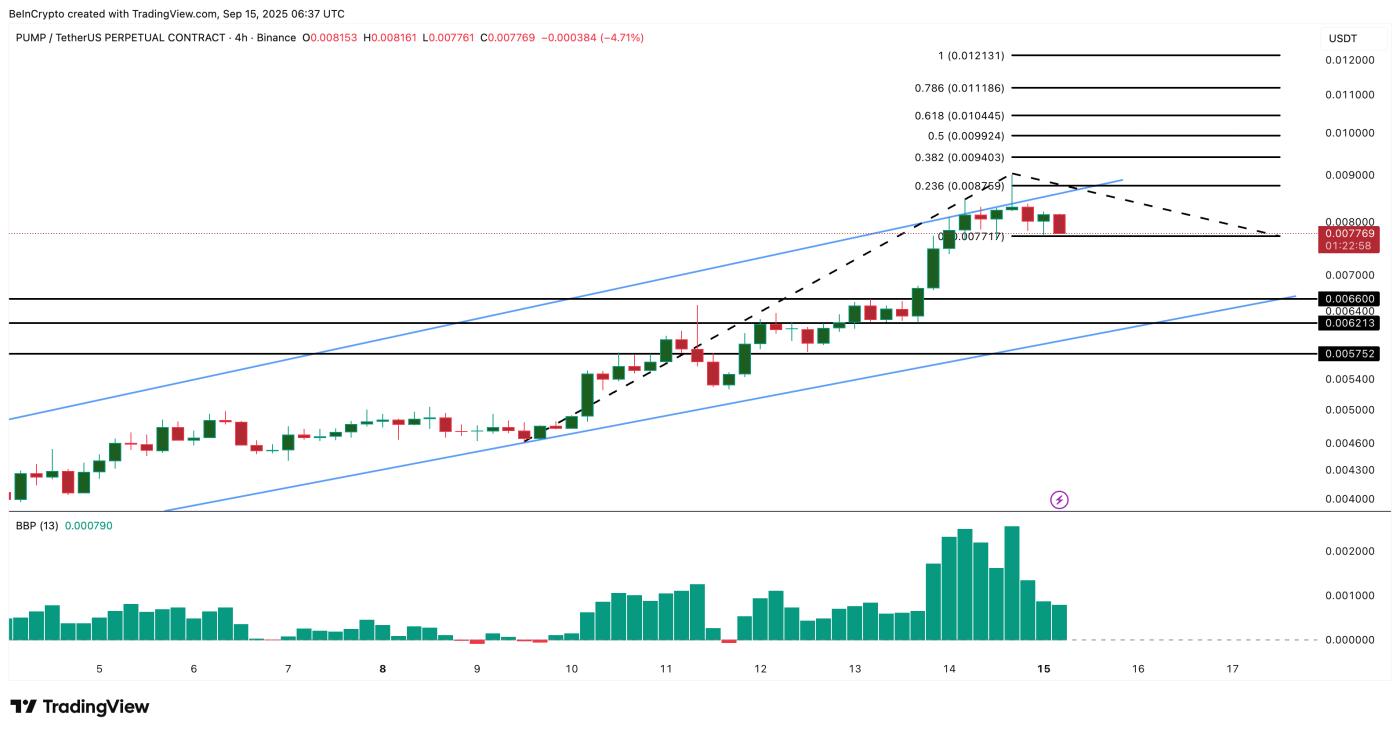
To gauge short-term strength, the 4-hour chart provides the clearest view of the PUMP's short-term levels. It captures intraday changes that the daily chart can smooth out, making it ideal for spotting corrections.
 PUMP Price Analysis: TradingView
Here, the Bull-bear power indicator — which measures XEM buyers or sellers are stronger by comparing price to a Medium — still shows buyers are in control.
Even though PUMP has moved sideways and declined slightly, buyers continue to defend the $0.00771 level, which is close to the current trading level. This defense is important, as it shows that buyers are not giving up positions easily.
Meanwhile, the PUMP price action remains within an ascending channel, which is the third bullish reason after SMI and MFI. If the sell-off deepens, support levels lie at $0.00660 and $0.00621. Even a correction to these levels would not break the channel, keeping the broader bullish trend intact. Only a close below $0.00575 would turn the trend from bullish to bearish.
However, if the PUMP price reclaims the $0.00876 level (close to the All-Time-High) with a full candle close, it would mean that the correction is over.
And then it will prepare the price to reach new highs by helping to break the ascending channel pattern, with the next targets located at $0.00940 and $0.009924.


