

Solana prices have been on a strong run over the past month, rising about 37%. But beneath the surface, warning signs are starting to appear.
Major holders are quietly reducing supply, while chart signals suggest the rally may not be as solid as it appears. Whether Solana can break through resistance now hinges on a few key levels.
Holders take profits while hidden selling pressure increases
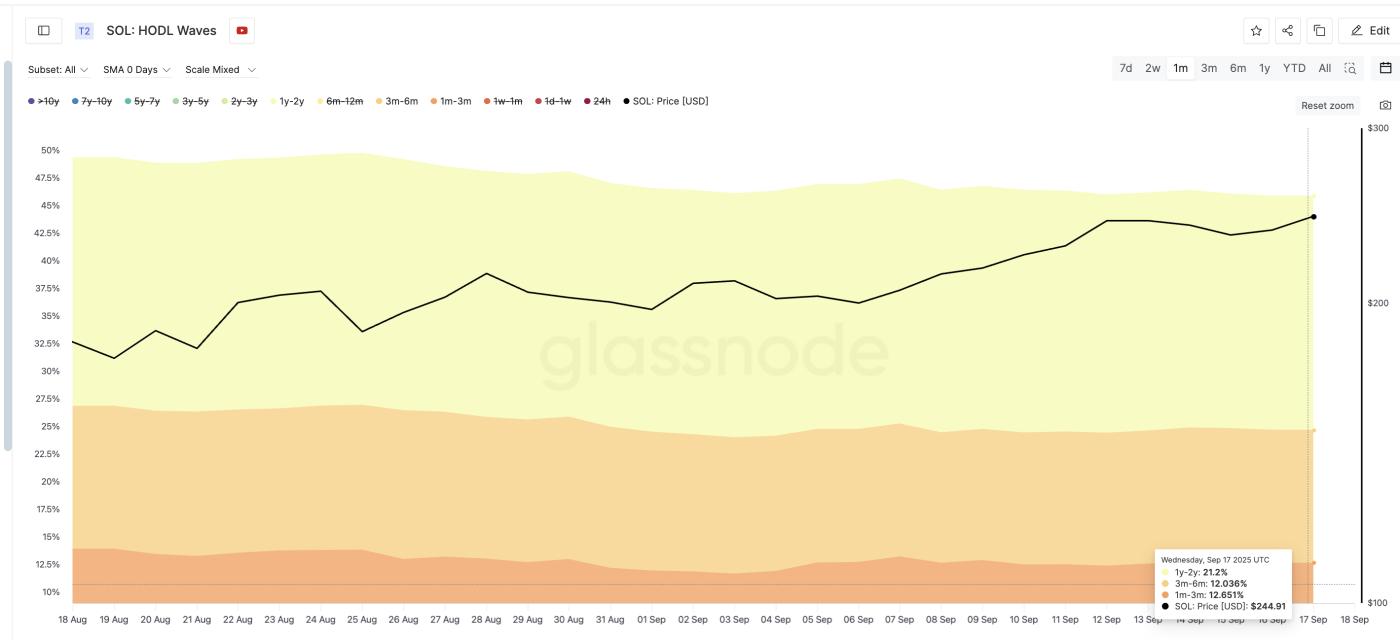
One way to track selling or holding behavior is through HODL Waves, which shows how much of the supply is held by different age groups of wallets. If the percentage of coins held by a group decreases, it usually means that group is selling.
In the case of Solana, almost every major group has reduced their holdings over the past month. The 1-3 month group dropped from 13.93% of the supply on August 18 to 12.65% currently. The 3-6 month group dropped from 12.92% to 12.03%. Even long-term holders of 1-2 years dropped from 22.51% to 21.20%.
 Stronger Solana Seller: Glassnode
The selling is not surprising after a 37% gain.
Want more information about Token like this? Sign up for Editor Harsh Notariya's daily Crypto Newsletter here .
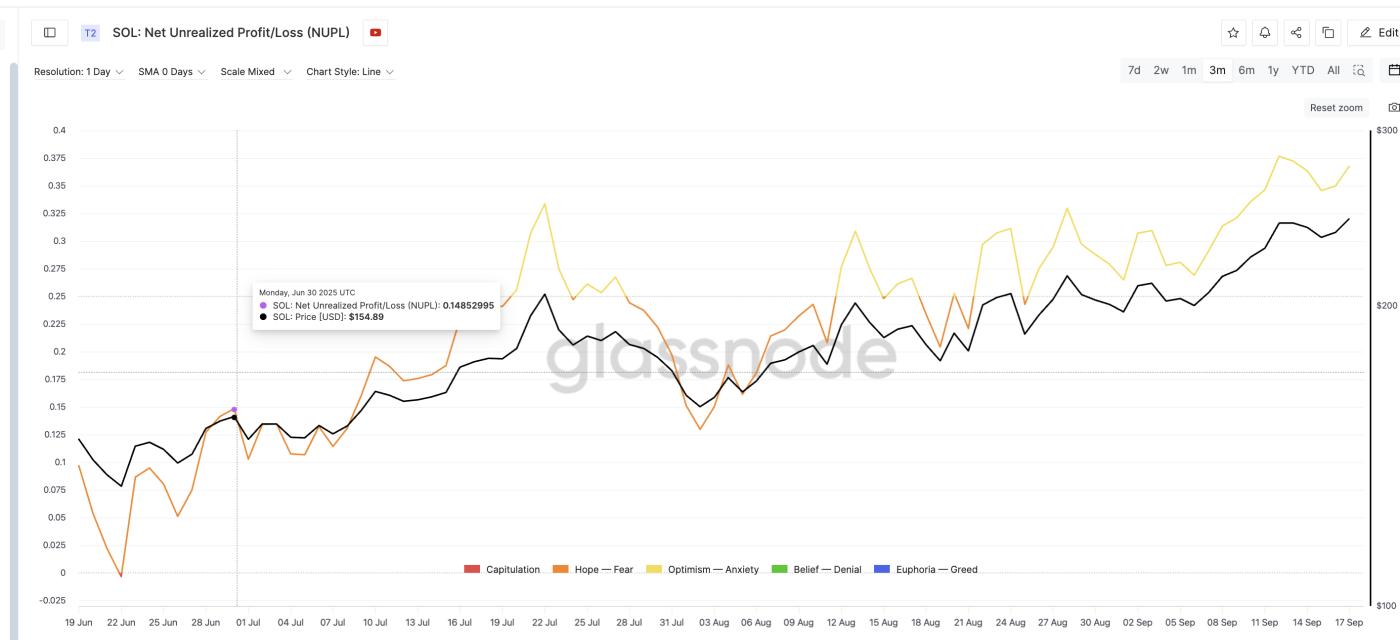
But what is unusual is that NUPL, or Net Unrealized Profit and Loss, remains high. NUPL tracks how many wallets are holding paper profits. When it is high, it means that many holders are still making profits and could take profits.
On September 12, when NUPL hit a three-month high of 0.37, Solana price corrected more than 3%.
 Solana traders still profit despite selling: Glassnode
This also brings us back to July 22nd, when NUPL hit 0.33. That peak coincided with a sharper 22.9% drop in Solana price, from $205 to $158.
Currently, NUPL is near 0.36 — close to those dangerous levels.
These signals indicate that although various holding groups have sold, there are still many profits in the system. If selling pressure increases again, weak hands may quickly withdraw.
Key Levels That Decide Whether Solana Price Continues to Rise or Corrects
On the daily chart, Solana ’s breakout from the rising channel still points to a target near $284. But the immediate challenge lies at $249. A daily close above this resistance would keep the bulls in control.
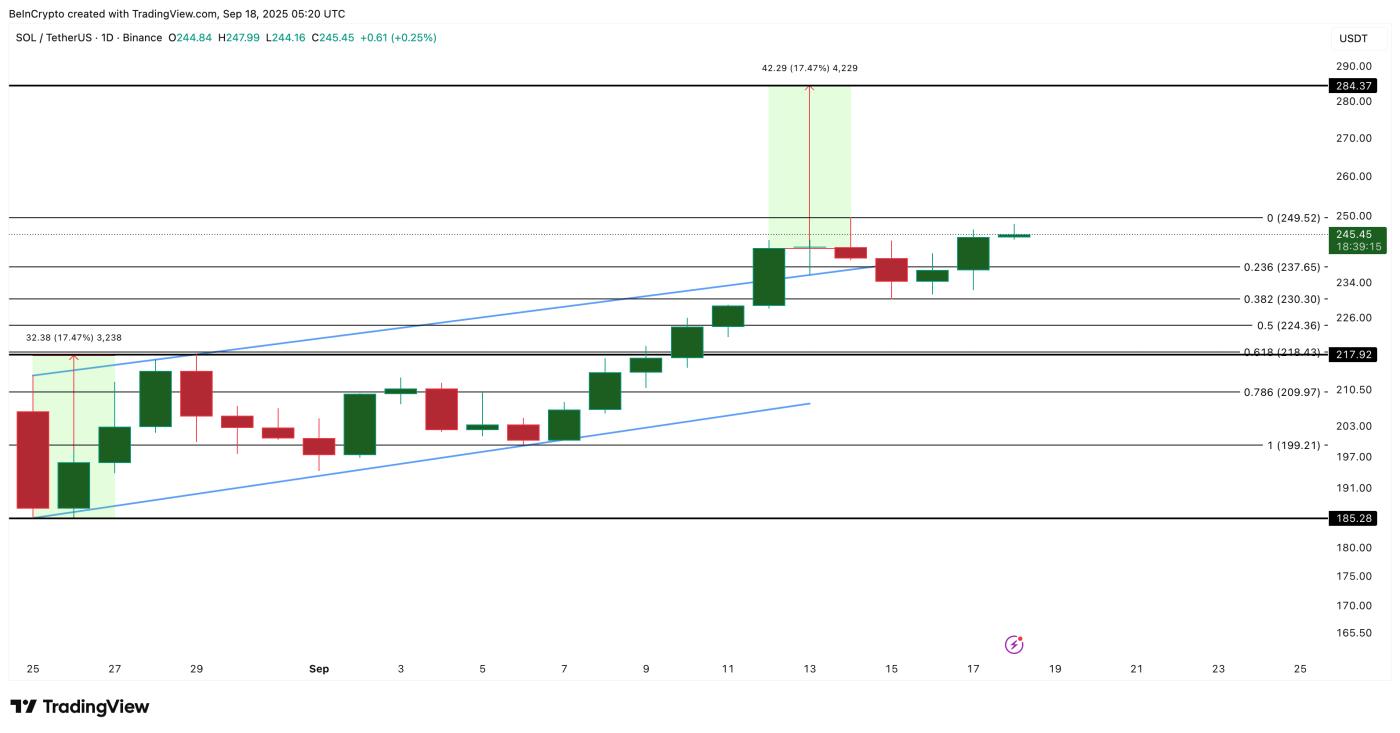 Solana Daily Price Chart: TradingView
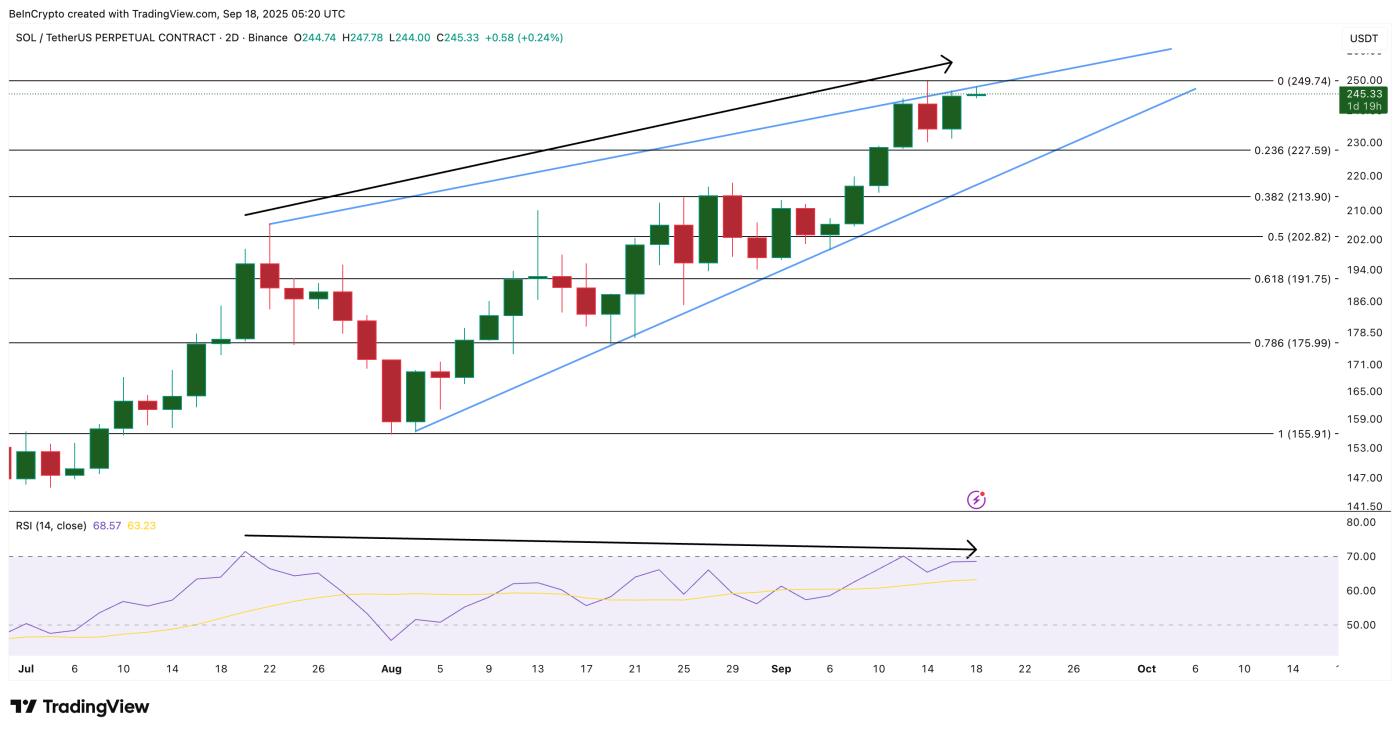
The bigger risk comes from the two-day chart. Here, Solana is trading in a rising wedge, a setup that often suggests a correction.
 Solana Price Analysis : TradingView
At the same time, the Relative Strength Index (RSI) shows that momentum is decreasing — the price has been making higher highs, but the RSI is making lower highs. This bearish divergence is often an early sign that a rally is losing momentum.
If Solana price breaks above $249 in a two-day close, the bearish setup could be invalidated.
But if it fails, the price could fluctuate in a range and face pressure at $227. A deeper break below that level could push Solana towards $202 and even lower.


