

Bitcoin is trading at $109,449 with a market capitalization of $2.18 trillion and a 24-hour trading volume clocking in at $20.54 billion. The intraday range? A tightrope walk between $109,276 and $109,761—just enough motion to keep traders twitchy but not thrilled.
Bitcoin
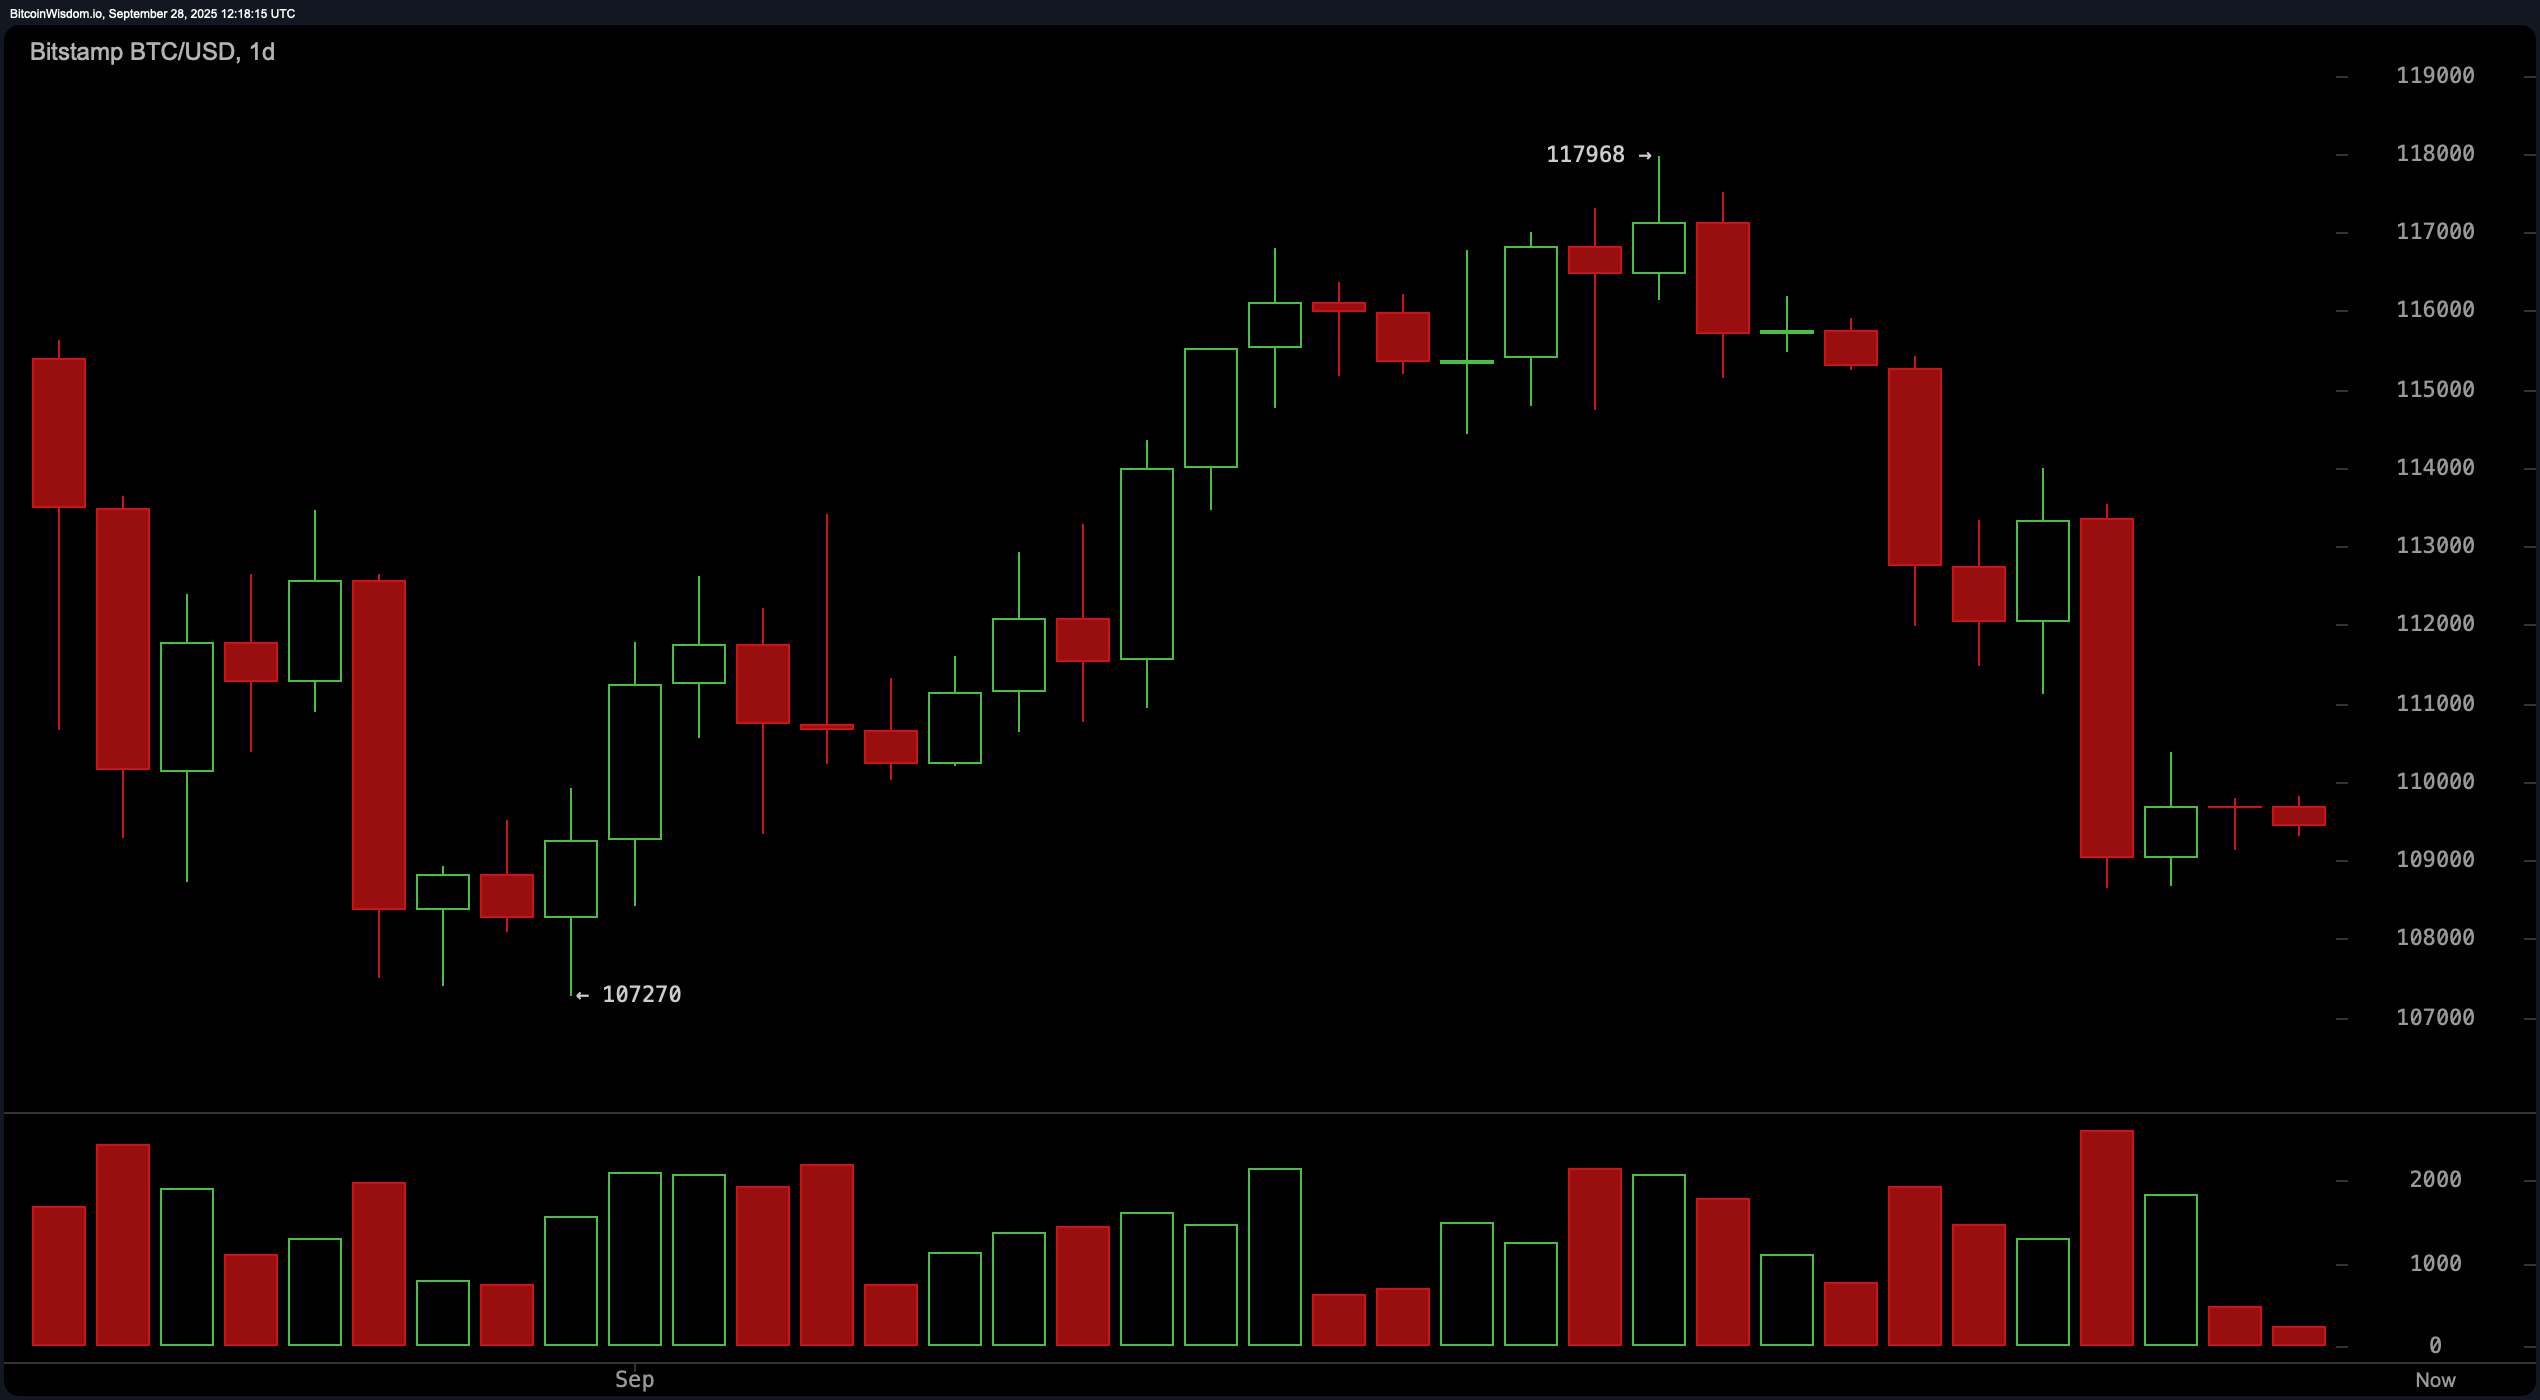
So, what’s the daily bitcoin chart whispering today? A whole lot of “meh” with a side of “maybe.” The daily trend is firmly bearish, following a climb to $117,968 and a recent slip to $107,270. The current price zone between $109,000 and $110,000 screams consolidation, and while the sell-side volume spike suggests bears had their fun, that party may be winding down.
Key levels? Support sits cozy at $107,000 to $107,500, while resistance holds tight between $114,000 and $117,000. A break above $111,000 could cue the bulls for a short-term rally, but until then, this chart looks like it’s trying to remember how to be exciting.
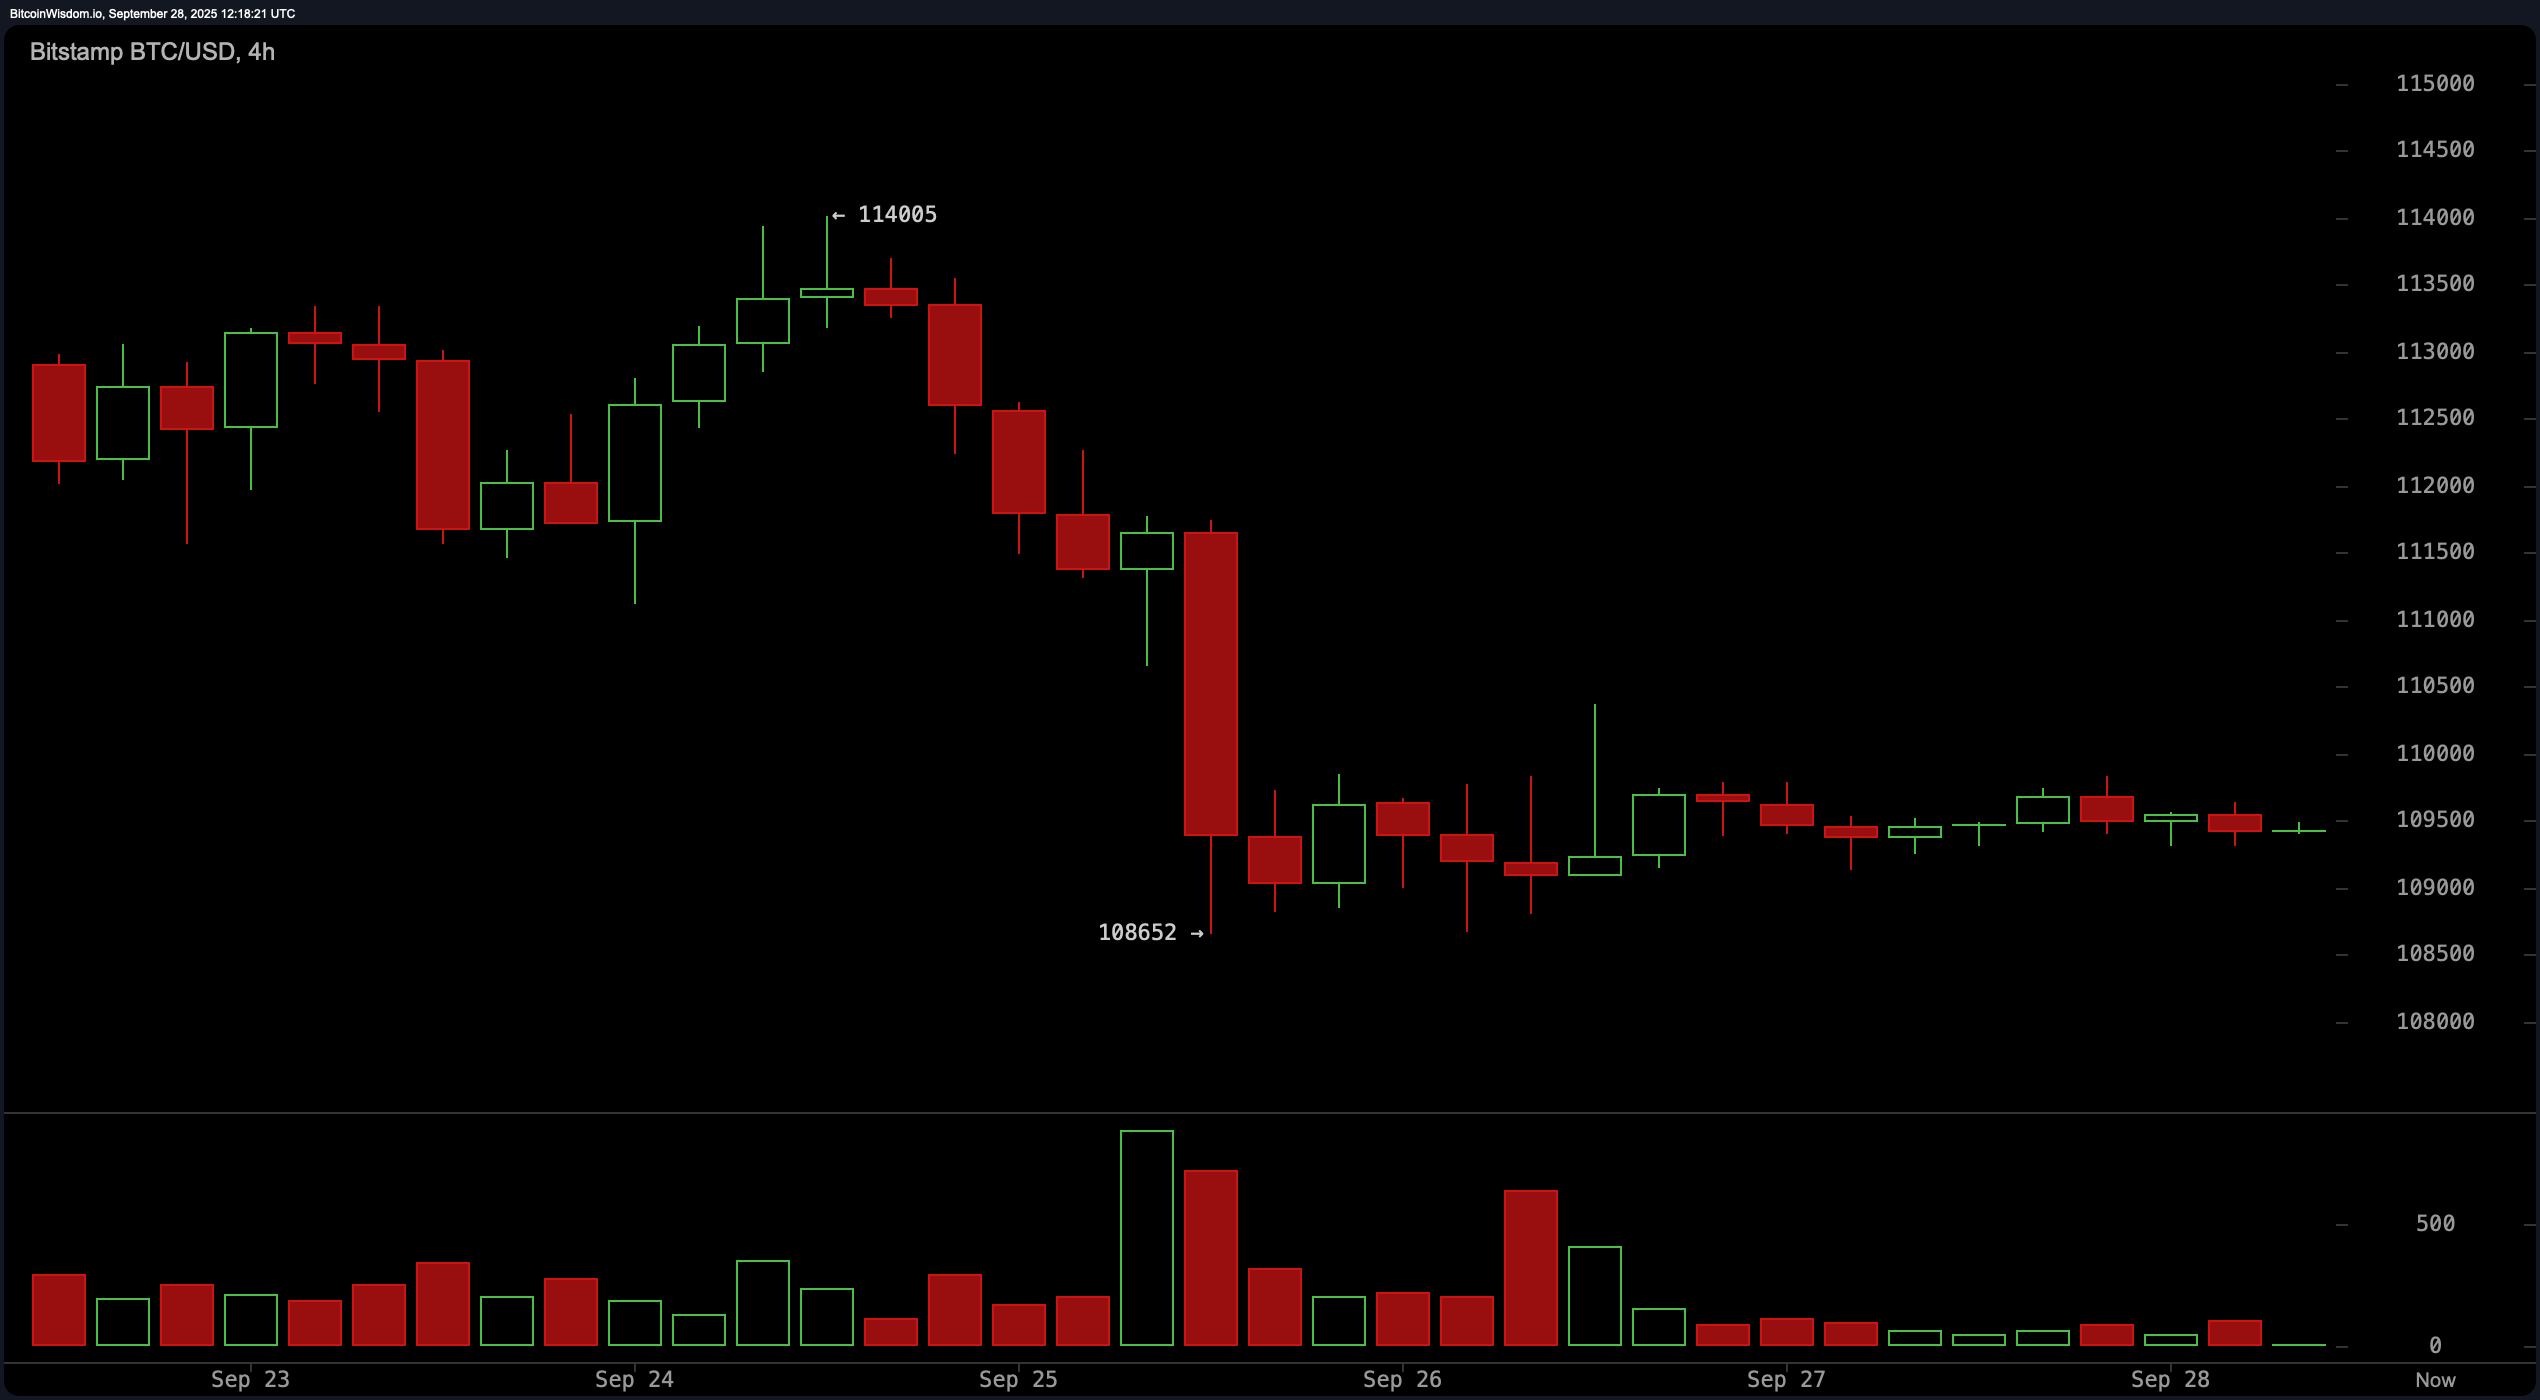
Zoom into the 4-hour bitcoin chart and the picture doesn’t get rosier—unless you’re shorting. The downtrend is clearer than your ex’s motives, with a descending channel forming post-breakdown from the $114,000 region. Price action is boxed in between $108,600 and $109,800, forming a bearish flag. Yet, declining bearish volume hints at a market either exhausted or just taking a cigarette break. Should bitcoin break below $108,600 with conviction, the $107,000 target becomes plausible again.
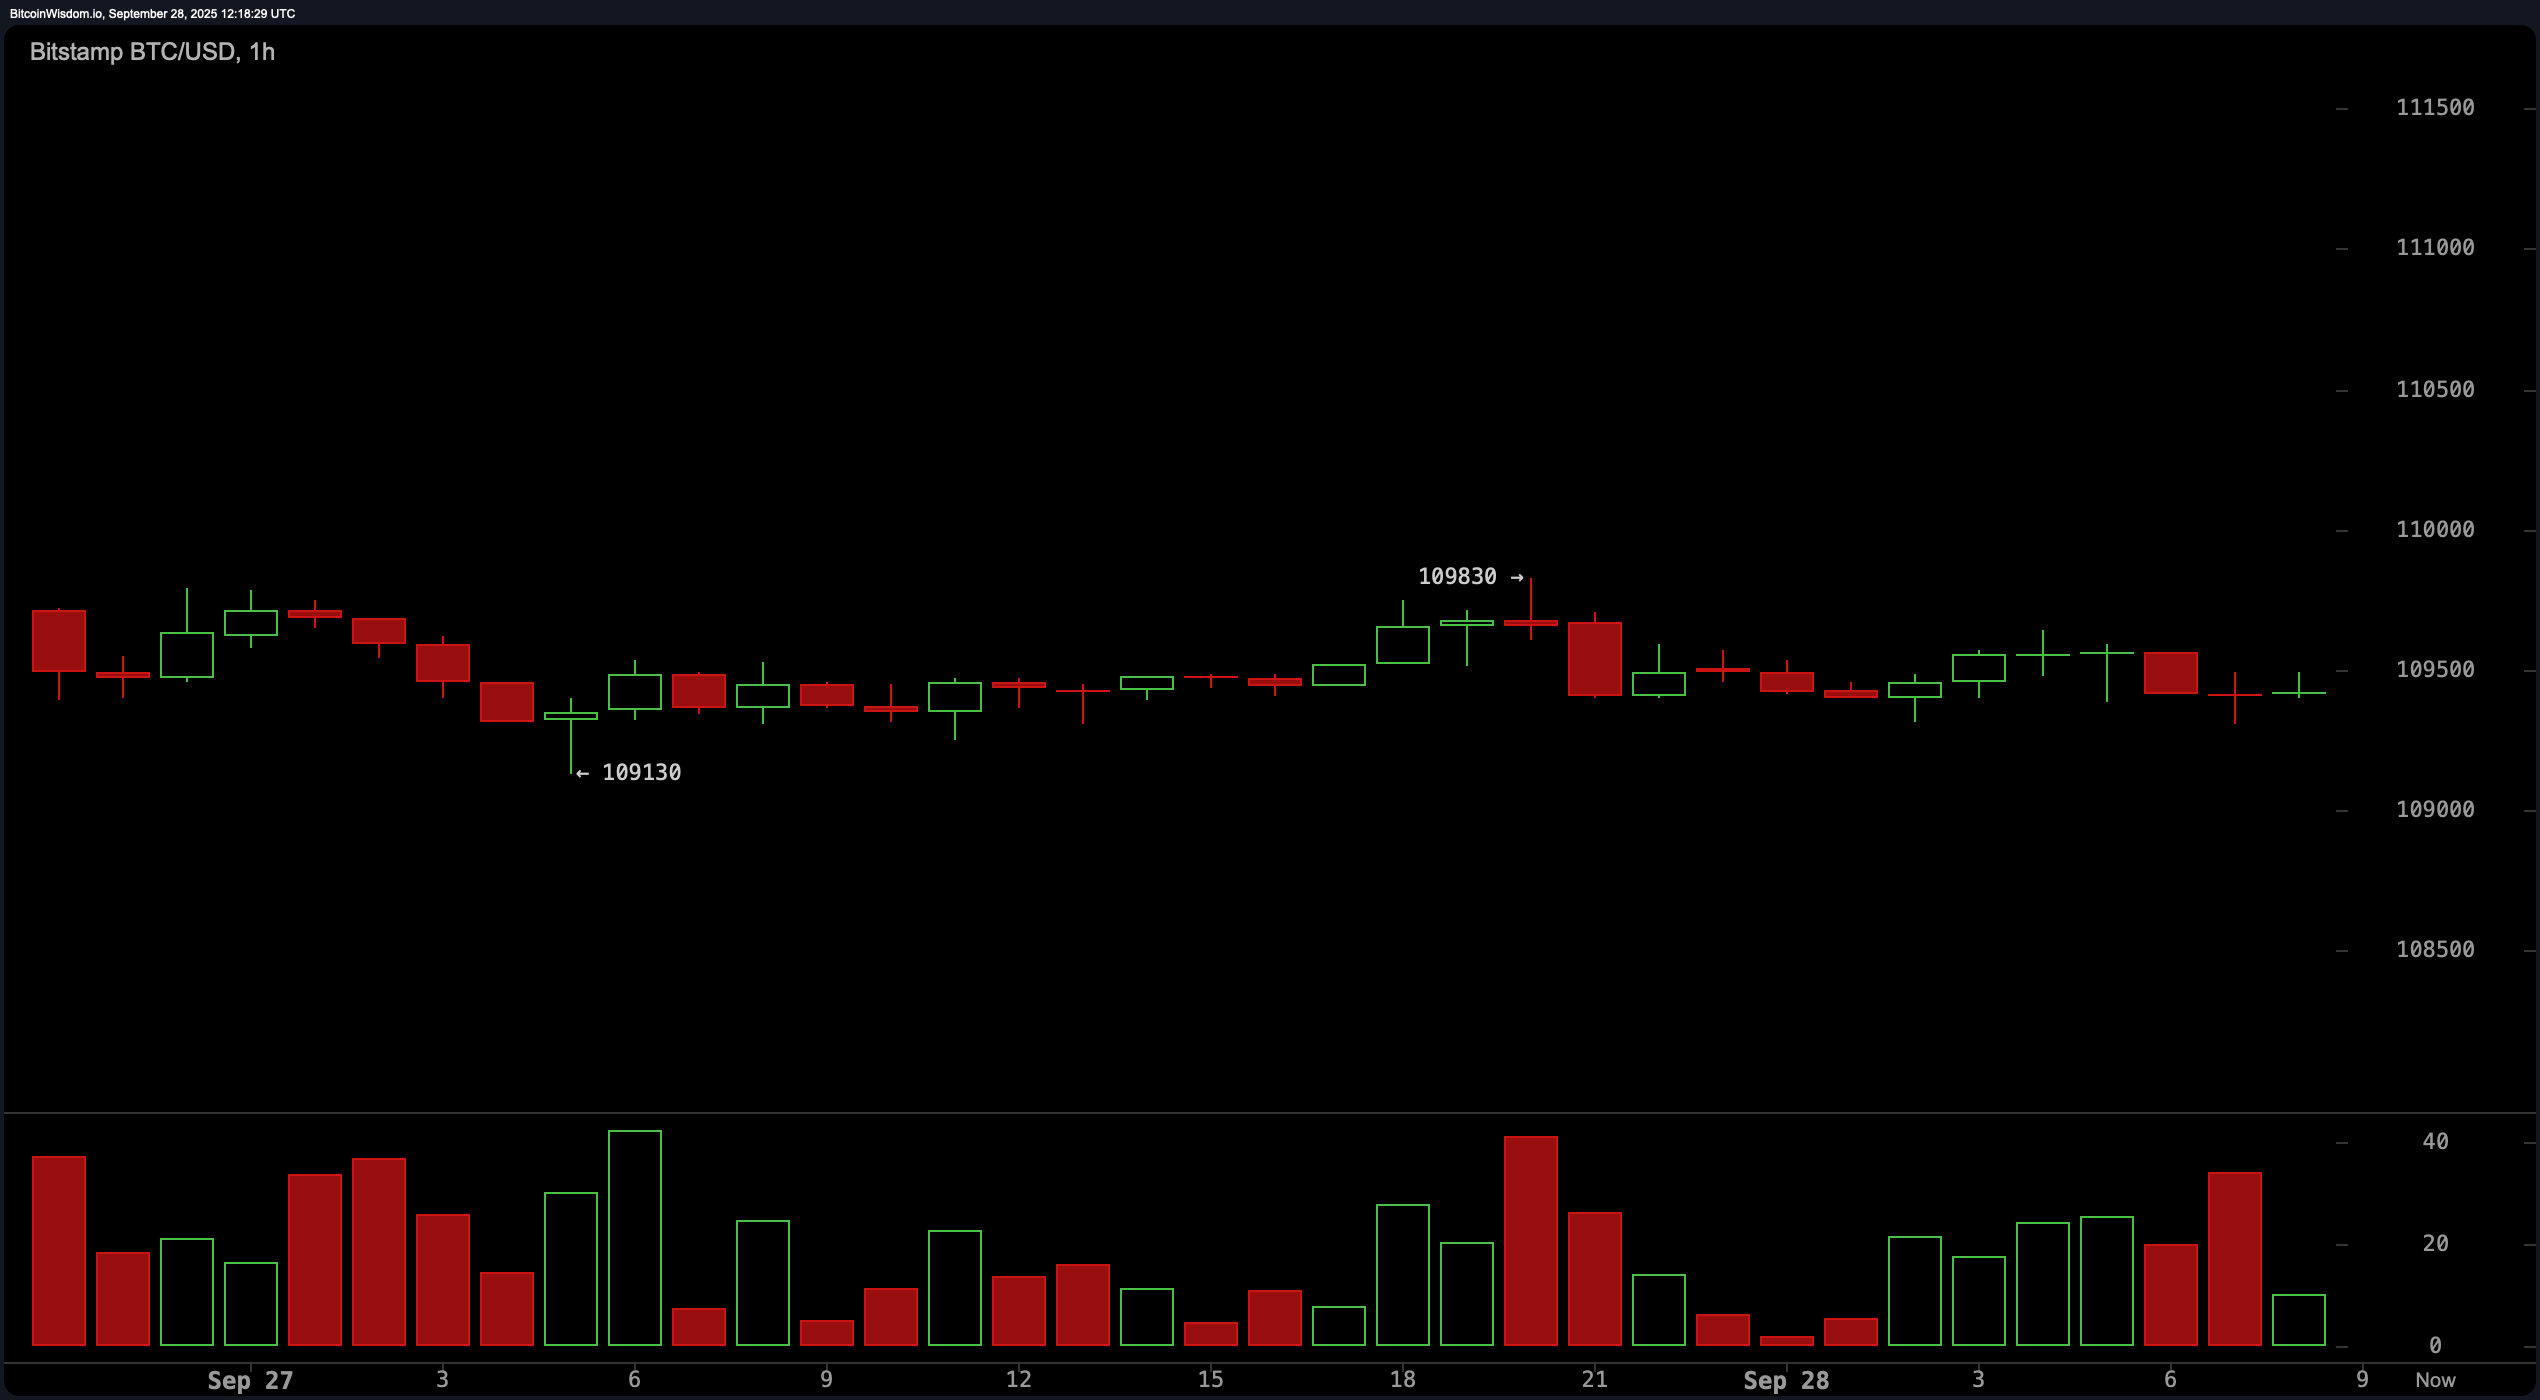
Drop to the 1-hour chart, and bitcoin is grinding sideways like it’s stuck in traffic. It’s ranged tightly between $109,100 and $109,800, with a failed bullish micro-attempt at $109,830. The low volume here suggests either stealthy accumulation or bored whales. Scalpers might find some joy with longs near $109,100 and stops around $108,900, or shorts if resistance at $109,800 holds—though you’d better be fast and nimble in this chop.
Oscillators are showing a cocktail of confusion. The relative strength index (RSI) at 38 and the Stochastic oscillator at 10 both register neutral. The commodity channel index (CCI) dives deep into bullish territory at -130, while momentum shows a sharp bearish angle at -7,666. The moving average convergence divergence (MACD) level sits at -926, another vote for selling pressure. The Awesome oscillator is mildly negative at -2,046, yet also neutral. The average directional index (ADX) is barely awake at 20—hardly a roaring trend.
And let’s not forget the sea of red in the moving averages (MAs). From the 10-period exponential moving average (EMA) at 111,617 to the 100-period simple moving average (SMA) at 113,600, nearly every short- to mid-term indicator screams “bearish.” Only the 200-period EMA and SMA—at 106,256 and 104,439, respectively—give us a “bullish” roar reminding us that zooming out might calm the nerves. In other words, bulls have some climbing to do before calling it a comeback.
Bull Verdict:
If bitcoin can claw above $111,000 with volume and break the upper bounds of its current consolidation, the setup favors a short-term relief rally. With sellers showing signs of fatigue and long-term moving averages still flashing green, the bulls aren’t out of the fight just yet.
Bear Verdict:
With every key short- and mid-term moving average pointing south and momentum indicators leaning bearish, the path of least resistance remains down. If the $108,600 support crumbles, a retest of the $107,000 level—or lower—looks not just possible, but probable.


