Bitcoin has broken above its ATH at the $125K region, signaling strong momentum.
Nevertheless, the market is now entering a decisive phase, where consolidation or a short-term retracement could shape the next significant directional move.
Bitcoin Price Analysis: Technicals
By Shayan
The Daily Chart
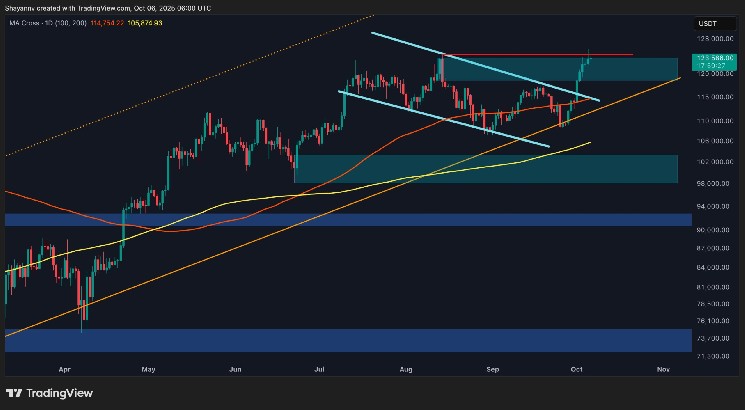
On the daily timeframe, BTC has successfully broken above the flag pattern that confined price action since July, confirming a strong trend continuation. The move above the upper boundary coincided with a surge in momentum that carried the price into the previous supply zone around $124K–$126K, where sellers have started to show mild resistance.
The bullish structure remains intact, supported by the golden cross between the 100-day and 200-day moving averages, which continue to act as dynamic support lines. As long as the price sustains above $120K, the broader uptrend remains valid, and a clean daily close above $126K could open the path toward $130K–$132K in the short term.
However, failure to hold above $120K may trigger a healthy retracement toward the mid-range support near $115K, which aligns with the breakout structure and the 0.618 Fibonacci retracement.
The 4-Hour Chart
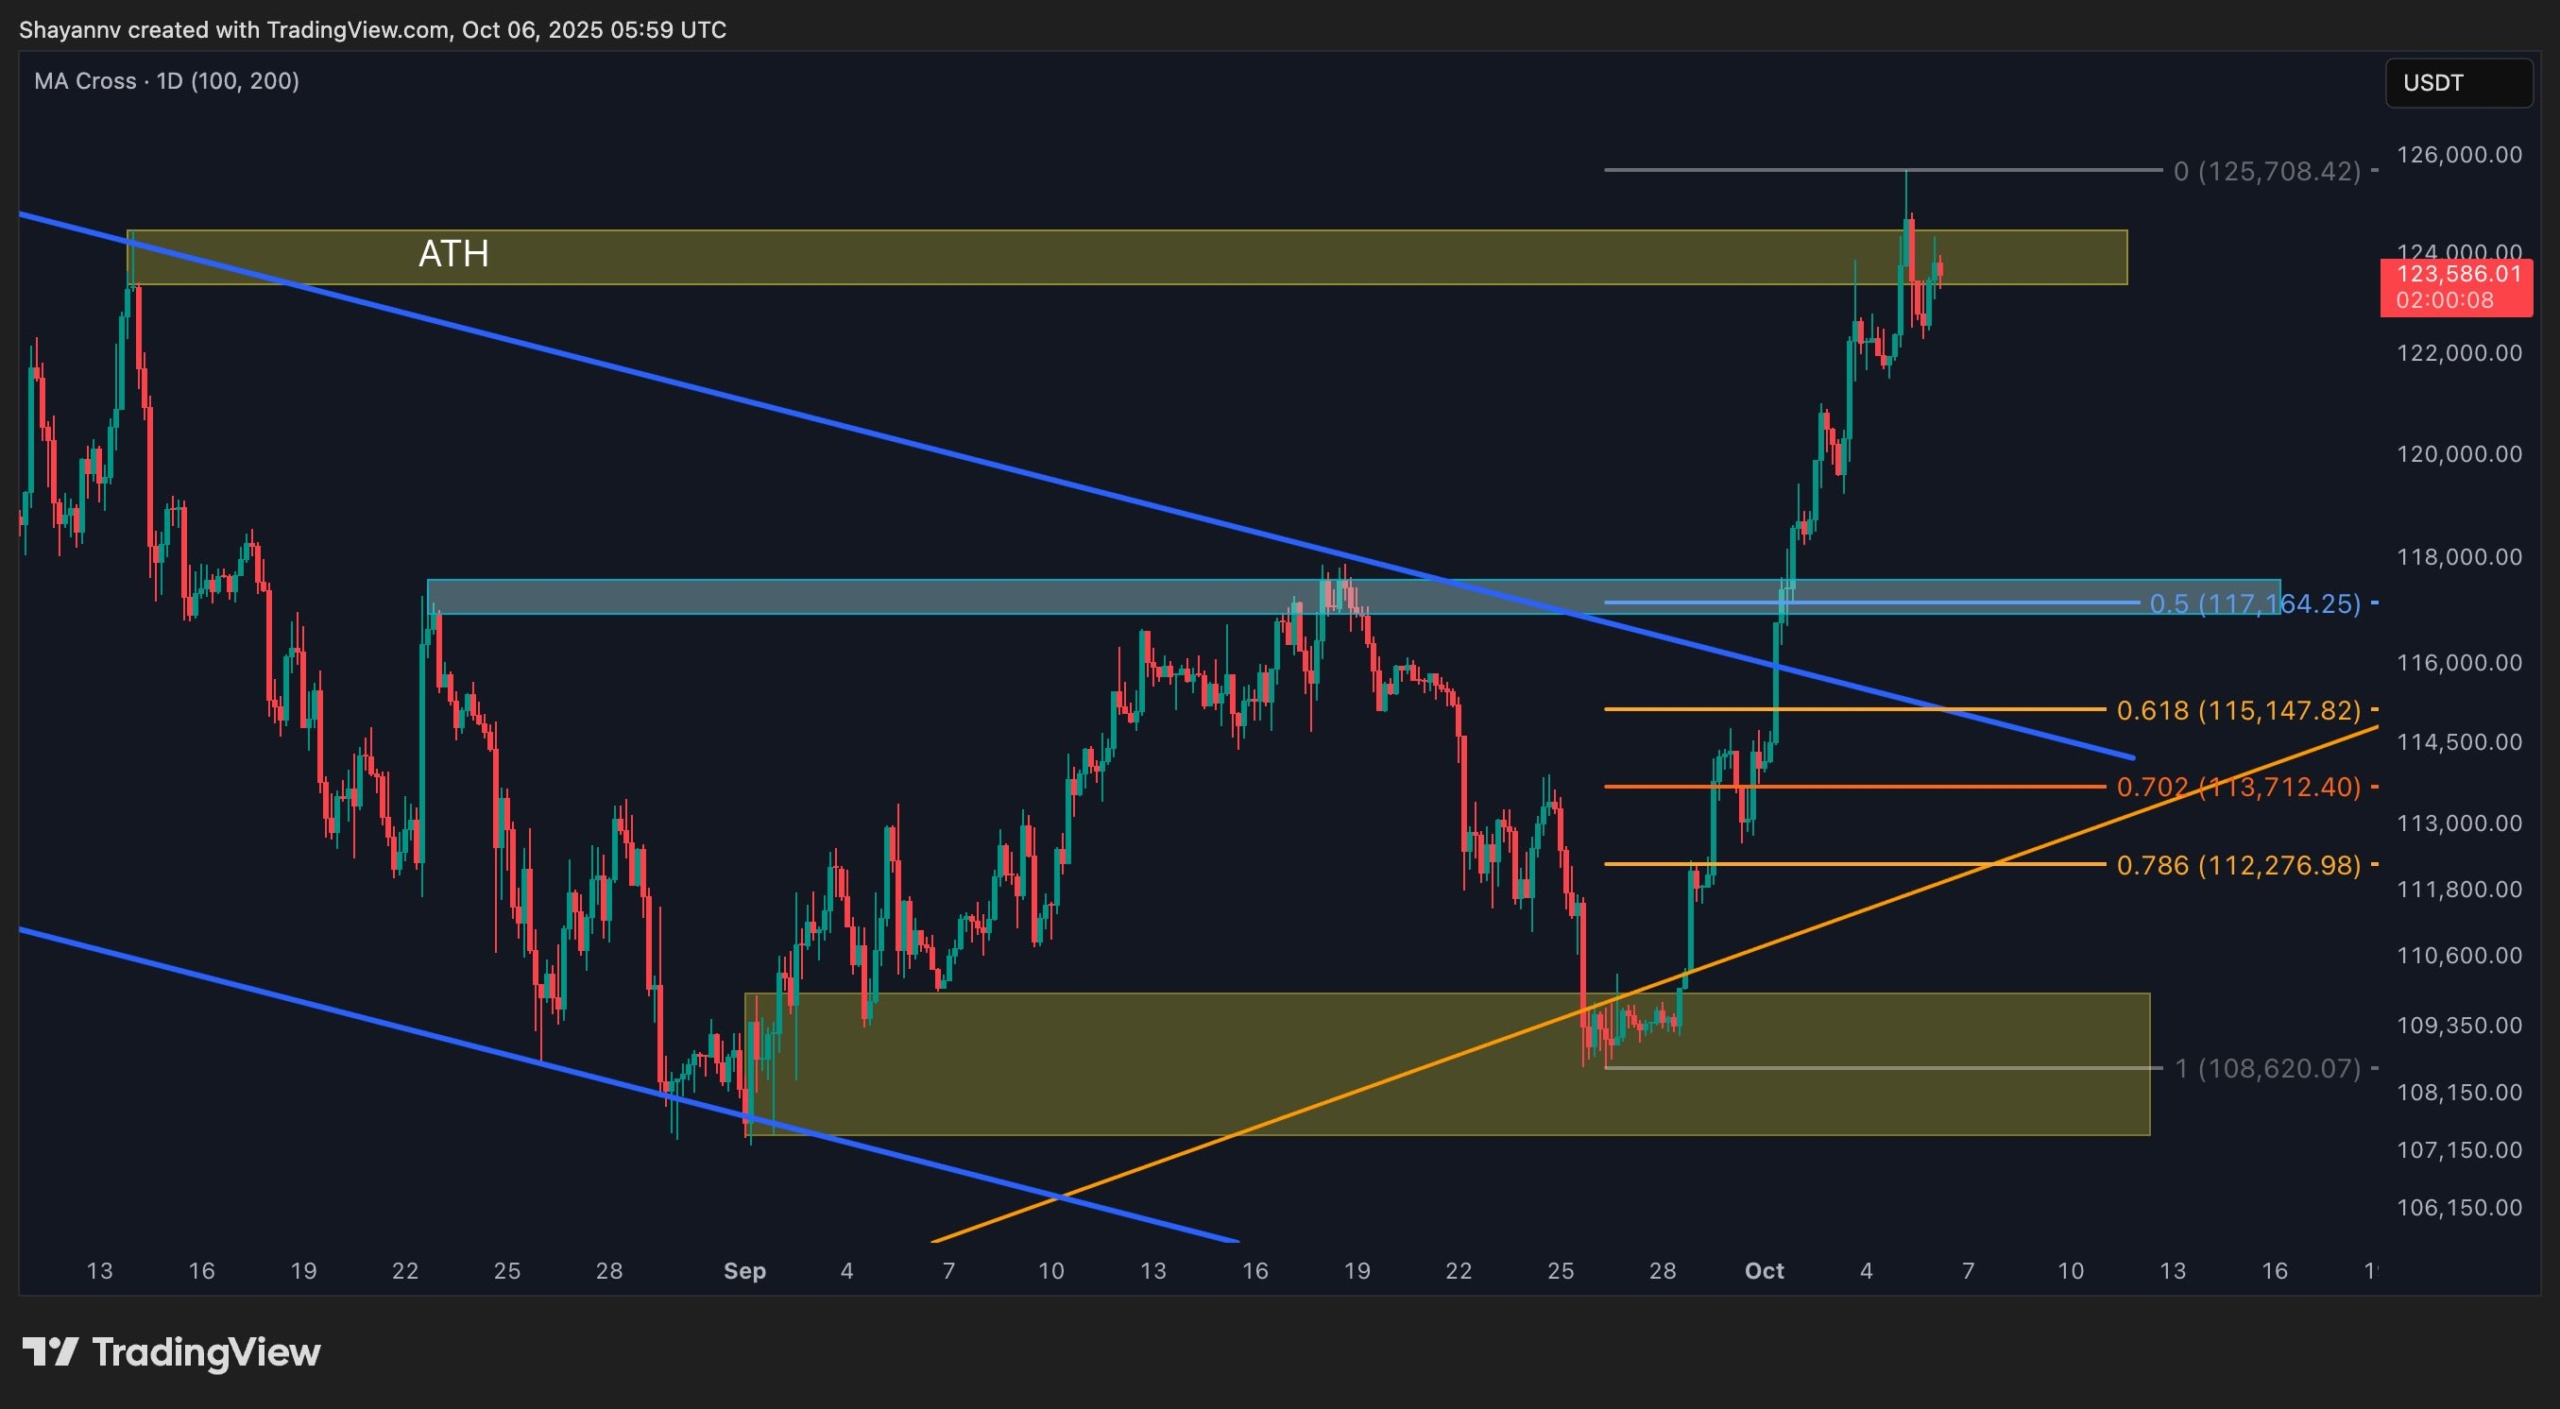
The 4-hour chart shows BTC recently increasing above the $118K decision point, making it a breaker block, and rallying rapidly toward the ATH zone around $125K. The impulsive nature of this move has created a clear imbalance, with potential retracement zones identified between $115K and $113K, aligning with Fibonacci confluence levels (0.618–0.702 range).
This zone serves as a short-term re-accumulation area, and holding above it would confirm continued bullish control. The market is currently consolidating near a liquidity-dense area, suggesting that a brief pullback could attract renewed buying interest before the next leg higher.
If the price fails to defend the $118K breakout block and the $113K-$115K Fibonacci range, the next key demand lies around $ 109K–$110 K, where strong buying previously initiated the breakout.
Sentiment Analysis
By Shayan
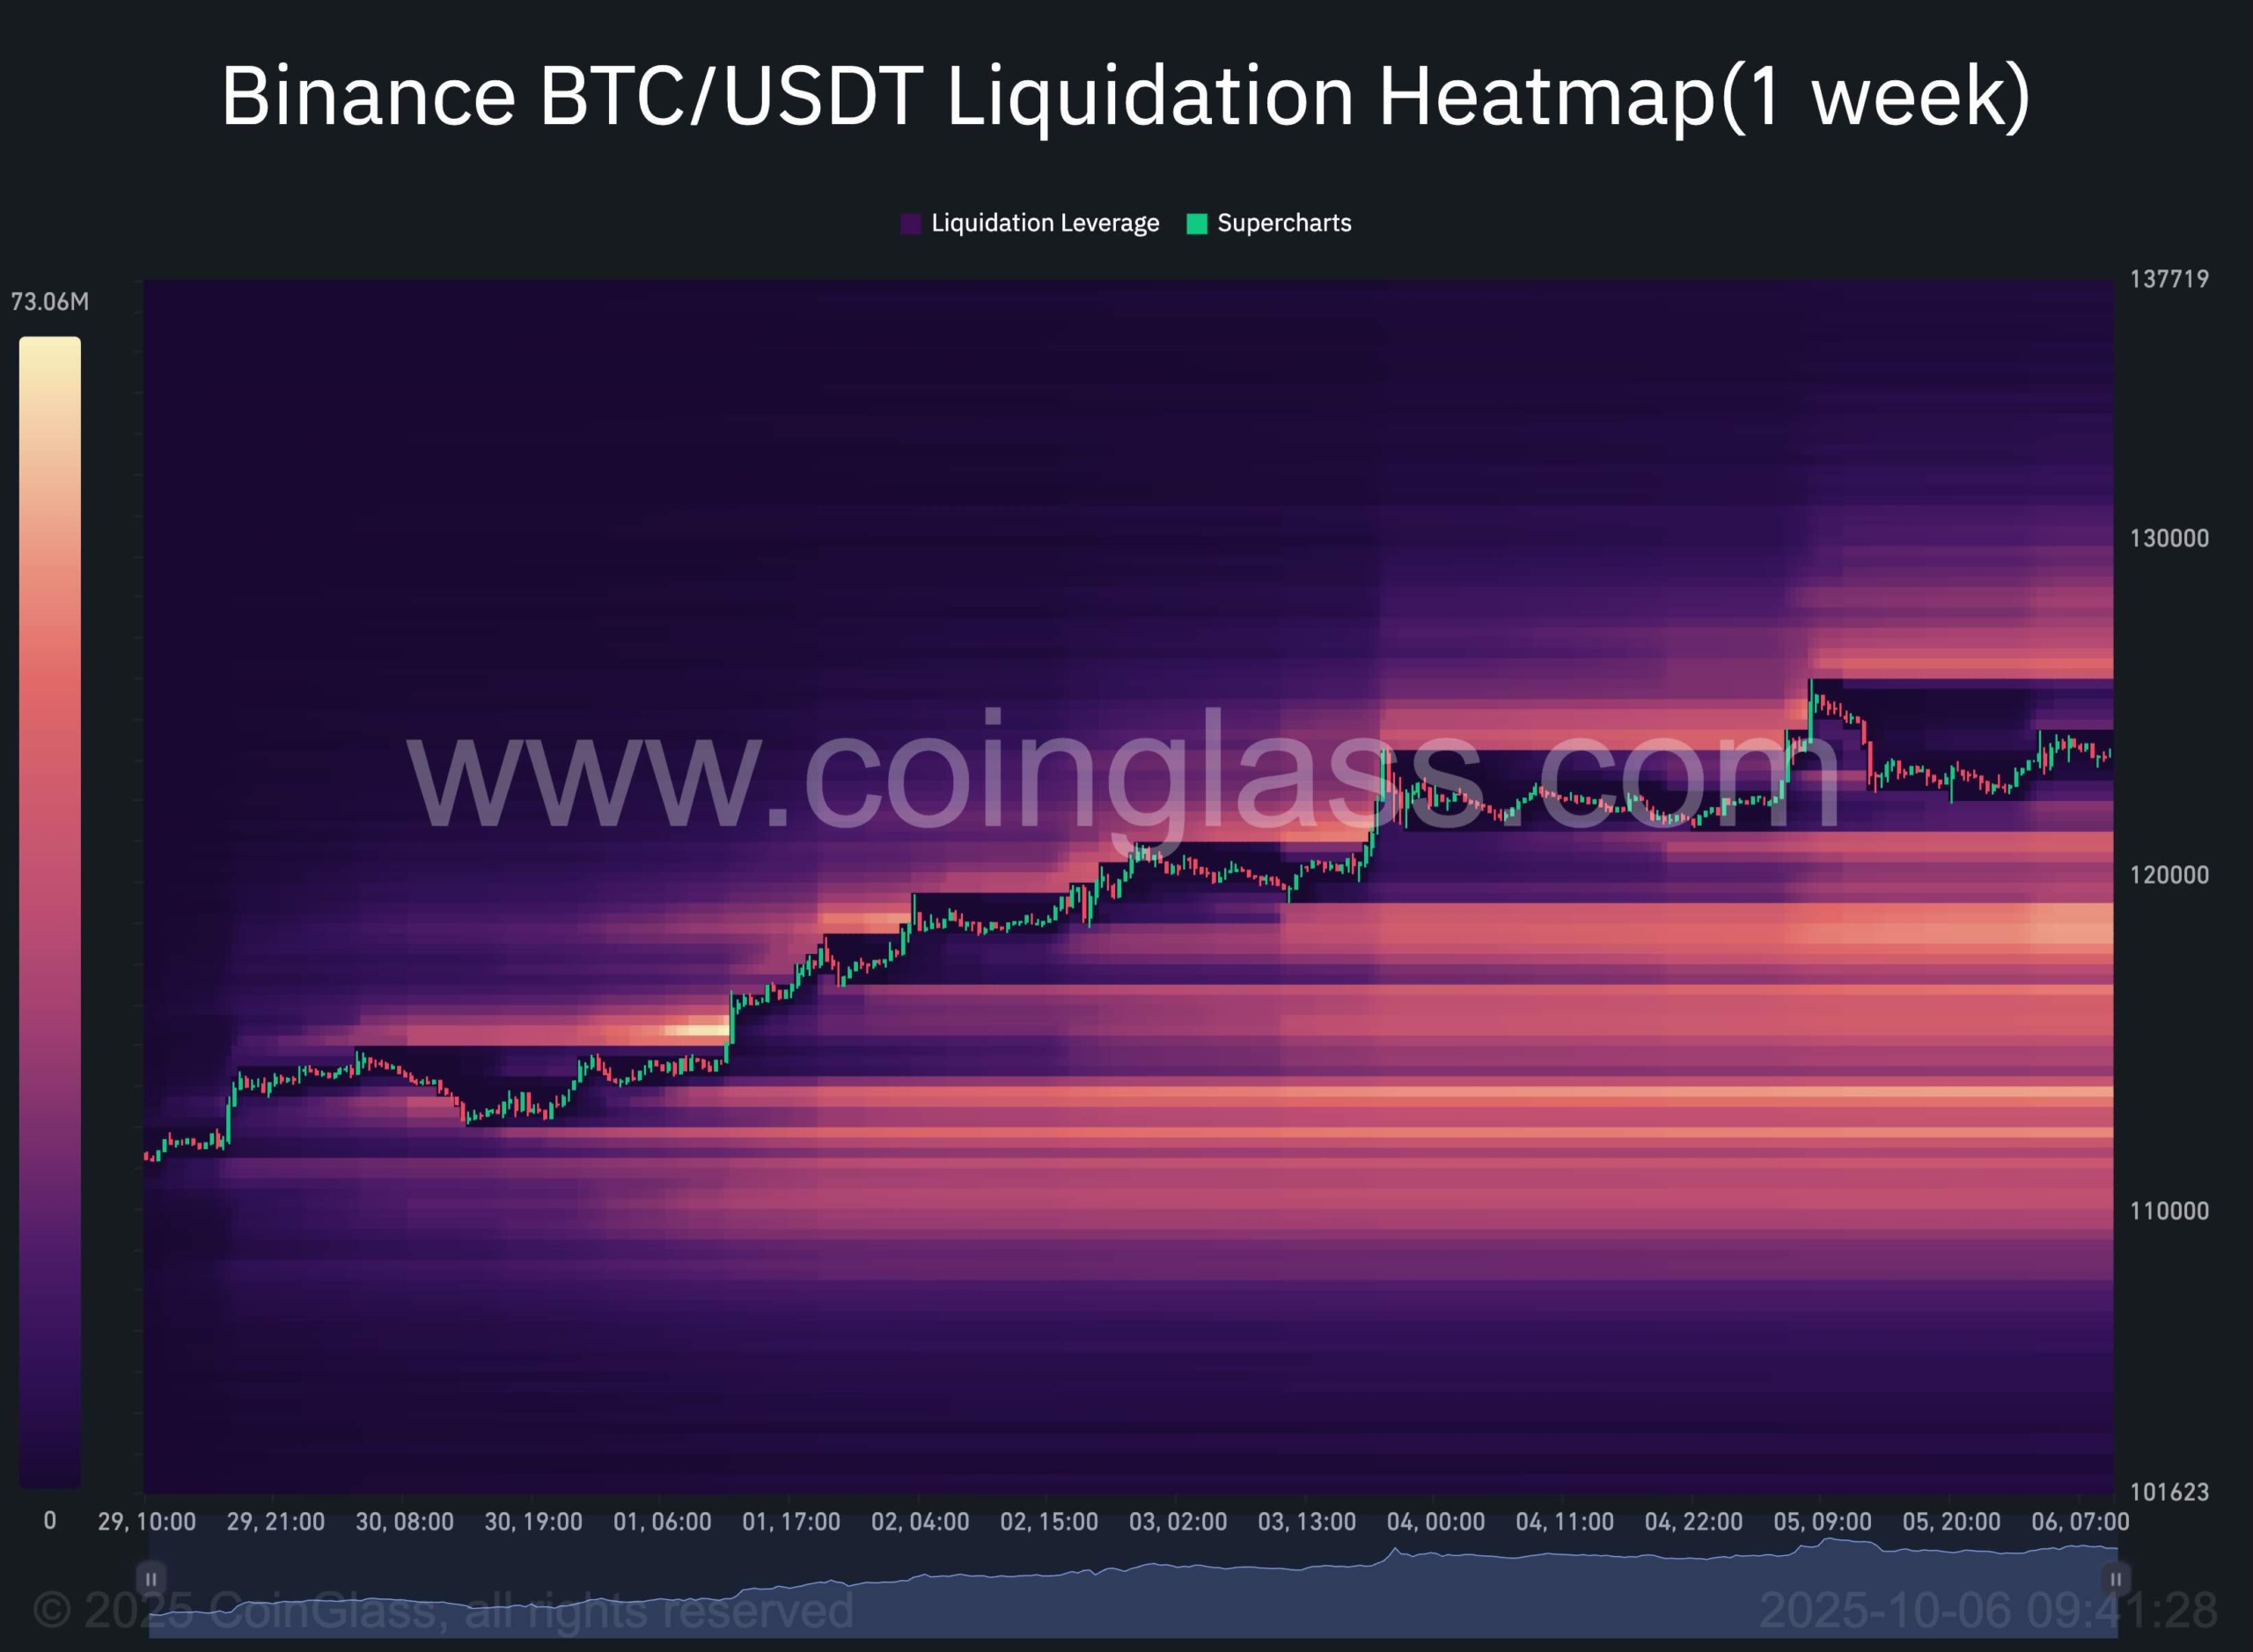
The latest 1-week Binance liquidation heatmap reveals a significant buildup of liquidity zones, with particularly dense liquidation clusters forming around $128K–$130K. These high-density regions indicate where a large volume of leveraged short positions has accumulated, making them ideal targets for potential price continuation or liquidity sweeps.
Throughout the recent rally from $110K to above $123K, we can observe a steady absorption of lower-level liquidity, each upward impulse clearing prior short positions before consolidating. The presence of major liquidation pockets below the current price, especially around the $120K region, highlights that downside risk is also in play in the short term, suggesting that the market is still poised for a pullback or correction before the next move.
This shift reflects a market positioning bias where late sellers are entering shorts near resistance, giving Bitcoin room to extend upward toward $128K–$130K as those positions are forced to close.
If the price maintains its footing above $120K, a short-squeeze continuation into the upper liquidity band appears likely before any meaningful retracement occurs.