It’s never been a more important time to understand the labor market. The Fed is entering a rate cutting cycle, the government shut down, and private players are developing their own numbers to try and close the gap. I sat down with Chicago Fed President Austan Goolsbee to talk about what the Chicago Fed’s new real-time labor market indicators are telling us and how the Fed should navigate a steady-but-thin job market. We also get into how labor-force participation complicates the story, what AI is doing to early-career hiring, and why this moment might force a broader rethink of how we measure work itself.
This transcript has been lightly edited for clarity and flow. Below is the audio version, which is also available wherever you listen to podcasts.
This is a reader-supported publication. To receive new posts and support my work, consider becoming a paid subscriber.
Recorded on Friday, October 3rd, 2025
Why Build New Labor Market Indicators
Kyla: President Goolsbee, thanks so much for joining me today.
PG: Thanks for having me back, Kyla.
Kyla: I’m really excited to talk about the Chicago Fed Labor Market indicators because we desperately need some sort of information about the labor market right now. Can you walk through what these labor market indicators are supposed to do and the goal that you had with publishing them?
PG: When you have a government shutdown and you’re not getting BLS data, that’s a big problem for a lot of people. But especially for the Fed - we didn’t know there would be a government shutdown - but we did know that we’re going through a tumultuous period of transition in the economy. We wanted some better real time estimates of what’s happening in the job market. We put together 11 different data sources, some of which are the official statistics that come from the BLS, but tend to come out with a lag, some of which are high quality private sector sources on the job market. We built a statistical model of what these observations mean for three statistics that we keep track of.
One is a real time estimate of what the unemployment rate is going to be at the next job report.
Then the other two are a hiring rate of unemployed workers and a layoffs and separations rate for people that currently have jobs, because there’s a lot of churn going on at any given moment in the job market.
If you have 100,000 jobs created for the month, that’s 5.2 million jobs that were created and 5.1 million jobs that were lost for a net of 100,000 jobs. So we looked at those flows and then it turned out that just as we announced this multi-month effort to build these statistics the government shut down and there’s not going to be an unemployment number.
Our data is not as good as the BLS. The BLS numbers are the best job numbers in the world but if we cannot have the best job numbers in the world, we are going to have to go with what we do have and what we have is this - based on what we know:
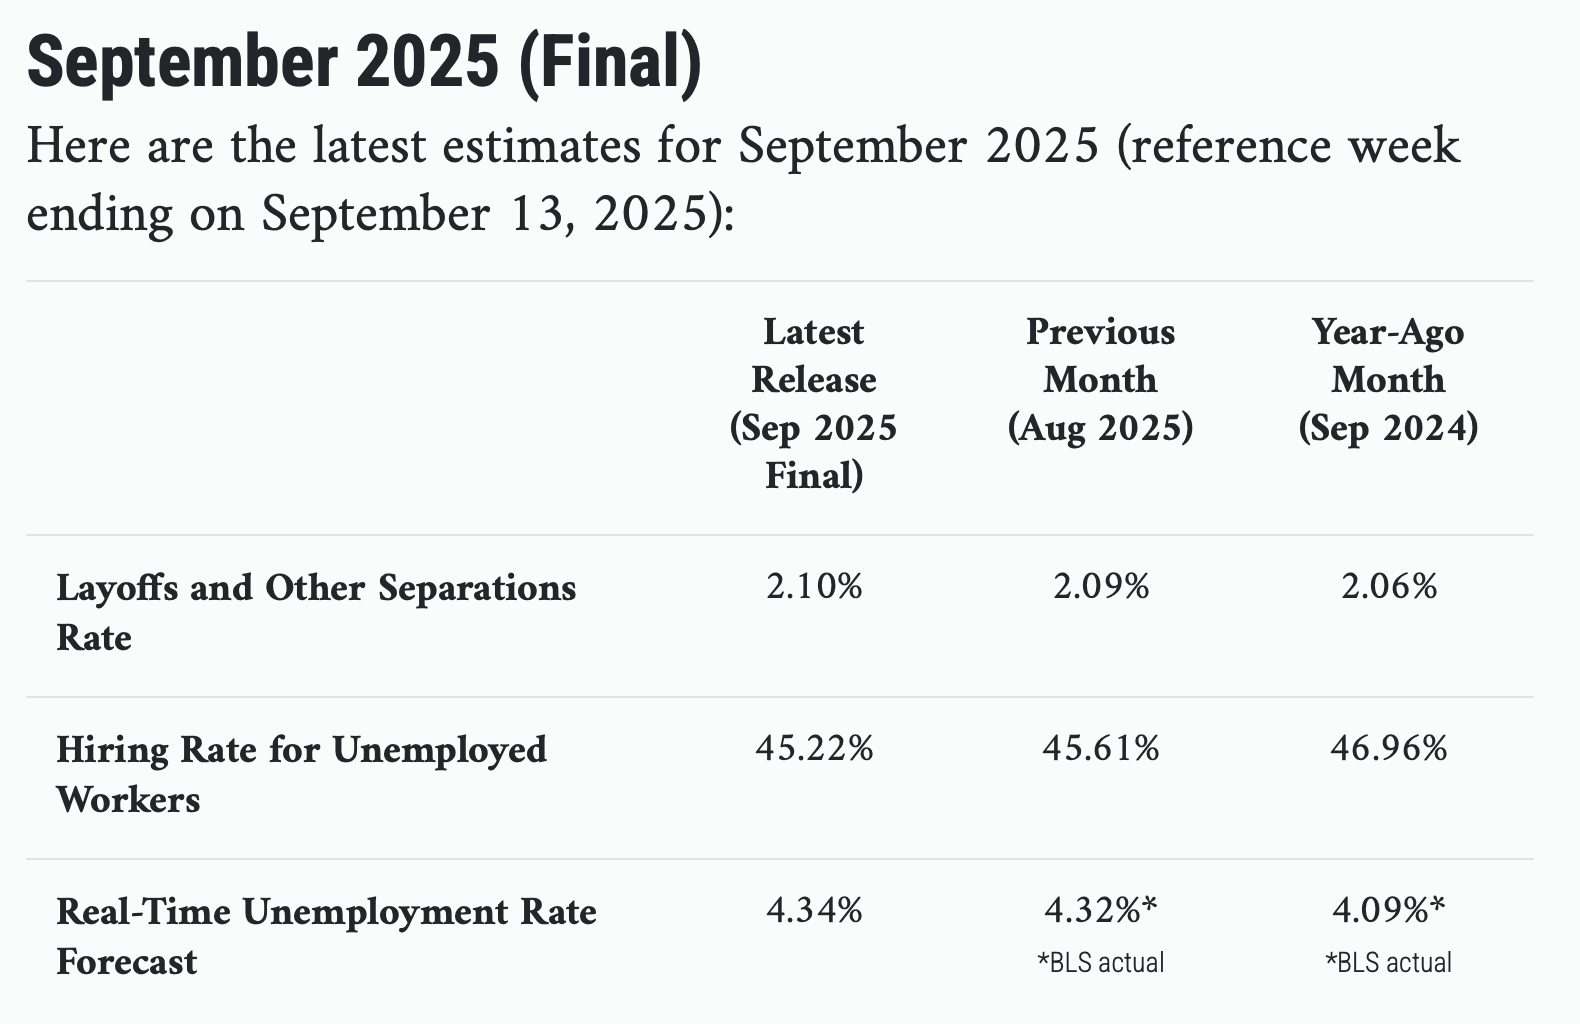
Our real-time estimate is that the unemployment rate would’ve stayed the same at 4.3%
The hiring rate of unemployed workers went down a tiny fraction. It still remains basically 45%.
The layoff and the separation rates are also very constant, just a little above 2%.
So I feel like those numbers are showing the steadiness in the job market that is a bit in contrast to those monthly payroll numbers which are all over the map.
Flows and Payrolls
Kyla: Could you talk about sort of the difference between the metric that you all have created relative to what the government produces? There is a lot of concern about the labor market. People are having a tough time finding jobs.
PG: Let’s get down in the weeds of how it is constructed, and then let’s take a step back and think about what it means for the actual state of the labor market.
The JOLTS (Job Opening and Labor Turnover) survey data are about the flows.
The job market is like a bathtub and there’s water going out and there’s water going in. If you look at the speed that the water’s coming in and the speed that the water’s going out, it will tell you something about the level of the bathtub.
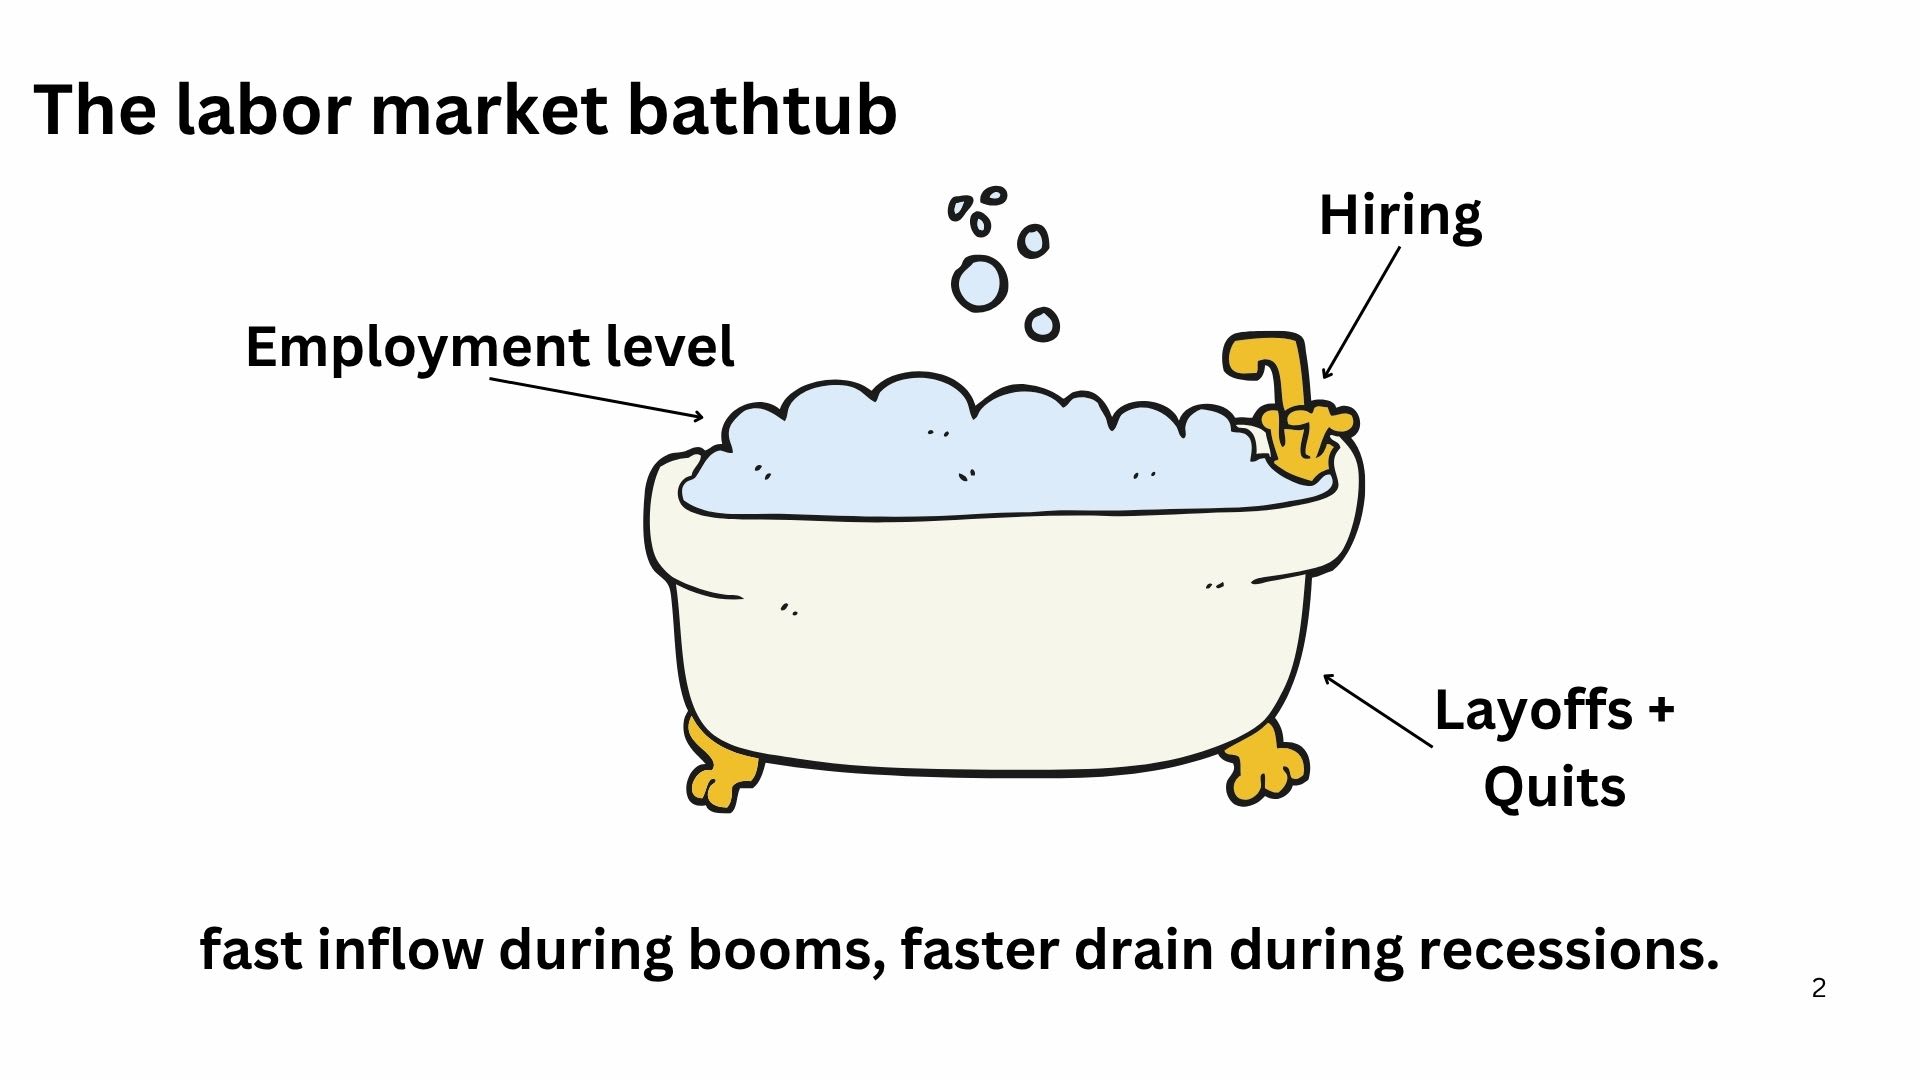
That’s the approach that we’re taking with these statistics. We’re basically trying to add up ‘What’s the chance that you come out of unemployment and into employment?’ That would affect the unemployment rate. ‘What’s the chance that you have a job and you lose that job?’ Either you quit or you’re laid off or discharged, etc.
By measuring those from all the angles that we can, we can use the past and say - in the past when all of these indicators said ABC, what did that mean for the unemployment rate? So that’s the way we construct it.
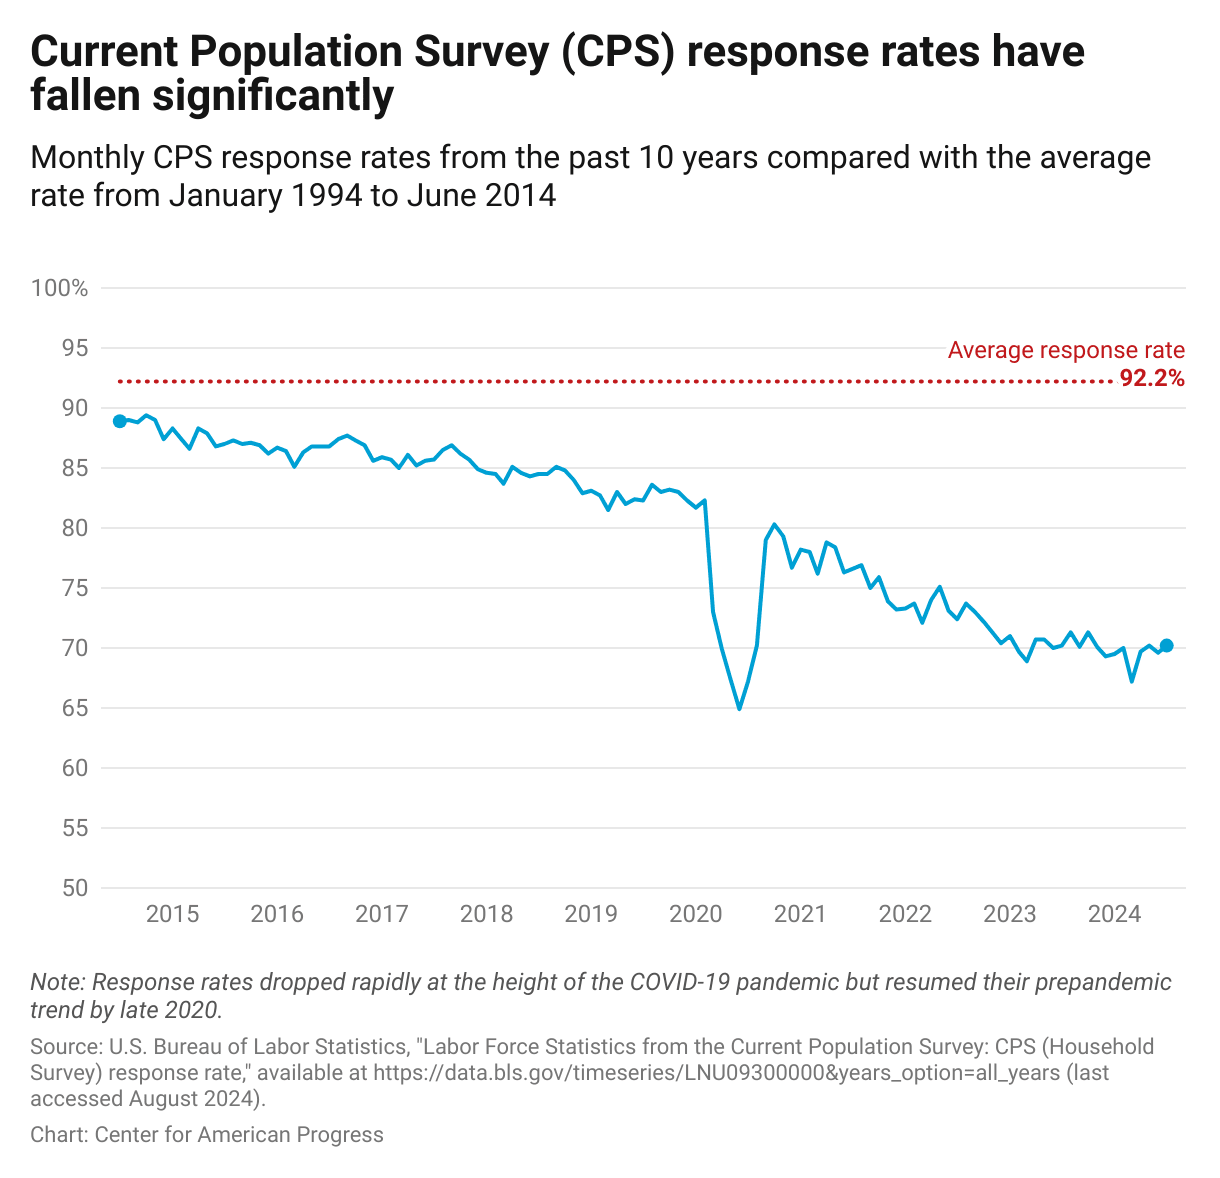
That’s a little different than the unemployment rate that the BLS puts out, which comes from the Current Population Survey, which contacts tens of thousands of people and just asks them, “did you have a job last week?” As I say, the BLS data is the best there is, but it’s not without flaws and it’s in an environment where people don’t like answering their phone and they don’t like doing surveys. You’ve seen the response rate even of the BLS data really fall almost in half. It’s not just the BLS that has that problem. All private data have that problem. Everybody has that problem.
So we’ve got more variability, and the official data are so good that it takes a long time to put them together at that high of a quality. It comes out with more of a lag than would be ideal. I always say that I’m one of the data dogs on the FOMC and a central rule of the data dogs is to sniff every piece of data that hits the floor because it might be food.
At moments like this, where some of our tent pole marquee numbers like payroll and employment have question marks about whether they’re a good indicator of where we are in the business cycle, whether because of immigration or labor force participation or things like that, go sniff everything. What we’re trying to do with these labor market indicators is gather all the best data that we can find and use it to make a projection of the throughline in the job market.
Who’s Missing From the Numbers
Kyla: How does this indicator capture people who drop out of the labor force entirely, like maybe younger workers or more precarious workers?
PG: That’s a crucial issue. The Chicago Fed’s research department has done a lot of work about labor force participation. We’ve had some really wild swings in labor force participation, not just in the last 5 years, but really the last 10 or 15 years.
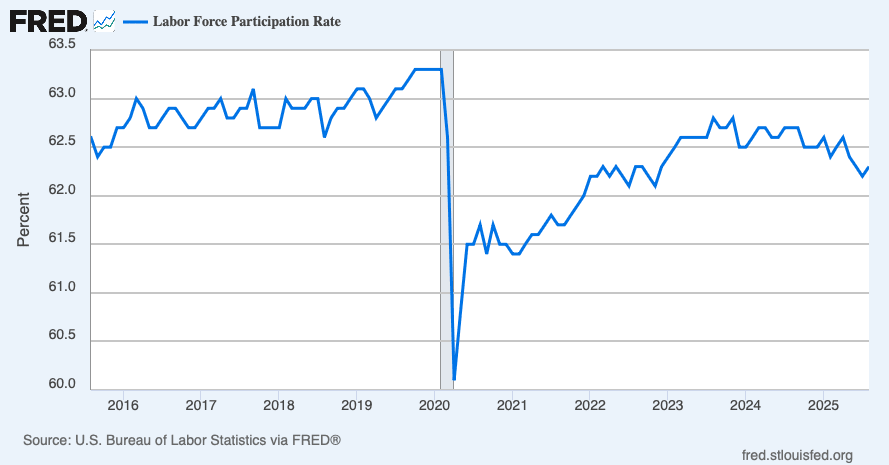
In the period since COVID, we’ve had remarkably high labor force participation for what our demographics are. The baby boom’s retiring and labor force participation was forecast to be trending down pretty significantly at this point but we’re not picking that up in our new statistics.
That is an issue facing the official data, too. The unemployment rate is only for workers that are actively seeking employment. If you stop looking for work, you drop out of the job market statistics, you’re not in the unemployment rate - and we should be nervous about that.
We should also think about the employment rate. In a world where the immigration is changing, population is aging, and women are making choices about whether to be in the labor force or not be in the labor force and whether to have kids, it’s super important when people choose not to be in the labor force, but it’s hard to track properly.
A Mindset Shift on Employment
Kyla: Do you think there has to be a mindset shift to start thinking in terms of the employment rate versus the unemployment rate?
PG: Maybe there does need to be a bit of a mindset shift. Some of it has already happened. There has been a mindset shift that took place in the wake of the Great Recession. We were having moderate recovery speed and the job market was improving but it was improving relatively slowly and the unemployment numbers were looking good, but the labor force participation rate was very low - so people were asking, “Is the job market good or is the job market bad?”
So we had to grapple with that shift in mindset. That’s what makes this last five years so interesting from a data perspective - we completely reversed that argument. Many people through the 2000s were saying, “Of course labor force participation’s going down. There’s nothing about the business cycle about that. We’re aging. That’s how it’s going to be.”
Then we saw when the labor market was as tight as we’ve ever seen, and labor force participation jumped back up higher than what we would’ve forecast where it was going to be.
But - what would it have been? It is worth thinking about where we are relative to where we would have been if there had been no changes. And that said, I still think that in the here and now, every data point that we’re getting, except for monthly payroll, is largely saying we have a pretty steady labor market with low hiring and low firing. That’s unusual, but that is where we are. That might be full employment and that’s the thing that we’re having to chew on a little bit.
Reading the Cycle
Kyla: The Fed entered a rate cutting cycle and cited a slowing labor market as perhaps one of the reasons for that. So how do you think the Fed and policymakers in general should think about this new data when thinking about the direction that they want to go with policy decisions?
PG: I hope that they will use this data. Now, you know the rules of the FOMC. I’m not allowed to speak for what anybody else thinks or what the Fed thinks, only for myself.
What I look for in these data indicators that the Chicago Fed is putting out and in all the other indicators is very much trying to get the throughline- where we are in the business cycle.
In normal times, the number of jobs in the aggregate is normally pretty strongly correlated with where we are in a business cycle.
If it goes negative - that’s a sign that recession may be coming.
If you start seeing big positives, that’s a sign to be wary that the economy’s overheating.
We saw in 2023 and 2024 how wrong that can go. It was the other way. We were getting lots of unrecognized immigration. The population growth rate was higher than we knew when we were making the estimates. We were having hundreds thousands of jobs created each month, well in excess of what we thought was a breakeven rate. So, there were a bunch of people looking at payroll employment and saying, “We’re overheating. Inflation is about to come booming back because how can we sustain jobs numbers as big as this?”
We came to find out the jobs numbers were reflecting fluctuations in labor supply and population that we didn’t know at the time. And the lesson of that period I think was that measures of labor market rates like the layoff rate, the vacancy rate, the unemployment rate, the hiring rate were more accurate indicators of where we were in the business cycle than the monthly payroll was.
So, I hope that people look at these Chicago Fed indicatorsas perhaps a better indication of where we are in the job market when there are moments where immigration and others are making the population uncertain.
Kyla: One of my favorite think tanks is Employ America. They advocate for looking at the quits rate because they’re like, listen, if people feel like they can quit their job, that’s probably a pretty good indicator of what’s going on in the labor market.
PG: The quits rate is really low right now, and the hiring rate is low, those would point to danger. But the layoff rate is very low and that usually points to the opposite.
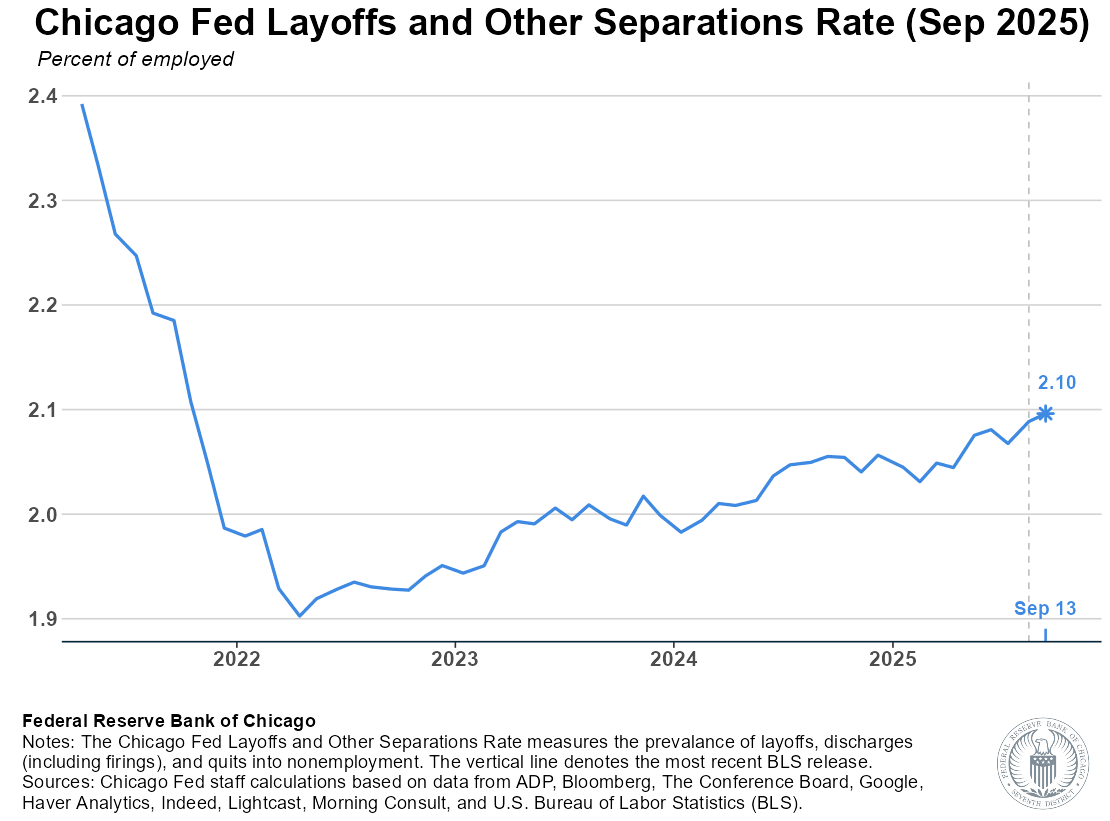
Usually when you go into recession, layoffs go way up, and we are not really seeing that. So it’s a bit of a puzzle. There are cross currents in the data that we’re grappling with. Almost all of them have been steady. So that low hiring, low firing environment has been with us now for a fair bit of time. It doesn’t exactly look like we’re on the precipice of something in the way that if you over index on the monthly payroll declines and the revisions being big negatives, you could convince yourself that maybe this is the edge of a precipice - but most of the other indicators are not that.
AI and the Entry-Level Worker
Kyla: I want to ask you an AI question, sorry. There’s been a lot of debate on if AI is replacing young people. So when you think about the labor market indicators and when you think about how the Fed thinks about the labor market indicators, how do you think AI is going to tie into all of that, especially for younger people?
PG: Both sides of that question are really important. In the long run that is the same thing as asking, “how big of a productivity growth increase is AI going to give us?” And if the productivity growth rate that comes from AI is so big that employers don’t need to hire people, they can even let go of people because they can get the output that they’re desiring with fewer people, then it would have a labor market impact.
But on this side of the ledger, I just want to remind everybody that high productivity growth is fabulous. We want high productivity growth. Let’s pray that we get to deal with the issues of transition. If you don’t have productivity growth, real wages can’t rise, and that’s a far bigger problem.
Now, on the other side of this ledger is the differential impacts. If AI is as big as its proponents say, will that have differential impacts on different parts of the labor market? Probably it will - both by industry and potentially by age. You’ve seen that play out a little bit, but I still characterize most of what people are saying as forecasts for the future; that there is going to be huge improvement. They are going to replace accountants, replace lawyers, replace various occupations.
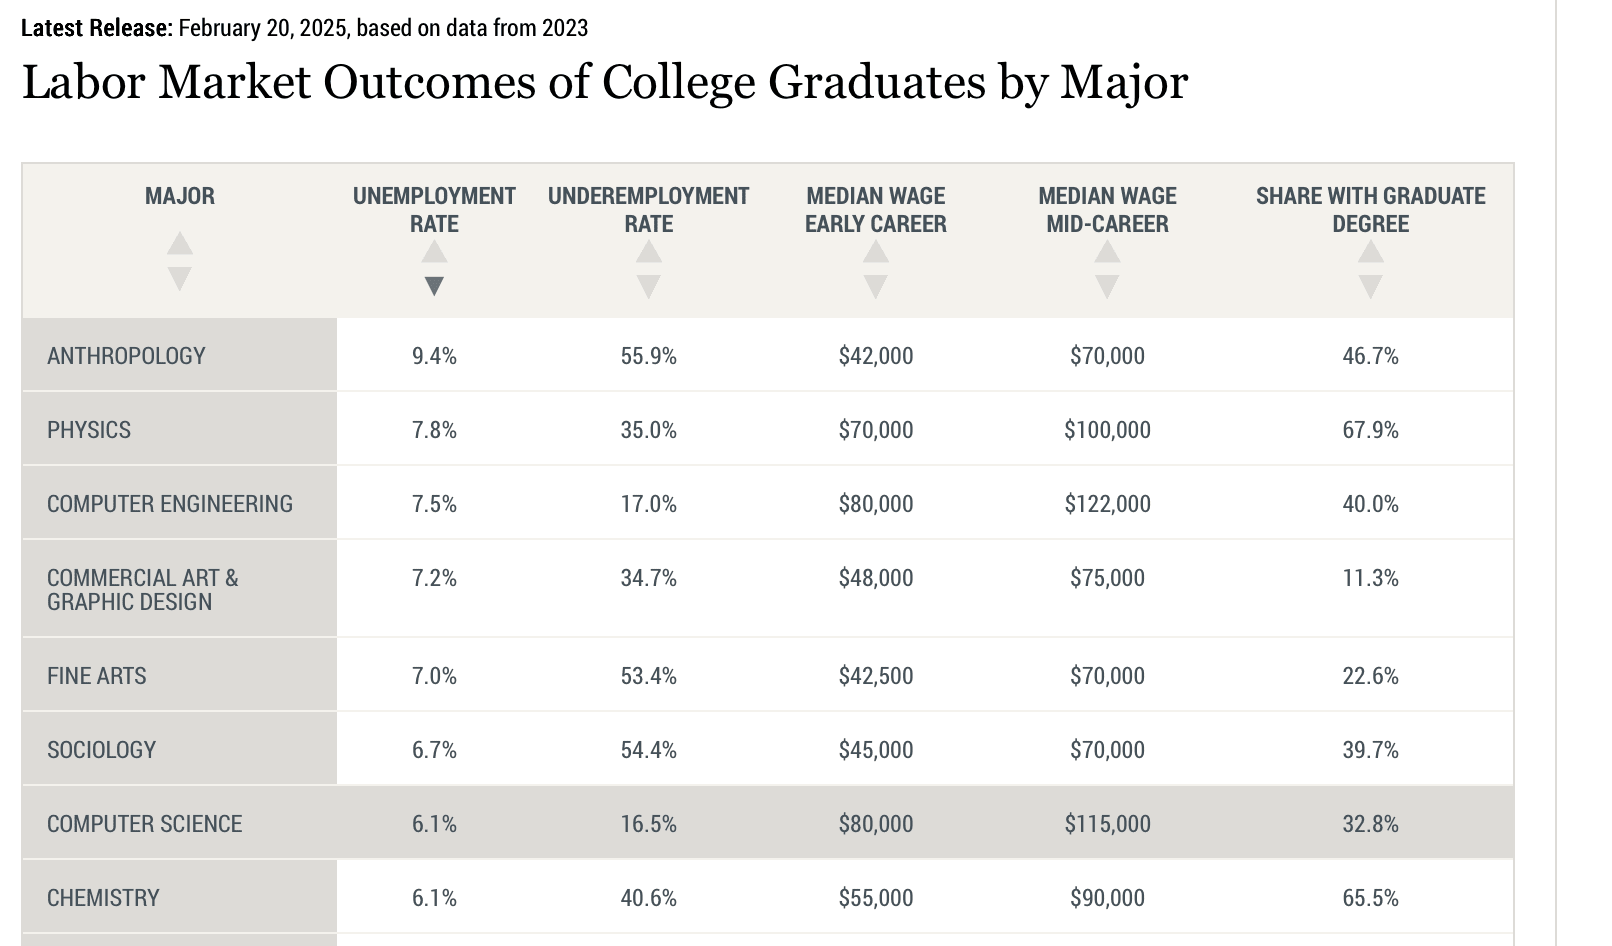
I do think you’ve seen the impact in the hiring rate of young workers, especially in tech. If you look at the unemployment rate of new graduates in STEM fields and computer fields, that used to be the lowest of all the majors. Now it’s among the highest of all the majors, but it’s worth objectively pointing out, it’s still pretty low.
If you look at computer science graduates, the hiring rate is low, but the unemployment rate is not objectively that high. It’s just frustrating compared to what the job market was for the previous five years.
I am a great believer in the ability of young people adapting and moving into new industries. If you don’t think that will happen now, I would simply caution you to just go back and look back 30 years and go to Silicon Valley. What were they doing? It’s fundamentally different. If you go back far enough, they were making hardware. Making chips that now are low end chips made in other countries. They were doing the kinds of software that nobody does anymore, but that hasn’t made Silicon Valley an unpleasant place to work because they just kept moving from thing to thing, which you can do if you have the skillset.
The Breadth Problem
Kyla: The labor market has a breadth problem. Back when the government was working, we would get data saying that most of the jobs added were just in healthcare and social services. Manufacturing’s losing jobs, finance is losing jobs. So how do the labor market indicators that you all have developed think about something like that?
Goolsbee: We haven’t gone into sectoral information in our new statistics. If you want to do some narrower and narrower cuts of the data, you need to have bigger and bigger samples of the data.
So, it’s really mostly only the government data that can pull that off. If you want to do something that’s a 1% sample, you need a big sample for that to be able to count on it. That said, we had such a strange sectoral business cycle coming through COVID. It was like nothing that ever happened before. Normally, cyclical industries drive the recession and the most cyclical industries are the most rate sensitive parts of the economy, and that’s why the Fed is the natural touch point for economic stabilization, consumer durables, business investment, housing construction. These are very cyclical parts of the economy usually, and they’re very interest rate sensitive.
If you start seeing those going down and then the Fed cuts the interest rate, that tends to buck them back up. And if the economy’s overheating, it’s usually because those sectors are overheating, so raising the interest rate cools them down. COVID was a recession driven by services. Nobody can spend their money on going to the dentist and stuff like that. It’s the first recession I think ever where the demand for consumer durables goes up in the recession and the demand for housing goes up in the recession.
Part of what we’re seeing on the jobs front is a bit of a recalibration, of resetting back to the old trend that we used to spend before COVID where 75 - 80% of our consumer spending budget was on services. Then we go through this weird period where all we can buy are physical goods and everybody’s getting a Peloton, and now we’re shifting back.
That will contribute to a breadth problem. All of that said, over time we’ve gotten more and more healthcare oriented. So it’s not surprising that healthcare is going to be a bigger and bigger share of the jobs, leisure, and hospitality in a world where there is productivity growth, either from AI or from anything else that’s so far been concentrated in physical goods.
For example, the price of TVs gets cut in half. You don’t buy two TVs, you just still buy the same TV, but you just spend less of your income on it. More of your income starts going to human beings. Human beings are the thing that gets more expensive. So part of that breadth problem might be natural.
Kyla: What do you think the one thing that you would want the public to take away from this data release?
PG: I’ll give you one and a half things. The half thing is it’s important that we get the official data and if we don’t have the official data, we at least have some estimates that we can get from the private sector and the public sector. The longer we don’t have the highest quality data, the worse it’s going to be.
The other thing that jumps out at you from these indicators is the stability of the job market. So far, it is not falling apart. The hiring rate is relatively low, but stable. The layoff rate is also low and stable, and the unemployment rate is largely unchanged, which is a point of stability. I am here on Kyla Scanlon’s show so you knew we had to talk about vibes. We are potentially going to be back into one of these conflicts between the data and the vibes sometime soon. Because if you look at the history of consumer sentiment, government shutdowns have often been correlated with big drops in consumer sentiment.
Kyla: Absolutely. Thank you so much, President Goolsbee.
Four Takeaways
Employment growth is an unreliable signal and slack is the story now: Goolsbee underscored that traditional measures like monthly payrolls have become noisy and potentially misleading, especially when immigration, labor-force participation, and survey response rates are volatile. His team’s new Chicago Fed Labor Market Indicators are meant to fill this data vacuum by tracking flows in and out of employment. This directly echoes Guy Berger’s argument in “We Don’t Need More Employment Growth Nowcasts!”: the economy no longer needs more guesses about payrolls; it needs slack nowcasts - these real-time measures of hiring rates, separations, and the true level of labor-market tightness. Goolsbee’s “bathtub” metaphor (inflows and outflows) is exactly that kind of slack measurement.
The labor market is stable, but thin: Goolsbee called it a “low-hiring, low-firing” environment - but a steady environment overall. The Chicago Fed’s real-time estimate shows an unchanged 4.3% unemployment rate, hiring of unemployed workers holding near 45%, and layoffs just above 2%. That calm contrasts with Carlyle’s grim payroll read, which implied a slowdown. But this is clearly a push-and-pull problem. It underscores Mohamed El-Erian’s warning in “As Growth Decouples From Employment, the Fed Faces a Trilemma.” GDP growth (Carlyle pegged it at 2.7%) remains solid even as job creation sputters. The US economy is expanding, but the labor market isn’t broadening and so what looks like stability may actually be brittleness. Markets, however, are treating weak payrolls as a green light for rate cuts. El-Erian calls that a dangerous loop: easing policy to offset soft employment could inflate risk assets while inflation remains above target - and with data telling such different stories, it’s even more confusing to figure out what’s going on.
Labor-force participation should guide the narrative: Maybe we do need a mindset shift! Instead of obsessing over the unemployment rate, which does exclude discouraged workers, Goolsbee suggested tracking the employment-to-population ratio. In his words, “We should also think about the employment rate. That’s an important measure of the economy.” This is where Goolsbee and Berger converge: the next frontier in labor data is coverage. Who’s missing from the numbers is now the more consequential question.
Oh, vibes: The Carlyle data reinforces a paradox: inflation is still sticky, while the labor market looks weak. Goolsbee’s indicators show a steady job market, not one in crisis, yet sentiment could deteriorate as the shutdown drags on. “We might be back into one of these conflicts between the data and the vibes,” he said. In other words: the real trilemma isn’t inflation-jobs-stability. It’s data-vibes-policy.
The bigger picture is that we’re entering a phase where labor data itself is becoming a policy variable. The government shutdown, new private estimates, and the Chicago Fed’s real-time model all point to the same problem: we’re flying on fuzzier instruments.
At the same time, the economy looks steady but thin with a job market that feels fragile beneath the surface. Goolsbee’s point is that we need to measure better before we can decide better because the next policy mistake may not come from getting the economy wrong, but from misreading the data that defines it.
This is a reader-supported publication. To receive new posts and support my work, consider becoming a paid subscriber.
Thanks for reading.