Dogecoin price has spent several days oscillating between $0.24 and $0.27, avoiding both sharp drops and significant increases. Over the past week, the price has fallen 2.9%, while it has increased just 4.2% over the past month — a neutral period that suggests a balance between buyers and sellers.
But this balance is no accident. On- chain data shows that large supply clusters are keeping Dogecoin in a tight range, while leverage data confirms that neither side has enough momentum to break the stalemate.
Supply Density Explains Why Dogecoin Price Is Stuck
Glassnode 's cost basis distribution heatmap — which visualizes the amount of supply that exists at different price levels — highlights why Dogecoin price has avoided large swings.
Between $0.247–$0.249 (at the time of writing), there are around 1.89 billion Doge, creating a thick cushion protecting against further declines, especially below $0.24.
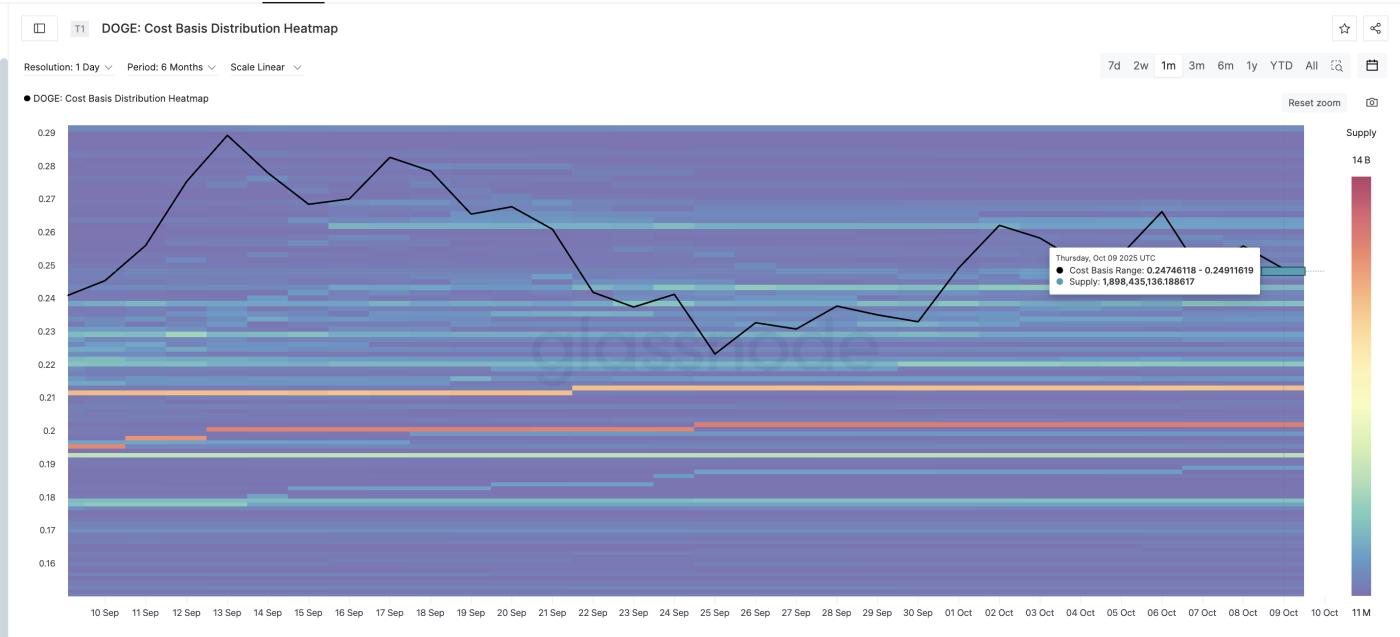 Dogecoin Important Support Levels : Glassnode
Above that, the resistance zones are also dense: between $0.261–0.262, there are about 1.39 billion Doge, and another 1.27 billion Doge between $0.262–0.264. These clusters specifically protect the $0.27 level.
Want more information about Token like this? Sign up for Editor Harsh Notariya's daily Crypto Newsletter here .
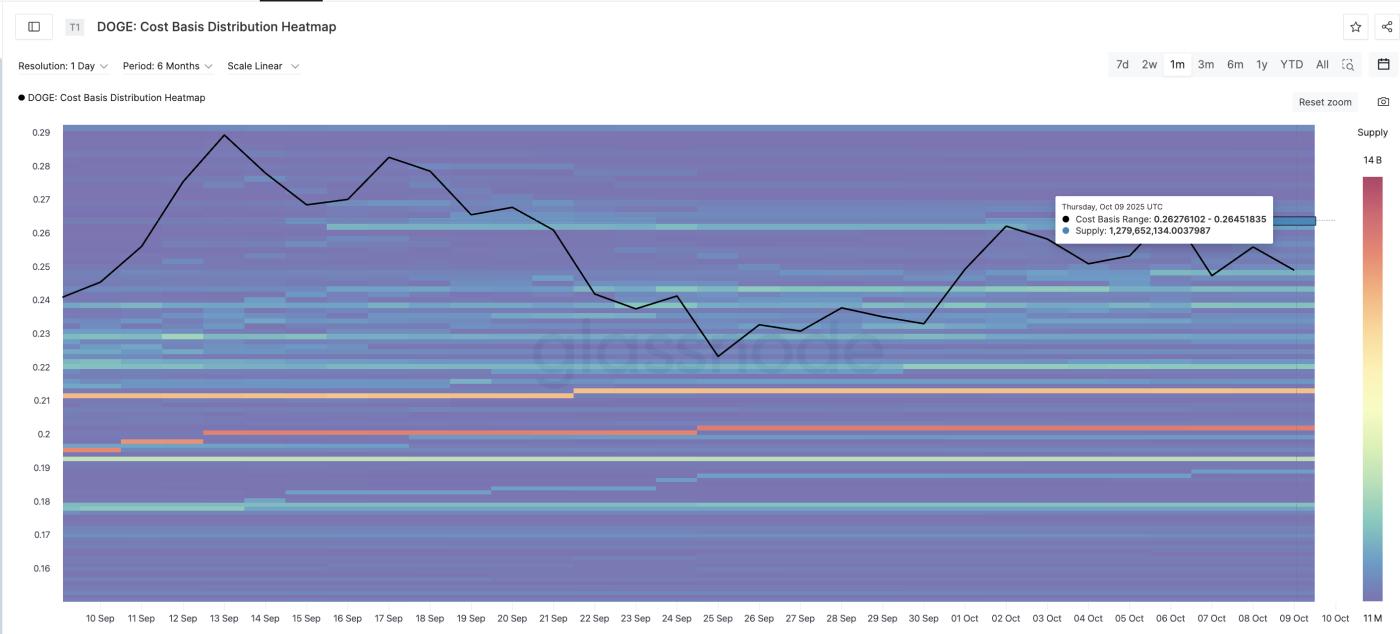 Dogecoin Important Resistance Levels : Glassnode
This tight supply layer has made Dogecoin price resilient to sharp drops but unable to rise significantly above $0.26-0.27. It's like a wall above and a floor below, keeping the price in a narrow corridor.
Derivative data supports this balance. According to Bitget ’s Doge/ USDT liquidation map, long positions totaled $304 million, while short positions were closer to $331 million. With both sides roughly balanced, there is no leverage imbalance to create a squeeze or extend the trend.
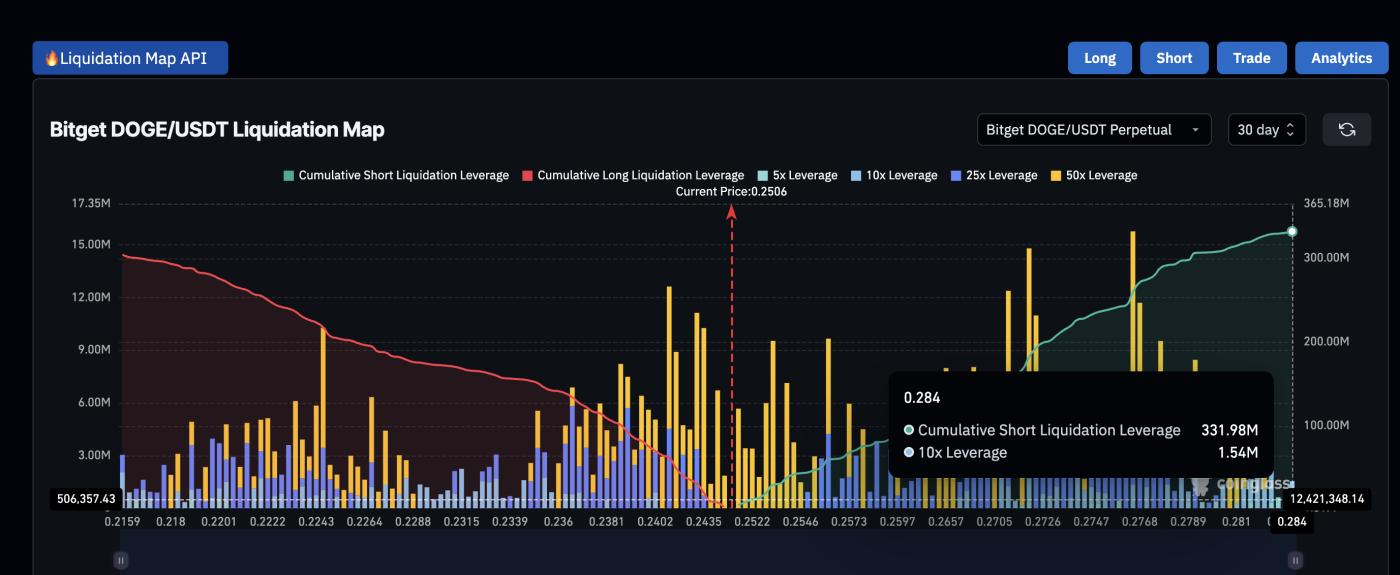 Bitget Liquidation Map : Coinglass
Together, the heatmap and Derivative data explain why Dogecoin has consistently avoided both drops and rallies — there is too much resistance to rise and too much support to fall.
A key chart pattern hints at a 20% recovery
On the 4-hour chart, the Dogecoin price is currently showing a familiar pattern — bullish divergence. This pattern forms when the price makes a lower Dip , but the Relative Strength Index (RSI) — which measures market momentum between 0 and 100 — makes a higher Dip . It signals that sellers are losing strength even before the price reacts.
This divergence reappeared between October 8 and October 9. The last time it appeared, between September 22 and September 26, Dogecoin increased by 20%, from $0.22 to $0.26.
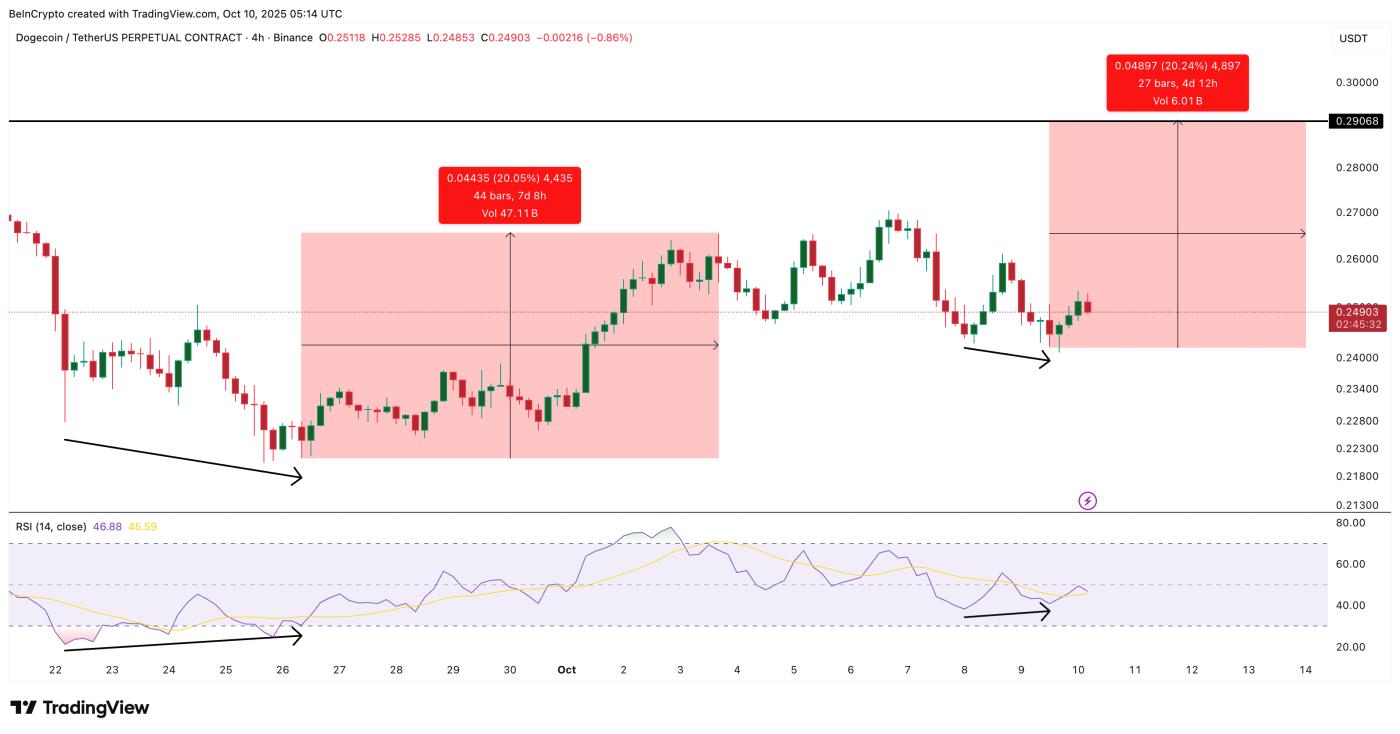 Dogecoin Price Model : TradingView
A similar 20% move now could lift Doge from the current range to near $0.29, allowing it to break above the heavy supply bands between $0.26–$0.27. A break of these zones could eventually kick off a short-term uptrend.
Symmetrical Triangle Still Shapes Doge Next Price Move
On the daily chart, Doge continues to trade within a symmetrical triangle, a structure formed when both buyers and sellers hold the price within a tight range. This pattern reflects indecision — a setup that often precedes a strong breakout when one of the two sides gains control.
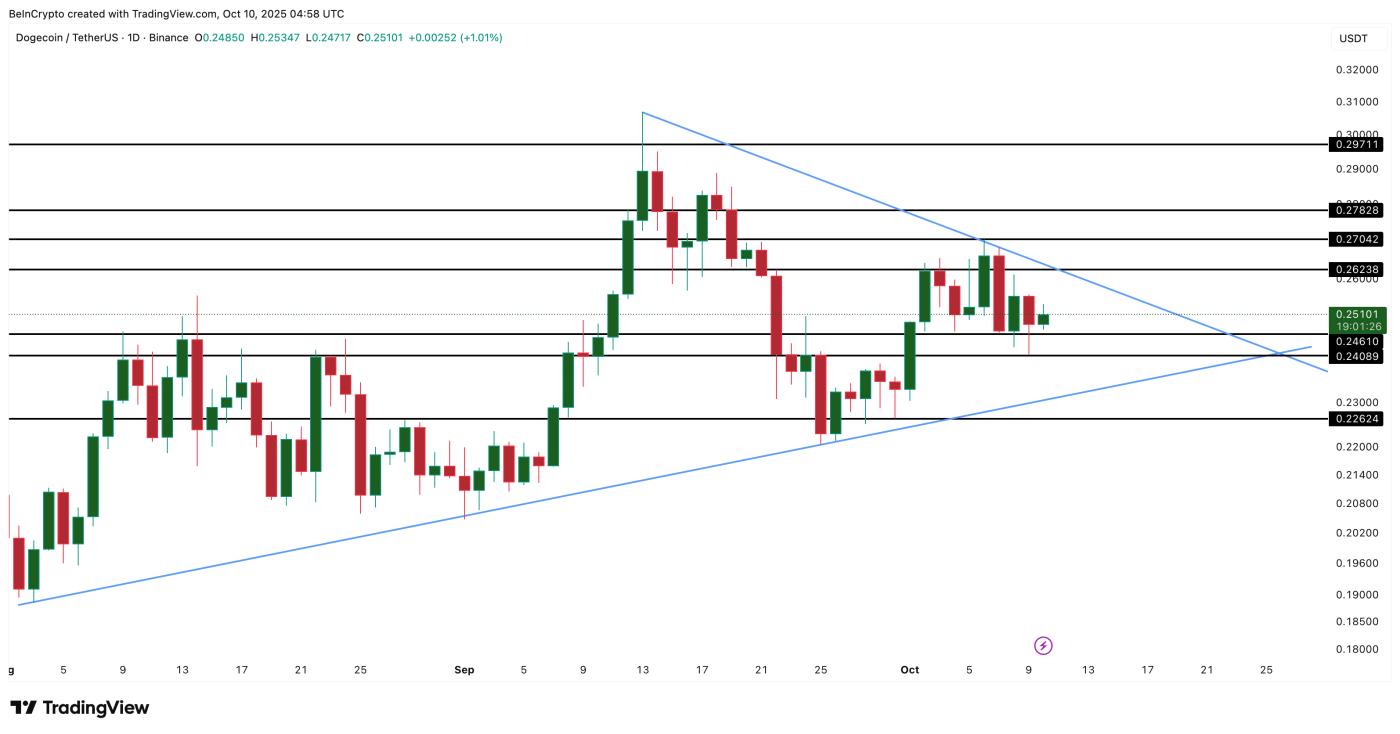 Dogecoin (Doge) Price Analysis: TradingView
For bulls, a close above $0.27–$0.29 could confirm an upward breakout (currently possible with the bullish divergence appearing on the 4-hour chart), signaling the start of a short-term rally. For bears, a daily candle close below $0.24 would invalidate the uptrend and open the door for a deeper correction. A drop below $0.22 would turn the structure bearish.
Until then, the Dogecoin price has remained in careful balance — avoiding both a crash and a rally for one obvious reason: supply/demand is still too evenly balanced, but a 20% move could eventually tip the scales.